×
![]()
Corresponding Author: Virginie Sottile
Department of Molecular Medicine, University of Pavia
Via Ferrata, 9, 27100 Pavia (Italy)
E-Mail virginie.sottile@unipv.it
Osteogenic Response of Human Mesenchymal Stem Cells Analysed Using Combined Intracellular and Extracellular Metabolomic Monitoring
Amal Surratia Sergey Evseevb Fabien Jourdanc Dong-Hyun Kimb Virginie Sottilea,d
aSchool of Medicine, The University of Nottingham, Nottingham, UK, bCentre for Analytical Bioscience, Advanced Materials and Healthcare Technologies Division, School of Pharmacy, The University of Nottingham, Nottingham, UK, cToxalim (Research Center in Food Toxicology), Université de Toulouse, INRAE, ENVT, INP-Purpan, UPS, Toulouse, France, dDepartment of Molecular Medicine, The University of Pavia, Pavia, Italy
Introduction
Skeletal metabolism is an important aspect of healthy ageing, and bone loss, leading to osteopenia and bone fracture, has heavy consequences on quality of life and healthcare requirements. Bone mineral density is used to evaluate strength and predict fractures [1, 2].
Bone quality is characterized by its microarchitecture, turnover rate, micro-damage accumulation, calcification and bone matrix quality [3-5], however most standard bone monitoring systems do not accurately reflect the metabolic status of the tissue [6, 7]. Recent clinical assays focus on the measurement of urine/blood levels of compounds reflecting bone metabolism such as calcium [8], however calcium deficiency is not always associated with bone loss [9]. While the measurement of biochemical markers such as deoxypyridinoline formed during collagen maturation already represents an important clinical parameter for osteopenia management [10, 11], advanced metabolomics approaches have been instigated for prediction and diagnosis applications [12].
Global metabolite profiling offers a comprehensive measurement of small biomolecules produced in living cells, excreted metabolites from the cells into their microenvironment and taken up by the cells from a culture medium [13, 14]. Especially, liquid chromatography-mass spectrometry (LC-MS)-based metabolomics is a powerful analytical tool allowing the monitoring of alterations in cell metabolism and producing a rapid snapshot of the comprehensive physiological status of the cells. Furthermore, LC-MS-based approaches have been applied to the quantitative analysis of intracellular metabolites in biological samples, and extracellular metabolites and nutrients in cell cultures, including mouse mesenchymal stem cells (MSCs) [15].
The maintenance of bone mass and quality is regulated by osteoblasts; this cell type is replenished by the osteogenic differentiation of mesenchymal progenitors [16, 17]. MSCs are multipotent somatic progenitors able to differentiate into osteogenic, chondrogenic and adipogenic lineages [18]. Their capacities to generate new osteoblasts, the bone-forming cell type, and the possibility of harvesting them from bone marrow collections have made them a promising candidate for therapeutic approaches to skeletal repair [19]. Numerous in vitro studies have established the osteoinductive effect of treatments combining dexamethasone, ascorbic acid, and beta-glycerophosphate (βGP) to promote MSC differentiation [20-25]. In order to understand the association between intra and extrametabolic pathway changes occurring during osteogenic differentiation of human mesenchymal stem cells, global metabolite profiling was performed on both human MSC extracts and their cell culture media using LC-MS to identify intracellular and extracellular metabolite changes occurring during differentiation. A new set of differentially detected compounds of biological relevance was identified, highlighting the potential of LC-MS-based metabolomics approaches for the quantitative time-point analysis of human MSC differentiation.
Materials and Methods
Reagents were purchased from ThermoFisher Scientific (Hemel Hempstead, UK) unless otherwise stated.
Cell culture and differentiation
An immortalised cell line of human bone marrow mesenchymal stem cells (MSCs) [26] was seeded at density of 3x10⁴ cells/ml in standard MSC medium consisting of Dulbecco’s Modified Eagle’s Medium (DMEM), 10% FCS, 1 mM L-glutamine, 1% non-essential amino acids and 10% antibiotics, and incubated at 37°C in 5% CO2. For differentiation, confluent cells were treated with osteogenic medium (OS) consisting of standard MSC medium supplemented with 100 nm dexamethazone (Sigma-Aldrich, Gillingham, UK), 0.05 mM L-ascorbic acid 2 phosphate (Acros Organics, Geel, Belgium) and 10 mM beta glycerophosphate (βGP, Sigma-Aldrich) for 21 days with medium changes every 2 days. Parallel cultures maintained in standard MSC medium were used as untreated controls (C).
Metabolic activity assay and DNA quantitation
Metabolic activity was measured at days 7, 14 and 21 using a PrestoBlue Cell Viability assay. Medium was aspirated and 100 µl of 10% Presto Blue reagent in HBSS solution was added into each well for 50 min at 37°C, 5% CO2. The solution was then transferred into a new 96-well plate, and fluorescent excitation and emission were measured at 560 nm and 590 nm, respectively, using a TECAN infinite 200 plate reader. Cells were then washed with PBS three times; followed by the addition of sterile distilled water and 3 cycles of freezing and thawing to insure nuclear rapture and DNA release. A DNA standard curve (Quant-iT PicoGreen ds DNA assay Kit) was used to determine the concentration of DNA in each sample. 100 µl of λ DNA standard in buffer was added into each well and incubated for 5 min at RT in the dark. The reagent was then transferred into a 96-well plate flat bottom and fluorescent intensity was measured using a TECAN infinite 200 plate reader at 480 nm excitation and 520 nm emission.
Mineral deposition analysis and Alkaline Phosphatase activity assay
Calcium deposits were analysed using Alizarin Red staining. At each stated time point, cells from 4 replicates were trypsinised and pellets were smeared onto glass slides, air dried, fixed with 100% methanol and washed with distilled water. Slides were incubated in 1% Alizarin Red staining solution (Sigma-Aldrich) for 10 min at room temperature, and washed with distilled water until all excess stain had been removed. Mineral deposits were then observed using a Nikon Eclipse Ni90 light microscope. In parallel, Alkaline phosphatase (ALP) activity was measured using 100 µl SIGMA FAST p-Nitrophenyl Phosphate reagent (Sigma-Aldrich) for 20 min at 37°C, 5% CO2. 100 µl from each sample transferred to a 96-well plate were analysed in triplicate using an Infinite 200 plate reader to measure absorbance at 405 nm. Data are presented as mean ± standard deviation and presented using GraphPad Prism 7; statistical significance was analysed using two-way Annova with p < 0.05 considered significant.
Metabolite extraction
For intracellular metabolite extraction at day 0, 14 and 21, medium of each culture was aspirated and cells were washed with PBS pre-warmed at 37°C and quenched by 1 ml of pre-cooled methanol at -48°C. While flasks were kept on ice, cells were removed using a cell scraper and the suspension was transferred into pre-cooled fresh tubes. Extraction was then performed by four freeze/thaw cycles (flash frozen in liquid nitrogen for 1 min, thawed on ice and vortexed for 30 s). Samples were then centrifuged at 17,000 rpm at 4°C for 10 min, transferred to pre-cooled tubes and stored at -80°C until LC-MS analysis [14].
For extracellular metabolite extraction at day 0, 14 and 21, 1 ml of culture medium was collected and centrifuged at 10,000 rpm for 5 min. 250 µl of the collected medium were transferred to a new tube for metabolite extraction and protein precipitation by adding 750 µl of cold methanol (-20°C) in a ratio of 4:1, then mixing vigorously and incubating at -20°C for 20 min. Extracts were centrifuged at 17,000 rpm for 10 min at 4°C, transferred to pre-cooled tubes and stored at -80°C until LC-MS analysis. Samples of fresh standard MSC medium (C-blk) and OS medium (OS-blk) were processed in parallel as no-cell controls. All samples were prepared with six replicates, and the experiment was run as two successive independent repeats. An equal mixture of all samples was prepared as quality control for instrument performance assessment [27, 28].
LC-MS analytical methodology
For both the intracellular and extracellular metabolite profiling, LC-MS was performed on an Accela system coupled to an Exactive MS (Thermo Fisher Scientific, Hemel Hempstead, UK) as previously described [28, 29]. Briefly, capillary voltage was 40 V (ESI+) and 30 V (ESI-), the spray voltage was 4.5 kV (ESI+) and 3.5 kV (ESI-), skimmer voltage was 20 V (ESI+) and 18 V (ESI-) and tube lens voltage was 70 V for the both modes. The temperature for capillary and probe was maintained at 275°C and 150°C, respectively. Intracellular and extracellular metabolites were separated on ZIC-pHILIC (4.6 × 150 mm and 5 μm particle size, Merck Sequant, Watford, UK). Chromatographic separation was carried out according to a linear gradient as following: 0–15 min (20% A – 20 mM ammonium carbonate in water; 80% B – acetonitrile), 15–17 min (95% A), and 17–24 min (20% A) at 300 μl/min flow rate. The injection volume of 10 μl and the column was kept at 45°C.
Metabolite identification and data analysis
Metabolites were processed with XCMS for untargeted peak-picking [30], and peak matching and annotation of related peaks were carried out using mzMatch [31]. IDEOM was used for putative metabolite identification and noise filtering with default parameters [32]. Metabolites were identified with four levels of confidence; level 1 identification was based on accurate masses and retention times of authentic standards, level 2 identification was based on accurate masses and predicted retention times. The identification criteria were according to a minimum reporting standard from the metabolomics standards initiative [33, 34].
Orthogonal partial least squares-discriminant analysis (OPLS-DA) was carried out using Simca P+13 (Umetrics, Umeå, Sweden) (i) for general visualisation of metabolite differences between control medium samples and their controls, and OS treated medium samples and their blanks, (ii) to identify the temporal shift within control and OS treated conditions, and (iii) to observe the differences between control and OS treated medium samples (n = 6 in each group). Mass ions for discriminant biomarkers were selected by variable importance in projection values (VIP), where VIP values > 1 were considered as potential biomarkers. Cross-validation using the leave-one-out method was employed to evaluate the robustness of the generated OPLS-DA models based on the fitness of model (R2Y) and predictive ability (Q2) values [35]. Variable importance in the projection (VIP) based on OPLS models was used to determine key metabolites responsible for the metabolic difference between control and osteogenic treatment groups. Mass ions with VIP values greater than one were considered as significant metabolites which contributed to the separation.
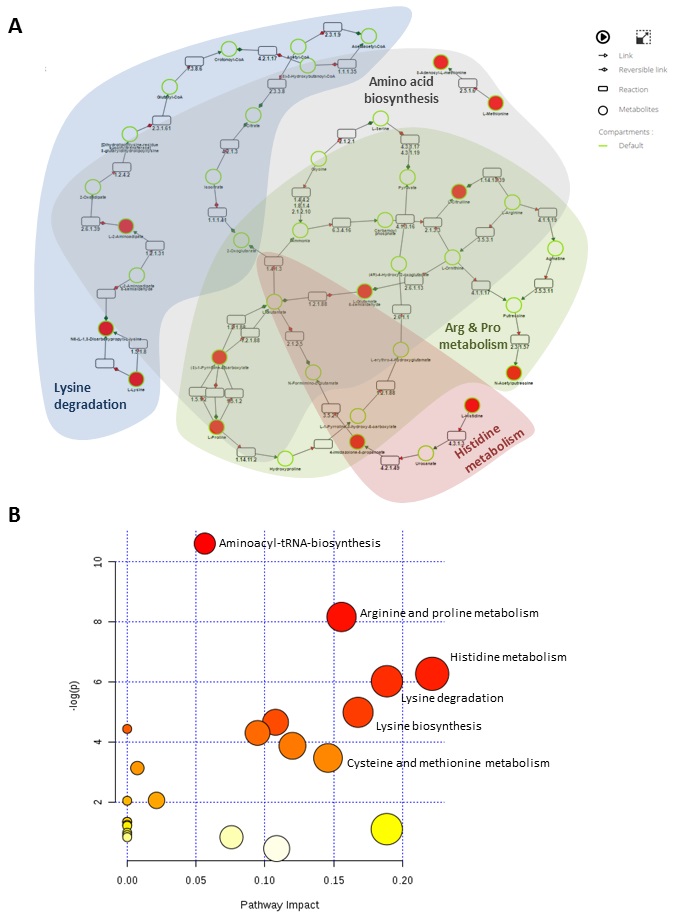
Metabolic pathway and network analysis of discriminant metabolites putatively identified were performed using MetaboAnalyst 4.0 [36] and MetExplore [37]. The normalised abundances of the metabolites were Pareto scaled and processed for metabolite enrichment and pathway analysis. Metabolic pathway mapping was based on KEGG database with ‘Homo sapiens’ selected as a biosource for MetExplore platform.
Results
In vitro model of osteogenic differentiation
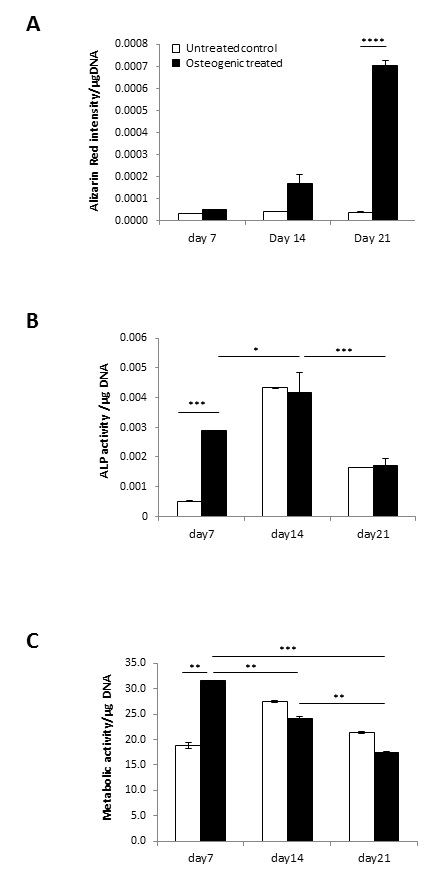
Osteogenic differentiation of human mesenchymal stem cells (MSC) was performed in vitro using an established osteogenic treatment [22] to model the cellular changes occurring upon osteogenic induction (Fig. 1). Cell growth, alkaline phosphatase activity (ALP) and mineral content were analysed to evaluate the osteogenic response over 3 weeks. No mineralisation was detected with standard medium, whilst OS conditions showed a time-dependent increase in mineral deposition at day 14 and day 21 (Fig. 1A), confirming the differentiation response. ALP activity levels increased at early time-points, with significant upregulation at day 7 followed by a notable decline toward day 21 (Fig. 1B), in line with previous reports [22, 38, 39]. Metabolic activity showed a significant increase in OS-treated conditions compared to untreated controls at day 7, which was not maintained at 14 and 21 days (Fig. 1C).
Multivariate analysis of intracellular and extracellular metabolites
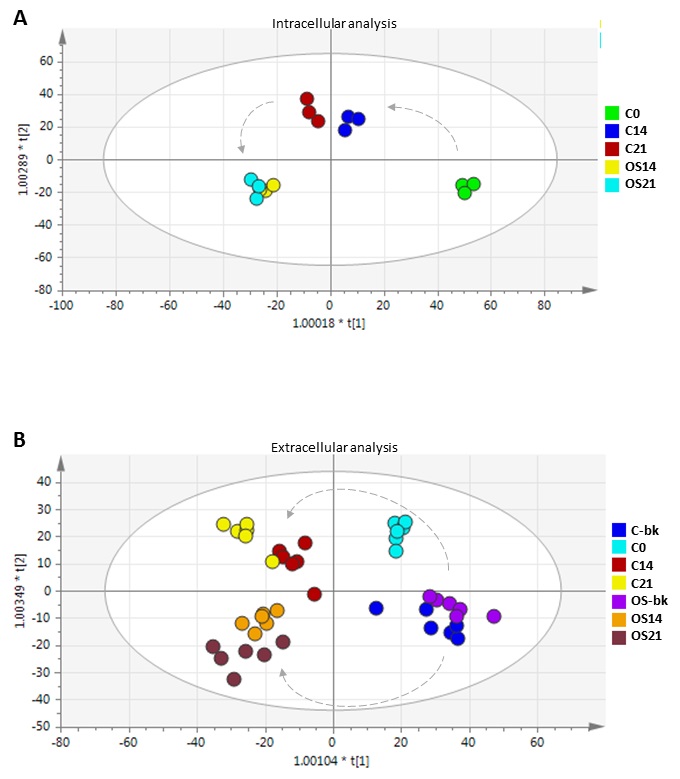
To investigate the intracellular and extracellular changes occurring in the MSC cultures over the differentiation treatment, samples were collected at day 14 and 21 and analysed by LC-MS. Results were pre-processed into 2D matrix by mzMatch to introduce exact masses and retention times. OPLS-DA was then performed to determine the overall biological variation between all conditions, and to identify noticeable trends upon conditioning with MSCs over the course of the OS treatment (Fig. 2).
OPLS-DA scores plots showed reproducible clustering of biological replicates for each sample group, and highlighted clear differences between the different culture conditions tested. Analysis of intracellular metabolites showed distinct clusters from control and OS treated MSC at different time-points, with R2 and Q2 values of 0.841 and 0.644, respectively (Fig. 2A). These values indicate that the models are less likely to be overfitted as they are higher than the recommended values of 0.50 of Q2 for a robust model [35]. For extracellular metabolites, the non-conditioned fresh media (blanks) analysed without cells showed distinct clusters from each medium sample conditioned in the presence of MSCs (Fig. 2B). Samples exposed to OS medium clustered in a different quadrant from the control medium samples in the OPLS-DA scores plot with R2 and Q2 values of 0.942 and 0.796, respectively. This multivariate analysis highlighted dynamic changes in the MSC culture medium over time in both standard and OS medium conditions, with datasets at earlier culture stages (day 0 and 14) showing closer metabolomic proximity than at the later time-point (day 21).
Intracellular metabolite profiling of MSC under OS condition
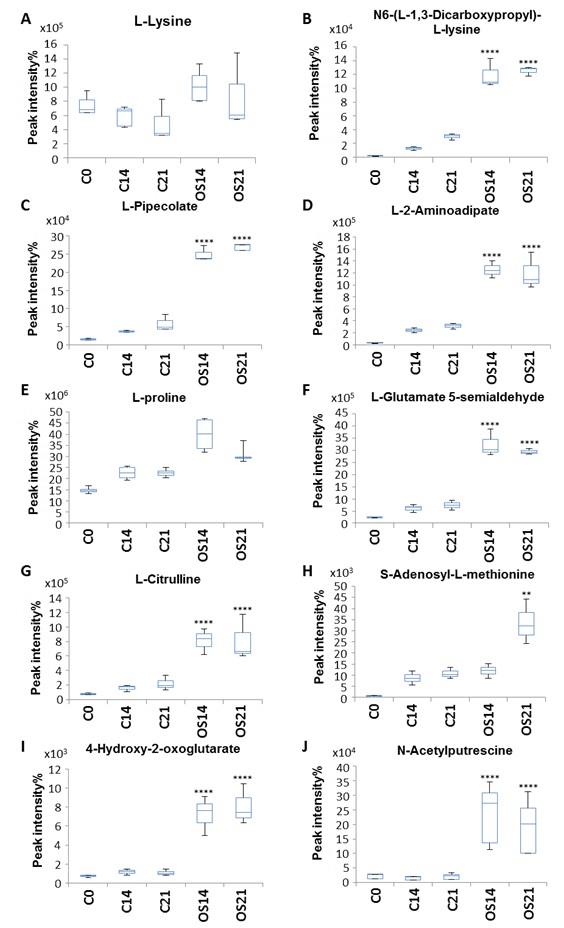
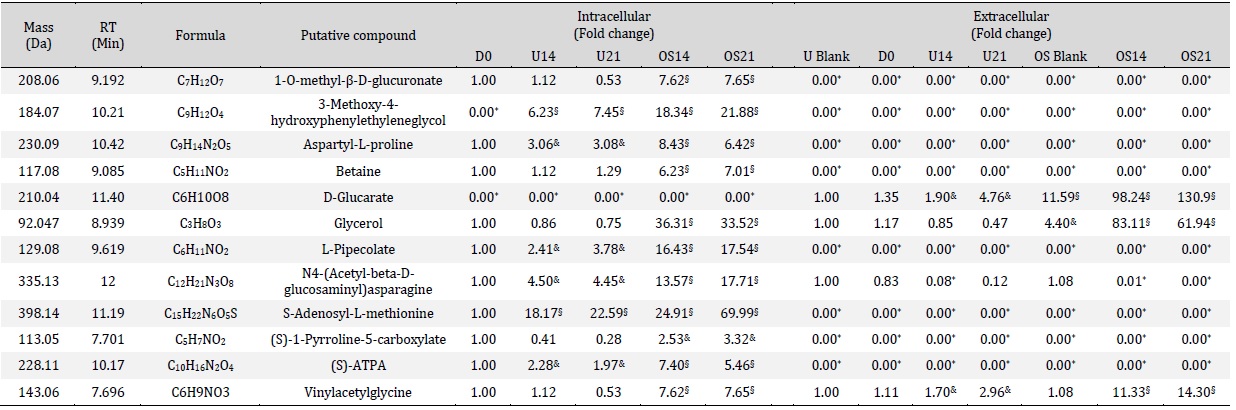
Metabolomic differences between intracellular metabolites produced under standard and OS treatment were identified by combining OPLS-DA and univariate one-way ANOVA [28] and revealed 308 intracellular compounds initially detected, with 31 intracellular metabolites showing an increase specifically during OS differentiation (Table 1). In particular, a subset of metabolites involved in amino acid metabolism was identified and showed significant increase during OS differentiation compared to the control medium condition (Fig. 3).
L-Lysine and L-proline levels, which were already detectable at day 0, showed a significant increase under OS treatment compared with control conditions (Fig. 3A, E). Other metabolites such as N6-(L-1,3-dicarboxyprolyl)-L-lysine, L-pipecolate, L-2-aminoadipate, L-glutamate 5-semialdehyde and N-acetylputrexcine (Fig. 3B, C, D, F and J) showed low concentration levels at day 0, which increased over time, maintaining a striking difference between elevated levels in OS medium compared to the control medium (Fig. 3B-D). Other compounds such as L-citrulline, 4-hydoxy-2-oxoglutarate, L-tyrosine, L-histidine, L-methionine, L-methionine S-oxide, N(pi)-methyl-L-histidine, S-adenocyl L-methionine and L-adrenaline also showed a significant increase under OS conditions which was maintained throughout the treatment duration (Fig. 3G, I, L, M, N, O and Q).
Extracellular metabolite profiling of MSC under OS condition
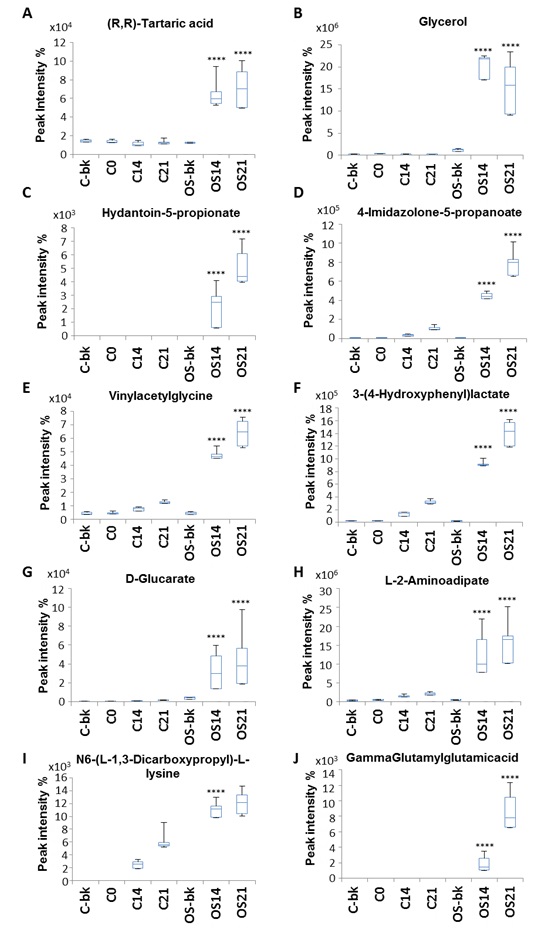
Further investigation was carried out by combining OPLS-DA and univariate one way ANOVA [28] to identify metabolomic differences between extracellular metabolites under standard and OS treatment. Out of 312 compounds initially detected, 10 extracellular metabolites showed significant increase under OS treatment (Table 1).
Metabolites such as (R, R)-tartaric acid and vinylacetylglycine were present in medium only blank of both untreated and OS treated conditions with no significant differences within D0, 14 and 21 of untreated control, while a significant increase was detected in the conditioned medium during OS treatment (Fig. 4A, E). Glycerol on the other hand, was present only during OS treatment but was absent in medium only blanks, D0, 14 and 21 on untreated control. However, a reduction toward D21 of OS was also observed (Fig. 4B). Other metabolites that presented only during OS treatment and sharply increased toward D21 were hydantoin-5-propionate, D-glucarate and gamma-glutamylglutamic acid (Fig. 4G, J). 4-imidazone-5-propanoate,3-(4-hydroxyphenyl) lactate and L-2-aminoadipate and N6-(L-1,3-dicarboxypropyl)-L-lysine were absent in the medium only blanks and at D0, but gradual increase with untreated control was shown at D14 and continued toward D21. Interestingly, with OS condition a significant increase was detected throughout the treatment time point (Fig. 4D, F, H and I).
Role of proline and arginine
Another notable change in intracellular metabolite levels during OS treatment links to arginine and proline metabolism, as L-glutamate-5-semialdehyde, L-citrulline, S-adenosyl-L-methionine, 4-hydroxy-2-oxglutarate and N-acetylputrescine all increased upon differentiation (KEGG PATHWAY: MAP00330). Proline is a non-essential amino acid synthesized from glutamic acid and is a crucial component of collagen [49, 50], while arginine plays an important role during bone healing through the production of nitric oxide (NO) and conversion into L-citrulline [51]. In addition, L-citrulline is formed alongside orthophosphate by catalysing carbamoyl phosphate and ornithine (KEGG REACTION: R01398). L-Glutamate-5-semialdehyde is the metabolic precursor for proline biosynthesis that can be converted to or be formed from L-proline (KEGG ENZYNE: EC 1.5.99.8 and EC 1.5.1.2), alongside orthophosphate (KEGG REACTION: R 03313). Interestingly, we previously reported that mouse MSCs OS differentiation was accompanied by an increase in orthophosphate extracellular level [28], which might support the biological interaction of these compounds during bone formation.
S-Adenosyl-L-methionine is a methyl donor with anti-inflammatory effects [52, 53] and N-acetylputrescine is a downstream arginine metabolite upregulated in neural stem
cells [54]. While their association with bone formation has not been reported before, here intracellular levels of these two compounds were measured to increase upon OS treatment, calling for future evaluations in vitro and in vivo. In contrast, medium measurements showed that L-glutamate-5-semialdehyde, L-citrulline, 4-hydroxy-2-oxglutarate and N-acetylputrescine showed no significant differences in their extracellular level compared to untreated control (data not shown). This may suggest that some metabolites produced during proline and arginine metabolism play an intracellular role during osteogenic differentiation. It is also interesting to note that N-acetylputrescine and S-adenosyl-L-methionine were not identified extracellularly, which could be due to technical limitations or might indicate their degradation inside the cells.
Role of amino acids
LC-MS also identified metabolic changes related to wider amino acid metabolism were significantly elevated intracellularly and extracellularly during OS treatment compared to the untreated condition.
Hydantoin-5-propionate, a metabolite of histidine (KEGG PATHWAY: map00340), significantly increased in the extracellular space during osteogenic treatment. Since histidine was one of the amino acids seen to significantly increase intracellularly during the differentiation treatment, it would be consistent with the production of hydantoin-5-propionate and indicate it as a compound of interest for osteogenic monitoring.
4-Imidazolone-5-propanoate is another histidine metabolite (KEGG PATHWAY: map00340) that increased extracellularly during OS differentiation. It is produced from urocanic acid by the enzyme urocanate hydratase [EC: 4.2.1.49], and is also converted to N-forminimo-L-glutamate by the enzyme imidazolonepropionase [EC: 3.5.2.7]. N-forminimo-L-glutamate is then converted to glutamate, which links to proline metabolism through L-1-Pyrroline-5-carboxylate (KEGG PATHWAY: map00330). An increase in intracellular L-glutamate-5-semialdehyde was revealed during our intracellular metabolite analysis, which could possibly reflect the role of histidine during proline metabolism, starting with extracellular conversion of histidine into 4-imidazolone-5-propanoate and then conversion of glutamate into L-glutamate-5-semialdehyde intracellularly to start proline metabolism.
Role of osteogenic medium components
Ascorbic acid is an essential compound for collagen synthesis [50], as it couples with 2-oxoglutarate to form a cofactor for proly 3-hydroxylase and proly 4-hydroxylase enzymes to hydrolyse proline (KEGG: EC 1.14.1.2) and produce hydroxyproline (KEGG: R03219) during collagen synthesis. Interestingly, our data showed a significant increase in (R, R)-tartaric acid in spent medium during osteogenic treatment compared to medium from untreated controls. (R, R)-tartaric acid is an organic acid involved in glyoxylate and dicarboxylate metabolism (KEGG PATHWAY: map00630), which links to ascorbate and aldarate metabolism (KEGG PATHWAY: map00053). Recent studies reported the effect of L-tartaric acid on the improvement bone cement mechanical toughness [55], pointing to a possible usefulness for bone applications.
Glycerol, which is produced by the degradation of βGP, component of the OS medium, by the glycerol 3-phosphatase enzyme to glycerol and orthophosphate during glycerolipid metabolism (KEGG REACTION: R00841) (KEGG ENZYME: EC 3.1.3.19), was seen to significantly increase in the extracellular medium during OS treatment. In agreement with previous observations in mouse cell cultures [28], higher glycerol levels were consistently detected in the osteogenic differentiation time-course of human MSCs. This is an interesting observation in light of a recent preclinical study, which reported the potential of glycerol in maintaining biochemical strength of bone graft in rat [56].
Our analysis was also detected compounds that have never been linked to the osteogenic process, such as vinylacetylglycine and hydroxy-phenyllactate. Vinylacetylglycine is part of acyl glycines which are minor fatty acids (HMDB00894) and hydroxy-phenyllactate is a metabolite involved in phenylalanine and tyrosine metabolism. Our LC-MS analysis revealed elevation in both metabolites at late stages of OS treatment compared with untreated control. Though there is no reported data linking this metabolite to bone formation, hydroxy-phenyllactate was recently detected by LC-MS technology as a compound in human breast milk [57]. Thus further investigation is needed to probe their role during osteogenesis.
Metabolomics approaches uncover new facets of differentiation
To the best of our knowledge, this study provides the first comprehensive LC-MS analysis showing significant changes in intra- and extracellular metabolites occurring during OS treatment of MSCs. Recently, a GC-MS volatolomic analysis was conducted to evaluate the effects of dexamethasone and BMP-2 on human umbilical cord blood MSCs during osteogenesis [58]. In that particular study, serine, threonine, and methionine concentrations were observed to significantly increase at an early time point (day 7), while TCA cycle metabolites were significantly reduced with both dexamethasone and BMP-2 treatments. This echoes our LC-MS results for intra- and extracellular metabolite profiles, which identified a set of amino acids that significantly increased during OS induction, while metabolites from the TCA cycle were reduced.
Furthermore, this dual metabolite analysis highlights an interesting link to pathways that could contribute to MSC differentiation such as lysine degradation and proline metabolism, and other amino acids that may play a crucial role in skeletal development (see summary in Fig. 5). The culture model used here represents a relevant system to study human osteogenesis in vitro [59-61], and thus enabled the identification of new candidate metabolites of relevance to primary mesenchymal progenitors responsible for the bone repair process in vivo. In order to exploit these results, it will be necessary to further quantify the concentration of these specific metabolites over time and test their potential effect on the formation of skeletal tissue in vitro and in vivo.
Since some of the identified metabolites represent new potential markers alongside existing bone markers for the clinical monitoring of bone metabolism [62, 63], it could be useful to integrate stable isotope assisted metabolomics to a broader metabolic profiling approach [64], as performed for instance for glycerol by tracing triglycerides (TG) in vitro to study human liver lipid metabolism [65].
The interaction between intracellular and extracellular metabolites during collagen synthesis could similarly be performed by tracing compounds such as L-2-aminoadipade (intra/extracellular) and N6(L-1,3-dicarboxypropyl)-L-lysine (intra/extracellular) on lysine metabolism. As this study relied on the evaluation of mineral deposition and ALP levels to monitor osteogenic differentiation in culture, it could be useful in the future to also explore the expression of extracellular matrix proteins such as collagen I and osteocalcin [62] to provide a finer correlation with the changes in cell phenotype during time-course of the differentiation. It would equally be of interest to compare these results to the metabolomic fingerprint achieved when exposing cells to additional pro-osteogenic inducers, and correlate these with the differentiation response achieved in vitro. Recent LC-MS-based analyses applied to in vitro models have uncovered new metabolite signatures of clinical relevance for specific developmental [66] or disease processes [67], underlining the benefits of such unbiased metabolomics approaches.
Beyond the measurement of calcium levels [8] routinely used in the field, such a metabolomics approach could thus add new candidates to support the monitoring of bone differentiation in preclinical models, and provide potential markers of bone metabolism for clinical applications.
Author Contributions
AS, DHK, VS designed the study; AS collated the data; AS, ES, FJ, DHK, VS contributed to data analyses; AS, VS produced the initial draft of the manuscript. The authors have read and approved the submitted manuscript.
Funding Sources
Part of the methods utilised were developed through work that was supported by the BBSRC Doctoral Training Partnership [grant number BB/F017014/1]. AS was funded by the Saudi Ministry of Higher Education. VS is supported by a grant from the Italian Ministry of Education, University and Research (MIUR) to the Department of Molecular Medicine of the University of Pavia under the initiative ‘Dipartimenti di Eccellenza (2018–2022)’.
Statement of Ethics
The authors have no ethical conflicts to disclose.
The authors have no conflicts of interest to declare.
| 1 Zhu K, Prince RL: Calcium and bone. Clin Biochem 2012;45:936-942. https://doi.org/10.1016/j.clinbiochem.2012.05.006 |
||||
| 2 Blake GM, Fogelman I: Role of dual-energy X-ray absorptiometry in the diagnosis and treatment of osteoporosis. J Clin Densitom 2007;10:102-110. https://doi.org/10.1016/j.jocd.2006.11.001 |
||||
| 3 Weinstein RS. True strength: J Bone Miner Res 2000;15:621-625. https://doi.org/10.1359/jbmr.2000.15.4.621 |
||||
| 4 Chesnut CH 3rd, Rosen CJ: Bone Quality Discussion, Reconsidering the effects of antiresorptive therapies in reducing osteoporotic fracture. J Bone Miner Res 2001;16:2163-2172. https://doi.org/10.1359/jbmr.2001.16.12.2163 |
||||
| 5 Delmas PD, Yang lang, Garnero Patrick, Seible MJ, Stepan Jan J: The use of biochemical markers of bone turnover in osteoporosis. Committee of Scientific Advisors of the International Osteoporosis Foundation. Osteoporos Int 2000;11:S2-17. https://doi.org/10.1007/s001980070002 |
||||
| 6 Malluche HH, Mawad H, Monier-Faugere MC: Bone biopsy in patients with osteoporosis. Curr Osteoporos Rep 2007;5:146-152. https://doi.org/10.1007/s11914-007-0009-x |
||||
| 7 Cummings SR, Palermo L, Browner W, Marcus R, Wallace R, Pearson J, Blackwell T, Eckert S, Black D: Monitoring osteoporosis therapy with bone densitometry: misleading changes and regression to the mean. Fracture Intervention Trial Research Group. JAMA 2000;283:1318-1321. https://doi.org/10.1001/jama.283.10.1318 |
||||
| 8 Beto JA: The role of calcium in human aging. Clin Nutr Res 2015;4:1-8. https://doi.org/10.7762/cnr.2015.4.1.1 |
||||
| 9 Reid IR, Bristow SM, Bolland M.J: Calcium supplements: benefits and risks. J Intern Med 2015;278:3543-68. https://doi.org/10.1111/joim.12394 |
||||
| 10 Kanis JA, Burlet N, Cooper C, Delmas PD, Reginster JY, Borgstrom F, Rizzoli, R: European guidance for the diagnosis and management of osteoporosis in postmenopausal women. Osteoporos Int 2008;19:399-428. https://doi.org/10.1007/s00198-008-0560-z |
||||
| 11 Nishizawa Y, Nakamura T, Ohta H, Kushida K, Gorai I, Shiraki M, Fukanaga M, Hosoi T, Miki T, Chaki O, Ichimura S, Nakatsuka K, Miura M, Committee on the Guidelines for the Use of Biochemical Markers of Bone Turnover in Osteoporosis Japan Osteoporosis Society: Guidelines for the use of biochemical markers of bone turnover in osteoporosis (2004). J Bone Miner Metab 2005;23:97-104. https://doi.org/10.1007/s00774-004-0547-6 |
||||
| 12 Lv H, Jiang F, Guan D, Lu C, Guo B, Chan C, Peng S, Liu B, Guo W, Zhu H, Xu Z, Lu A, Zhang G: Metabolomics and Its Application in the Development of Discovering Biomarkers for Osteoporosis Research. Int J Mol Sci 2016;17:2018. https://doi.org/10.3390/ijms17122018 |
||||
| 13 Oliver SG, Winson MK, Kell DB, Baganz F: Systematic functional analysis of the yeast genome. Trends Biotechnol 1998;16:373-378. https://doi.org/10.1016/S0167-7799(98)01214-1 |
||||
| 14 Abdelrazig S, Safo L, Rance G A, Fay M W, Theodosiou E, Topham P, Kim DH, Fernández-Castané A: Metabolic characterisation of Magnetospirillum gryphiswaldense MSR-1 using LC-MS-based metabolite profiling. RSC Advances 2020;10:32548-32556. https://doi.org/10.1039/D0RA05326K |
||||
| 15 Kim DH, Achcar F, Breitling R, Burgess KE, Barrett MP: LC-MS-based absolute metabolite quantification: application to metabolic flux measurement in trypanosomes. Metabolomics 2015;11:1721-1732. https://doi.org/10.1007/s11306-015-0827-2 |
||||
| 16 Buckwalter JA, Glimcher MJ, Cooper RR, Recker Rl: Bone biology. I: Structure, blood supply, cells, matrix, and mineralization. Instr Course Lect 1996;45:371-386. | ||||
| 17 Buckwalter JA, Glimcher MJ, Cooper RR, Recker Rl: Bone biology. II: Formation, form, modeling, remodeling, and regulation of cell function. Instr Course Lect 1996;45:387-399. | ||||
| 18 Dominici M, Le Blanc K, Mueller I, Slaper-Cortenbach I, Marini Fc, Krause Ds, Deans Rj, Keating A, Prockop Dj, Horwitz Em: Minimal criteria for defining multipotent mesenchymal stromal cells. The International Society for Cellular Therapy position statement. Cytotherapy 2006;8:315-317. https://doi.org/10.1080/14653240600855905 |
||||
| 19 Im GI: Stem cells for reutilization in bone regeneration. J Cell Biochem 2015;116:487-493. https://doi.org/10.1002/jcb.25027 |
||||
| 20 Hamidouche Z, Haÿ E, Vaudin P, Charbord P, Schüle R, Marie PJ, Fromigué O: FHL2 mediates dexamethasone-induced mesenchymal cell differentiation into osteoblasts by activating Wnt/beta-catenin signaling-dependent Runx2 expression. FASEB J 2008;22:3813-3822. https://doi.org/10.1096/fj.08-106302 |
||||
| 21 Franceschi RT, Iyer BS: Relationship between collagen synthesis and expression of the osteoblast phenotype in MC3T3-E1 cells. J Bone Miner Res 1992;7:235-246. https://doi.org/10.1002/jbmr.5650070216 |
||||
| 22 Jaiswal N, Haynesworth SE, Caplan AI, Bruder SP: Osteogenic differentiation of purified, culture-expanded human mesenchymal stem cells in vitro. J Cell Biochem 1997;64:295-312. https://doi.org/10.1002/(SICI)1097-4644(199702)64:2<295::AID-JCB12>3.0.CO;2-I |
||||
| 23 Foster BL, Nociti Jr FH, Swanson EC, Matsa-Dunn D, Berry JE, Cupp CJ, Zhang P, Somerman MJ: Regulation of cementoblast gene expression by inorganic phosphate in vitro. Calcif Tissue Int 2006;78:103-112. https://doi.org/10.1007/s00223-005-0184-7 |
||||
| 24 Fatherazi S, Matsa-Dunn D, Foster BL, Rutherford RB, Somerman MJ, Presland RB: Phosphate regulates osteopontin gene transcription. J Dent Res 2009;88:39-44. https://doi.org/10.1177/0022034508328072 |
||||
| 25 Tada H, Nemoto E, Foster BL, Somerman MJ, Shimauchi H: Phosphate increases bone morphogenetic protein-2 expression through cAMP-dependent protein kinase and ERK1/2 pathways in human dental pulp cells. Bone 2011;48:1409-1416. https://doi.org/10.1016/j.bone.2011.03.675 |
||||
| 26 Rashidi H, Strohbuecker S, Jackson L, Kalra S, Blake AJ, France L, Tufarelli C, Sottile V: Differences in the pattern and regulation of mineral deposition in human cell lines of osteogenic and non-osteogenic origin. Cells Tissues Organs 2012;195:484-494. https://doi.org/10.1159/000329861 |
||||
| 27 Pereira H, Martin JF, Joly C, Sebedio JL: Development and validation of a UPLC/MS method for a nutritional metabolomic study of human plasma. Metabolomics 2010;6:207-218. https://doi.org/10.1007/s11306-009-0188-9 |
||||
| 28 Surrati A, Linforth R, Fisk ID, Sottile V, Kim DH: Non-destructive characterisation of mesenchymal stem cell differentiation using LC-MS-based metabolite footprinting. Analyst 2016;141:3776-3787. https://doi.org/10.1039/C6AN00170J |
||||
| 29 Creek DJ, Jankevics A, Breitling R, Watson DJ, Barrett MP, Burgess KEV: Toward global metabolomics analysis with hydrophilic interaction liquid chromatography-mass spectrometry: improved metabolite identification by retention time prediction. Anal Chem 2011;83:8703-8710. https://doi.org/10.1021/ac2021823 |
||||
| 30 Tautenhahn R, Bottcher C, Neumann S: Highly sensitive feature detection for high resolution LC/MS. BMC Bioinformatics 2008;9:504. https://doi.org/10.1186/1471-2105-9-504 |
||||
| 31 Scheltema RA, Jankevics A, Jansen RC, Swertz M, Breiting R: PeakML/mzMatch: a file format, Java library, R library, and tool-chain for mass spectrometry data analysis. Anal Chem 2011;83:2786-2793. https://doi.org/10.1021/ac2000994 |
||||
| 32 Creek DJ, Jankevics A, Burgess KEV, Breitling R, Barrett MP: IDEOM: An Excel interface for analysis of LC-MS- based metabolomics data. Bioinformatics 2012;28:1048-1049. https://doi.org/10.1093/bioinformatics/bts069 |
||||
| 33 Summer LW, Lei Z, Nikolau BJ, Saito K, Roessner U, Trengove R: Proposed quantitative and alphanumeric metabolite identification metrics. Metabolomics 2014;10:350-353. https://doi.org/10.1007/s11306-014-0739-6 |
||||
| 34 Sumner LW, Amberg A, Barrett D, Beale MH, Beger R, Daykin CA, Fan TWM, Fiehn O, Goodacre R, Griffin JL, Hankemeier T, Hardy N, Harnly J, Higashi R, Kopka J, Lane AN, Lindon JC, Marriott P, et al.: Proposed minimum reporting standards for chemical analysis Chemical Analysis Working Group (CAWG) Metabolomics Standards Initiative (MSI). Metabolomics 2007;3:211-221. https://doi.org/10.1007/s11306-007-0082-2 |
||||
| 35 Eriksson L, Johansson E, Kettaneh-Wold K, Trygg CWJ, Wickstrom C, Wold S: Multi- and Megavariate Data Analysis: Part I: Basic Principles and Applications, 2nd ed. Umea, Umetrics, 2006. | ||||
| 36 Chong J, Wishart DS, Xia J: Using MetaboAnalyst 4.0 for Comprehensive and Integrative Metabolomics Data Analysis. Curr Protoc Bioinf 2019;68:e86. https://doi.org/10.1002/cpbi.86 |
||||
| 37 Cottret L, Wildridge D, Vinson F, Barrett MP, Charles H, Sagot MF, Jourdan F: MetExplore: A web server to link metabolomic experiments and genome-scale meta-bolic networks. Nucleic Acids Research 2010;38:W132-W137. https://doi.org/10.1093/nar/gkq312 |
||||
| 38 Siffert RS: The role of alkaline phosphatase in osteogenesis. J Exp Med 1951;93:415-426. https://doi.org/10.1084/jem.93.5.415 |
||||
| 39 Stein GS, Lian JB, TA: Owen, Relationship of cell growth to the regulation of tissue-specific gene expression during osteoblast differentiation. FASEB J 1990;4:3111-3123. https://doi.org/10.1096/fasebj.4.13.2210157 |
||||
| 40 France LA, Scotchford CA, Grant DM, Rashidi H, Popov AA, Sottile V: Transient serum exposure regimes to support dual differentiation of human mesenchymal stem cells. J Tissue Eng Regen Med 2014;8:652-663. https://doi.org/10.1002/term.1567 |
||||
| 41 Tome D, Bos C: Lysine requirement through the human life cycle. J Nutr 2007;137:1642S-1645S. https://doi.org/10.1093/jn/137.6.1642S |
||||
| 42 Dancis J, Hutzler J, Woody NC, Cox RP: Multiple enzyme defects in familial hyperlysinemia. Pediatr Res 1976;10:686-691. https://doi.org/10.1203/00006450-197607000-00011 |
||||
| 43 L IJ, Kromme ID, Oosthein W, Wanders RJ: Molecular cloning and expression of human L-pipecolate oxidase. Biochem Biophys Res Commun 2000;270:1101-1105. https://doi.org/10.1006/bbrc.2000.2575 |
||||
| 44 Hallen A, Jamie JF, Cooper AJ: Lysine metabolism in mammalian brain: an update on the importance of recent discoveries. Amino Acids 2013;45:1249-1272. https://doi.org/10.1007/s00726-013-1590-1 |
||||
| 45 Vianey-Liaud C, Rolland MO, Divry P, Zabot MT, Cotte J: A New Case of Hyperlysinaemia with Saccharopinuria; in Addison GM, Harkness RA, Isherwood DM, Pollitt RJ (eds): Practical Developments in Inherited Metabolic Disease: DNA Analysis, Phenylketonuria and Screening for Congenital Adrenal Hyperplasia. Dordrecht, Springer Netherlands, 1986, pp 265-267. https://doi.org/10.1007/978-94-009-4131-1_43 |
||||
| 46 Sell DR, Strauch CM, Shen W, Monnier VM: Aging, diabetes, and renal failure catalyze the oxidation of lysyl residues to 2-aminoadipic acid in human skin collagen: evidence for metal-catalyzed oxidation mediated by alpha-dicarbonyls. Ann N Y Acad Sci 2008;1126:205-209. https://doi.org/10.1196/annals.1433.065 |
||||
| 47 Liao SF, Wang T, Regmi N: Lysine nutrition in swine and the related monogastric animals: muscle protein biosynthesis and beyond. Springerplus 2015;4:147. https://doi.org/10.1186/s40064-015-0927-5 |
||||
| 48 Yamauchi M, Sricholpech M: Lysine post-translational modifications of collagen. Essays Biochem 2012;52:113-133. https://doi.org/10.1042/bse0520113 |
||||
| 49 Barbul A: Proline precursors to sustain Mammalian collagen synthesis. J Nutr 2008;138:2021S-2024S. https://doi.org/10.1093/jn/138.10.2021S |
||||
| 50 Murad S, Sivarajah A, Pinnell SR: Regulation of prolyl and lysyl hydroxylase activities in cultured human skin fibroblasts by ascorbic acid. Biochem Biophys Res Commun 1981;101:868-875. https://doi.org/10.1016/0006-291X(81)91830-1 |
||||
| 51 Wijnands KA, Brink PR, Weijers PH, Dejong CH, Poeze M: Impaired fracture healing associated with amino acid disturbances. Am J Clin Nutr 2012;95:1270-1277. https://doi.org/10.3945/ajcn.110.009209 |
||||
| 52 Cederbaum AI: Hepatoprotective effects of S-adenosyl-L-methionine against alcohol- and cytochrome P450 2E1-induced liver injury. World J Gastroenterol 2010;16:1366-1376. https://doi.org/10.3748/wjg.v16.i11.1366 |
||||
| 53 Kim J, Lee EY, Koh EM, Cha HS, Yoo B, Lee CK, Lee YJ, Ryu H, Lee KH, Song YW: Comparative clinical trial of S-adenosylmethionine versus nabumetone for the treatment of knee osteoarthritis: an 8-week, multicenter, randomized, double-blind, double-dummy, Phase IV study in Korean patients. Clin Ther 2009;31:2860-2872. https://doi.org/10.1016/j.clinthera.2009.12.016 |
||||
| 54 Drago D, Basso V, Gaude E, Volpe G, Peruzzotti-Jametti L, Bachi A, Musco G, Andolfo A, Frezza C, Mondino A, Pluchino S: Metabolic determinants of the immune modulatory function of neural stem cells. J Neuroinflammation 2016;13:232. https://doi.org/10.1186/s12974-016-0667-7 |
||||
| 55 Sarrigiannidis SO, Moussa H, Dobre O, Dalby MJ, Tamimi F, Salmeron-Sanchez M: Chiral Tartaric Acid Improves Fracture Toughness of Bioactive Brushite-Collagen Bone Cements. ACS Appl Bio Mater 2020;3:5056-5066. https://doi.org/10.1021/acsabm.0c00555 |
||||
| 56 Samsell B, Softic D, Qin X, McLean J, Sohoni P, Gonzales K, Moore M: Preservation of allograft bone using a glycerol solution: a compilation of original preclinical research. Biomater Research 2019;23:5. https://doi.org/10.1186/s40824-019-0154-1 |
||||
| 57 Mung D, Li L: Applying quantitative metabolomics based on chemical isotope labeling LC-MS for detecting potential milk adulterant in human milk. Anal Chim Acta 2018;1001:78-85. https://doi.org/10.1016/j.aca.2017.11.019 |
||||
| 58 Klontzas ME, Vernardis SI, Heliotis M, Tsiridis E, Mantalaris A: Metabolomics Analysis of the Osteogenic Differentiation of Umbilical Cord Blood Mesenchymal Stem Cells Reveals Differential Sensitivity to Osteogenic Agents. Stem Cells Dev 2017;26:723-733. https://doi.org/10.1089/scd.2016.0315 |
||||
| 59 Okamoto T, Aoyama T, Nakayama T, Nakamata T, Hosaka T, Nishijo K, Nakamura T, Kiyono T, Toguchida J: Clonal heterogeneity in differentiation potential of immortalized human mesenchymal stem cells. Biochem Biophys Res Commun 2002;295:354-361. https://doi.org/10.1016/S0006-291X(02)00661-7 |
||||
| 60 Macri-Pellizzeri L, De Melo N, Ahmed I, Grant D, Scammell B, Sottile V: Live Quantitative Monitoring of Mineral Deposition in Stem Cells Using Tetracycline Hydrochloride. Tissue Eng Part C Methods 2018;24:171-178. https://doi.org/10.1089/ten.tec.2017.0400 |
||||
| 61 Popov A, Scotchford C, Grant D, Sottile V: Impact of Serum Source on Human Mesenchymal Stem Cell Osteogenic Differentiation in Culture. Int J Mol Sci 2019;20:5051. https://doi.org/10.3390/ijms20205051 |
||||
| 62 Graneli C, Thorfve A, Ruetschi U, Brisby H, Thomsen P, Lindahl A, Karlsson C: Novel markers of osteogenic and adipogenic differentiation of human bone marrow stromal cells identified using a quantitative proteomics approach. Stem Cell Res 2014;12:153-165. https://doi.org/10.1016/j.scr.2013.09.009 |
||||
| 63 Wheater G, Elshahaly M, Tuck SP, Datta HK, Laar JM: The clinical utility of bone marker measurements in osteoporosis. J Transl Med 2013;11:201. https://doi.org/10.1186/1479-5876-11-201 |
||||
| 64 You L, Zhang B, Tang YJ: Application of stable isotope-assisted metabolomics for cell metabolism studies. Metabolites 2014;4:142-165. https://doi.org/10.3390/metabo4020142 |
||||
| 65 Qi J, Lang W, Geisler JG, Wang P, Petrounia L, Mai S, Smith C, Askari H, Struble GT, Williams R, Bhanot S, Monia BP, Bayoumy S, Grant E, Caldwell GW, Todd MW, Liang Y, Gaul MD, Demarest KT, Connelly MA: The use of stable isotope-labeled glycerol and oleic acid to differentiate the hepatic functions of DGAT1 and -2. J Lipid Res 2012;53:1106-1116. https://doi.org/10.1194/jlr.M020156 |
||||
| 66 Kumar A, Kumar Y, Kumar Sevak J, Kumar S, Kumar N Gopinath SD: Metabolomic analysis of primary human skeletal muscle cells during myogenic progression. Sci Rep 2020;10:1-14. https://doi.org/10.1038/s41598-020-68796-4 |
||||
| 67 Rocha B, Cillero-Pastor B, Eijkel G, Calamia V, Fernandez-Puente P, Paine MRL, Ruiz-Romero C, Heeren RMA, Blanco FJ: Integrative metabolic pathway analysis reveals novel therapeutic targets in osteoarthritis. Mol Cell Proteom 2020;19:547-588. https://doi.org/10.1074/mcp.RA119.001821 |
||||
| 68 Sottile V, Thomson A, McWhir J: In vitro osteogenic differentiation of human ES cells. Cloning Stem Cells 2003;5:149-155. https://doi.org/10.1089/153623003322234759 |
||||
| 69 Kawai S, Yoshitomi H, Sunaga J, Alev C, Nagata S, Nishio M, Hada M, Koyama Y, Uemura M, Sekiguchi K, Maekawa H, Ikeya M, Tamaki S, Jin Y, Harada Y, Fukiage K, Adachi T, Matsuda S, Toguchida J: In vitro bone-like nodules generated from patient-derived iPSCs recapitulate pathological bone phenotypes. Nat Biomed Eng 2019;3:558-570. https://doi.org/10.1038/s41551-019-0410-7 |
||||