Original Article – DOI: 10.33594/000000883
CPB (60): 458 - 472
Accepted: 06.07.2026 - Published: 23.08.2026
Effects of Mebendazole and Flutamide Combination in Prostate Cancer Cell Lines: a Comprehensive in Vitro Analysis
bUrology Research Center, Tehran University of Medical Sciences, Tehran, Iran,
cDepartment of Pathology, Isfahan Kidney Disease Research Center, Isfahan University of Medical Sciences, Isfahan, Iran,
dDepartment of Urology, Imam Khomeini Hospital Complex, Tehran University of Medical Sciences, Tehran, Iran,
eUroScience and Department of Surgery (Urology), School of Medical Sciences, University of Campinas, Unicamp, and Pontifical Catholic University of Campinas, PUC-Campinas, Campinas, Sao Paulo, Brazil
Keywords
Abstract
Background/Aims: The aim of this research was to use Mebendazole as an anticancer candidate to reduce the dose of Flutamide and reduce its side effects. Method: In this in vitro study, we evaluated the effect of Mebendazole, Flutamide and Mebendazole-Flutamide combination therapy in LNCaP, DU145 and PC3 cell lines as representatives of human prostate cancer. The assessment includes scratch-wound assay, colony formation assay, flow cytometric analysis of apoptosis and DNA cell cycle, real-time PCR (BAX/BCL2, E-cadherin, N-cadherin, Snail, HIF1α, VEGFC, KLK3, TUBB1 and TUBB3 genes). Results: To determine IC50 levels, cell lines were exposed to different concentration of the drugs. Our data indicated that IC50 values for Mebendazole (55μM) and for 3 cell lines and flutamide (12μM and 10μM) for PC3 and LNCaP/DU145 respectively, with MTT were approved by flow cytometry in a dose and time-dependent manner which was as a consequence of cell cycle arrest at G1/S phase. Furthermore, for the first time, we offered that combination of mebendazole and flutamide produced a greater inhibitory effect on cell viability, colony formation, and migration than either agent alone at the tested concentrations. The combination treatment also increased apoptotic cell populations and upregulated the BAX/BCL2 mRNA ratio and E-cadherin expression in all three cell lines (P<0.01) and downregulated the expression of TUBB1 in DU145 and TUBB3 genes in DU145 and PC3 cell lines (P<0.01). Conclusion: Mebendazole in combination with flutamide reduced dose of flutamide and increased the sensitivity of prostate cancer cells to treatment. Therefore, this combination may represent a promising in vitro strategy that warrants further mechanistic and in vivo investigation.
Introduction
Recent estimates from GLOBCAN indicate that in 2020, there were around 20 million new cancer cases and nearly 10 million deaths attributed to cancer. This data underscores the significance of cancer as a critical societal and economic issue in the 21st century. Prostate cancer remains particularly prominent, with 1.5 million new diagnoses and approximately 400, 000 fatalities worldwide(1-3). The treatment of prostate cancer (PCa) involves a range of options such as chemotherapy, radiation therapy, hormone therapy, surgical interventions, and cryotherapy. For cases of recurrent biochemical metastatic prostate cancer, androgen-deprivation therapy (ADT), often referred to as hormonal therapy, serves as the main approach to management (4). ADT is associated with a range of side effects such as anemia, depression, hot flashes, and erectile dysfunction, which raises considerable concerns for both healthcare providers and patients. Therefore, it is essential to create new medications that are not only commercially feasible but also exhibit minimal side effects to improve the efficacy of androgen deprivation therapy. Early diagnosis of urological cancers in cancer patients is vital and essential for timely treatment(5). This scenario underscores the critical necessity for the development of novel therapeutic agents. Research efforts should focus on discovering new drugs that not only minimize side effects but also effectively address drug resistance (6-9). Flutamide (Eulexin), a nonsteroidal antiandrogen agent, is commonly used in clinical settings as an alternative treatment for advanced PCa patients(10). In conventional practice, although flutamide has the potential to be used as monotherapy as well as in combination with luteinizing hormone-releasing hormone analogs, adverse outcomes have been reported for monotherapy as well(11, 12). In the context of prostate cancer, primary or secondary therapy resistance is a significant clinical concern, impacting approximately 30% of patients (13, 14). On the other hand, the PSA response rate of flutamide is 35% (15, 16). Therefore, in new studies, efforts are being made to use safer drugs to increase the effectiveness of these drugs, reduce side effects, and eliminate resistance. Mebendazole is an antiparasitic medication was first tested against cancer in 2002 (17). Today, research has concluded that mebendazole possesses many desirable features for a new drug: a well-established and well-established toxicity profile, pharmacokinetics that allow therapeutic concentrations to be reached at the site of the disease, ease of administration and low price(18). Meanwhile, mebendazole has been shown to suppress tumor growth in vitro and in vivo (18), thus repositioning it as a novel anticancer agent. By preventing tubulin polymerization in cancer cells such as glioblastoma and melanoma, mebendazole disrupts microtubule function and leads to cell death(18, 19). Furthermore, in other studies, mebendazole has been shown to be synergistic with a wide range of other anticancer drugs such as metronomic chemotherapy, including other existing drugs such as hydroxychloroquine and metformin and docetaxel, etic (18). Given that flutamide alone does not produce an adequate response in some advanced prostate cancers, or genetic resistance has been seen in some cases, finding a complementary drug to use in combination with flutamide could treat a wider range of patients with advanced prostate cancer. This strategy may help reduce the side effects of Flutamide, improve its efficacy across various stages of cancer progression, and tackle the resistance mechanisms that cancer cells develop in response to monotherapy. The present study seeks to explore the combined effects of mebendazole and Flutamide on prostate cancer cell lines. Because evasion of apoptosis is a key feature of cancer progression and therapeutic resistance, evaluation of apoptotic cell death is important when assessing potential anticancer treatments (20). Therefore, in addition to cell viability, colony formation, and migration, the present study assessed apoptosis and the expression of apoptosis-related genes to better characterize the cellular response to mebendazole, flutamide, and their combination.
Materials and Methods
Cell culture
Cell lines of PC-3, LNCaP DU145and (NCBI Code: C428, C439 and C428 respectively) were obtained from the Pasteur institute of Iran. Cell lines were maintained in DMEM medium (Gibco) supplemented with 10% fetal bovine serum, 1000 units/mL Penicillin and 100 microgram/mL streptomycin (Gibco) in a 5% CO2 humidified incubator at 37C.
MTT Assay
IC50 and inhibitory effect of Mebendazole on the metabolic activity of prostate cancer cell lines were evaluated using 3-[4, 5-dimethylthiazol-2-yl]-2, 5-diphenyl tetrazolium bromide MTT assay, after seeding at 5000 cells per well in 96-well plates, cell lines were exposed to various concentration of Mebendazole for 24h, 48h and 72h. Then cells were incubated with 100 μL of MTT solution (0.5 mg/ mL, Sigma-Aldrich) for 2-4h at 37°C. After the dissolving of formazan crystals in 100 μL of dimethyl sulfoxide (DMSO), the optical density was measured at the wavelength of 545 nm by an enzyme-linked immunosorbent assay (21) microplate reader. Dose– response curves were plotted and IC50 was graphed using Graph-Pad PRISM software (version 9). The formula for calculating cell viability as a percentage is expressed as follows: the average absorbance of the triplicate treatment wells is divided by the average absorbance of the control wells, and the result is then multiplied by 100. The combination treatment was evaluated at selected concentrations based on the single-agent dose-response results. No formal drug-interaction model, such as combination-index, Bliss, Loewe, or ZIP analysis, was applied in the present study.
Cell colony formation assay
Cell lines in the treatment group and control group were seeded at the rate of 1.5 × 10³ cells per well on six-well plates and incubated for 2 weeks. After 14 days, the bottom of the plate was coated by 2% agarose gel. Then, cells were mixed with the culture medium containing 0.7% agarose gel and poured on the gel- coated surface of the plate. The culture medium was changed every 4 days. After this time, cells were fixed with cold paraformaldehyde 4%, washed with PBS, and stained with 0.1% crystal violet. Calculation of the colony formation rate was done using ImageJ software (version 1.53).
Flow cytometric measurement of apoptosis
Cell viability, apoptosis and necrosis were determined using an Annexin-V and PI (propidium iodide) kit (BioLegend; CAT Number: 640914) according to the manufacturer's instructions. After overnight incubation of cell lines in DMEM/10% FBS at 37°C, cells were exposed to various concentrations of Flutamide, Mebendazole and combination for 48h. Incubation in darkness for 15 min at 37°C was done after the addition of PI and Annexin-V. The scatter plots were categorized into four distinct regions, each representing various cell populations. The area designated for viable cells, characterized by being annexin-V-negative and PI-negative, was identified as Q4 and situated in the lower left quadrant. The region for early apoptotic cells, which are annexin-V-positive and PI-negative, was marked as Q3 and found in the lower right quadrant. The upper right quadrant contained the area for late apoptotic cells, labeled as Q2, which are both annexin-V-positive and PI-positive. Finally, the upper left quadrant was assigned to necrotic cells, identified as Q1, which are annexin-V-negative and PI-positive. The quantification of apoptosis was achieved by assessing the percentage of annexin V+/PI- cells through a flow cytometer. The data obtained were subsequently analyzed using Flowjo software (Tree Star Inc., version 9.6.3, USA).
Migration potential analysis by Scratch- wound assay
A vertical scratch was applied via pipette tip to the confluent PC-3, DU145 and LNCaP cells (about 85% confluency) and the plates were washed with serum-free medium twice. After overnight serum starvation, control and experimental groups were exposed to PBS and Mebendazole, respectively. Finally, cell imaging was performed at 24 h intervals. The cell migration rate was estimated by measurement of area among the two scratch edges in comparison to the control group. Calculation of the wound healing size was done using ImageJ software (version 1.53).
DNA cell cycle analysis
Mebendazole-treated (48 h) and untreated cells were fixed using 70% cold ethanol for 24 h. After double wash with PBS, cells were incubated with RNase I and 500 μL PI for 30 min at 37°C. Cell detection was performed by flow cytometer. Flowjo software (Tree Star Inc., version 9.6.3, USA) was used to analyse the data. Cell arrest at sub-G0/G1 was considered apoptosis.
Gene expression analysis by real-time PCR
Total RNA extraction was performed using TRIpure Total RNA Extraction Reagent (As Trizol) ELK Biotechnology CO., Ltd. The Colibri Microvolume Spectrometer was used to measure the concentration of RNA. The cDNA was synthesized using the Easy TM cDNA Synthesis Kit (Pars Toos. Co., Iran). Real-time PCR was performed using QIAGEN's thermocycler with a total sample volume of 20 μL. The PCR reaction specificity confirmation was applied through melting curve analysis. B2M mRNA levels were considered as an internal control to estimate the relative expression levels by the 2−ΔΔCT method. Table 1 represents the nucleotide sequences of primers.
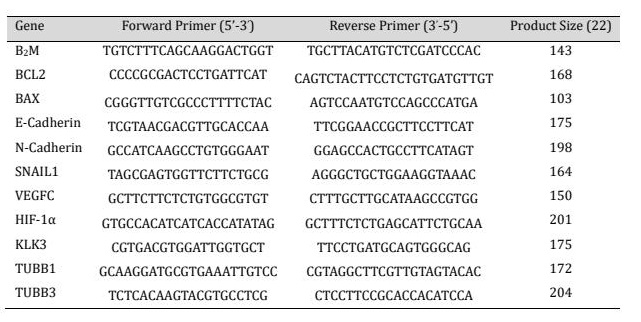
Table 1: Primer sequences of target and normalizer genes
Statistical analysis
All experiments were performed in triplicate and the data were presented as means ± SD. Statistical analysis was performed by ANOVA and Student's t-test. Statistical significance was considered as *p < 0.05, **p < 0.01, ***p < 0.001, and ****p < 0.0001.
Results
MTT assay
The cell viability assays were performed on three different prostate cancer cell lines, LNCaP, DU145, and PC3, to evaluate the efficacy of Mebendazole and Flutamide, both individually and in combination. The results demonstrated a dose and time dependent decrease in cell viability across all three cell lines when treated with increasing concentrations of either Mebendazole or Flutamide alone. At the tested concentrations, the combination of mebendazole and flutamide produced a greater reduction in MTT-based cell viability than either single-agent treatment in all three prostate cancer cell lines. The IC50 doses, indicated by stars (*) in the figure 1, represent the concentrations at which cell viability was reduced by 50% (Fig. 1). In all three cell lines, the IC50 dose for Mebendazole alone was approximately 55 μM, while for Flutamide alone, it was around 10 μM for LNCaP and DU145 cell lines and 12 μM for PC3 cell line. However, when combined with Mebendazole (50 μM), the IC50 dose for flutamide decreased to 8 μM for LNCaP /DU145 and 10 μM for PC3 cell lines at 48 hours.
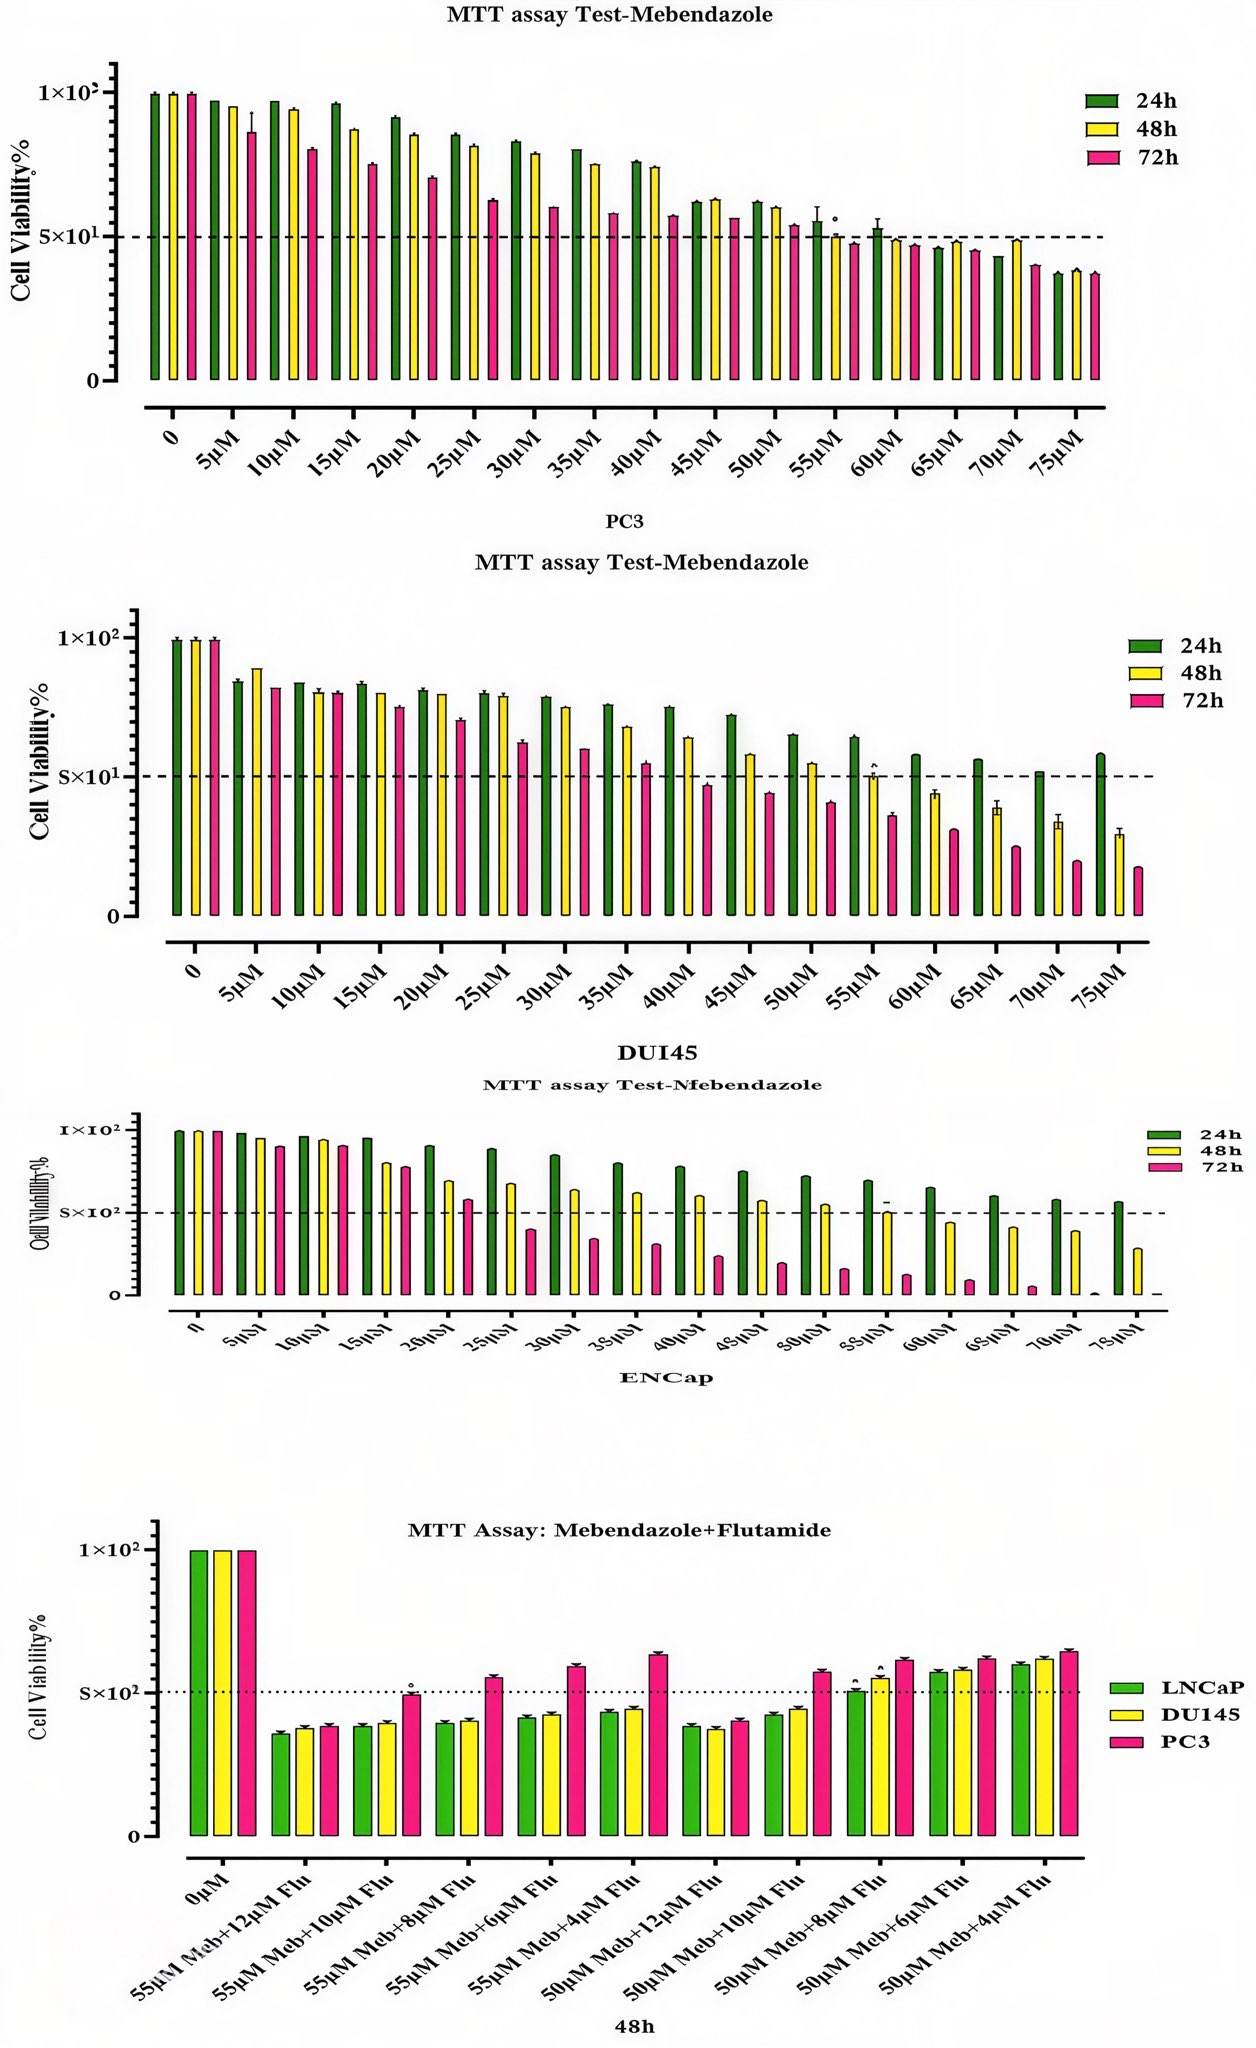
Fig. 1: Dose-response effects of Flutamide and Mebendazole, alone and in combination, on cell viability in prostate cancer cell line. Cell viability was assessed at 24, 48, and 72 hours after treatment using the indicated concentrations of Flutamide (F) and Mebendazole (M) in the LNCaP, DU145, and PC3 prostate cancer cell lines. Data are presented as mean % cell viability ± SEM from three independent experiments. Stars (*) indicate the IC50 doses where 50% reduction in cell viability was observed compared to untreated controls. The combination of Mebendazole (50 μM) and flutamide (8-10μM) produced a greater reduction in MTT-based cell viability than either single-agent treatment.
Evaluation of cell morphology
The morphological examination of prostate cancer cell lines, LNCaP, DU145, and PC3, was performed to evaluate the effects of Mebendazole and flutamide, both individually and in combination, on cellular morphology. The control cells exhibited a typical morphology, with adherent and well-spread cells. In the LNCaP and DU145 and PC3 cell line, treatment with flutamide (10 and12 μM) or Mebendazole (55 μM) alone resulted in a reduction in cell density and altered cell morphology, with cells appearing more rounded and detached from the surface. However, the combination of flutamide (8 μM) and Mebendazole (50 μM) for LNCaP and DU145, and flutamide (10 μM) and Mebendazole (55 μM) for PC3, induced more pronounced morphological changes, with a substantial decrease in cell density and the presence of numerous detached and shrunken cells, indicative of cell death and had a more profound effect, with a substantial reduction in cell density and the presence of numerous detached and shrunken cells, indicative of cell death (Fig. 2).
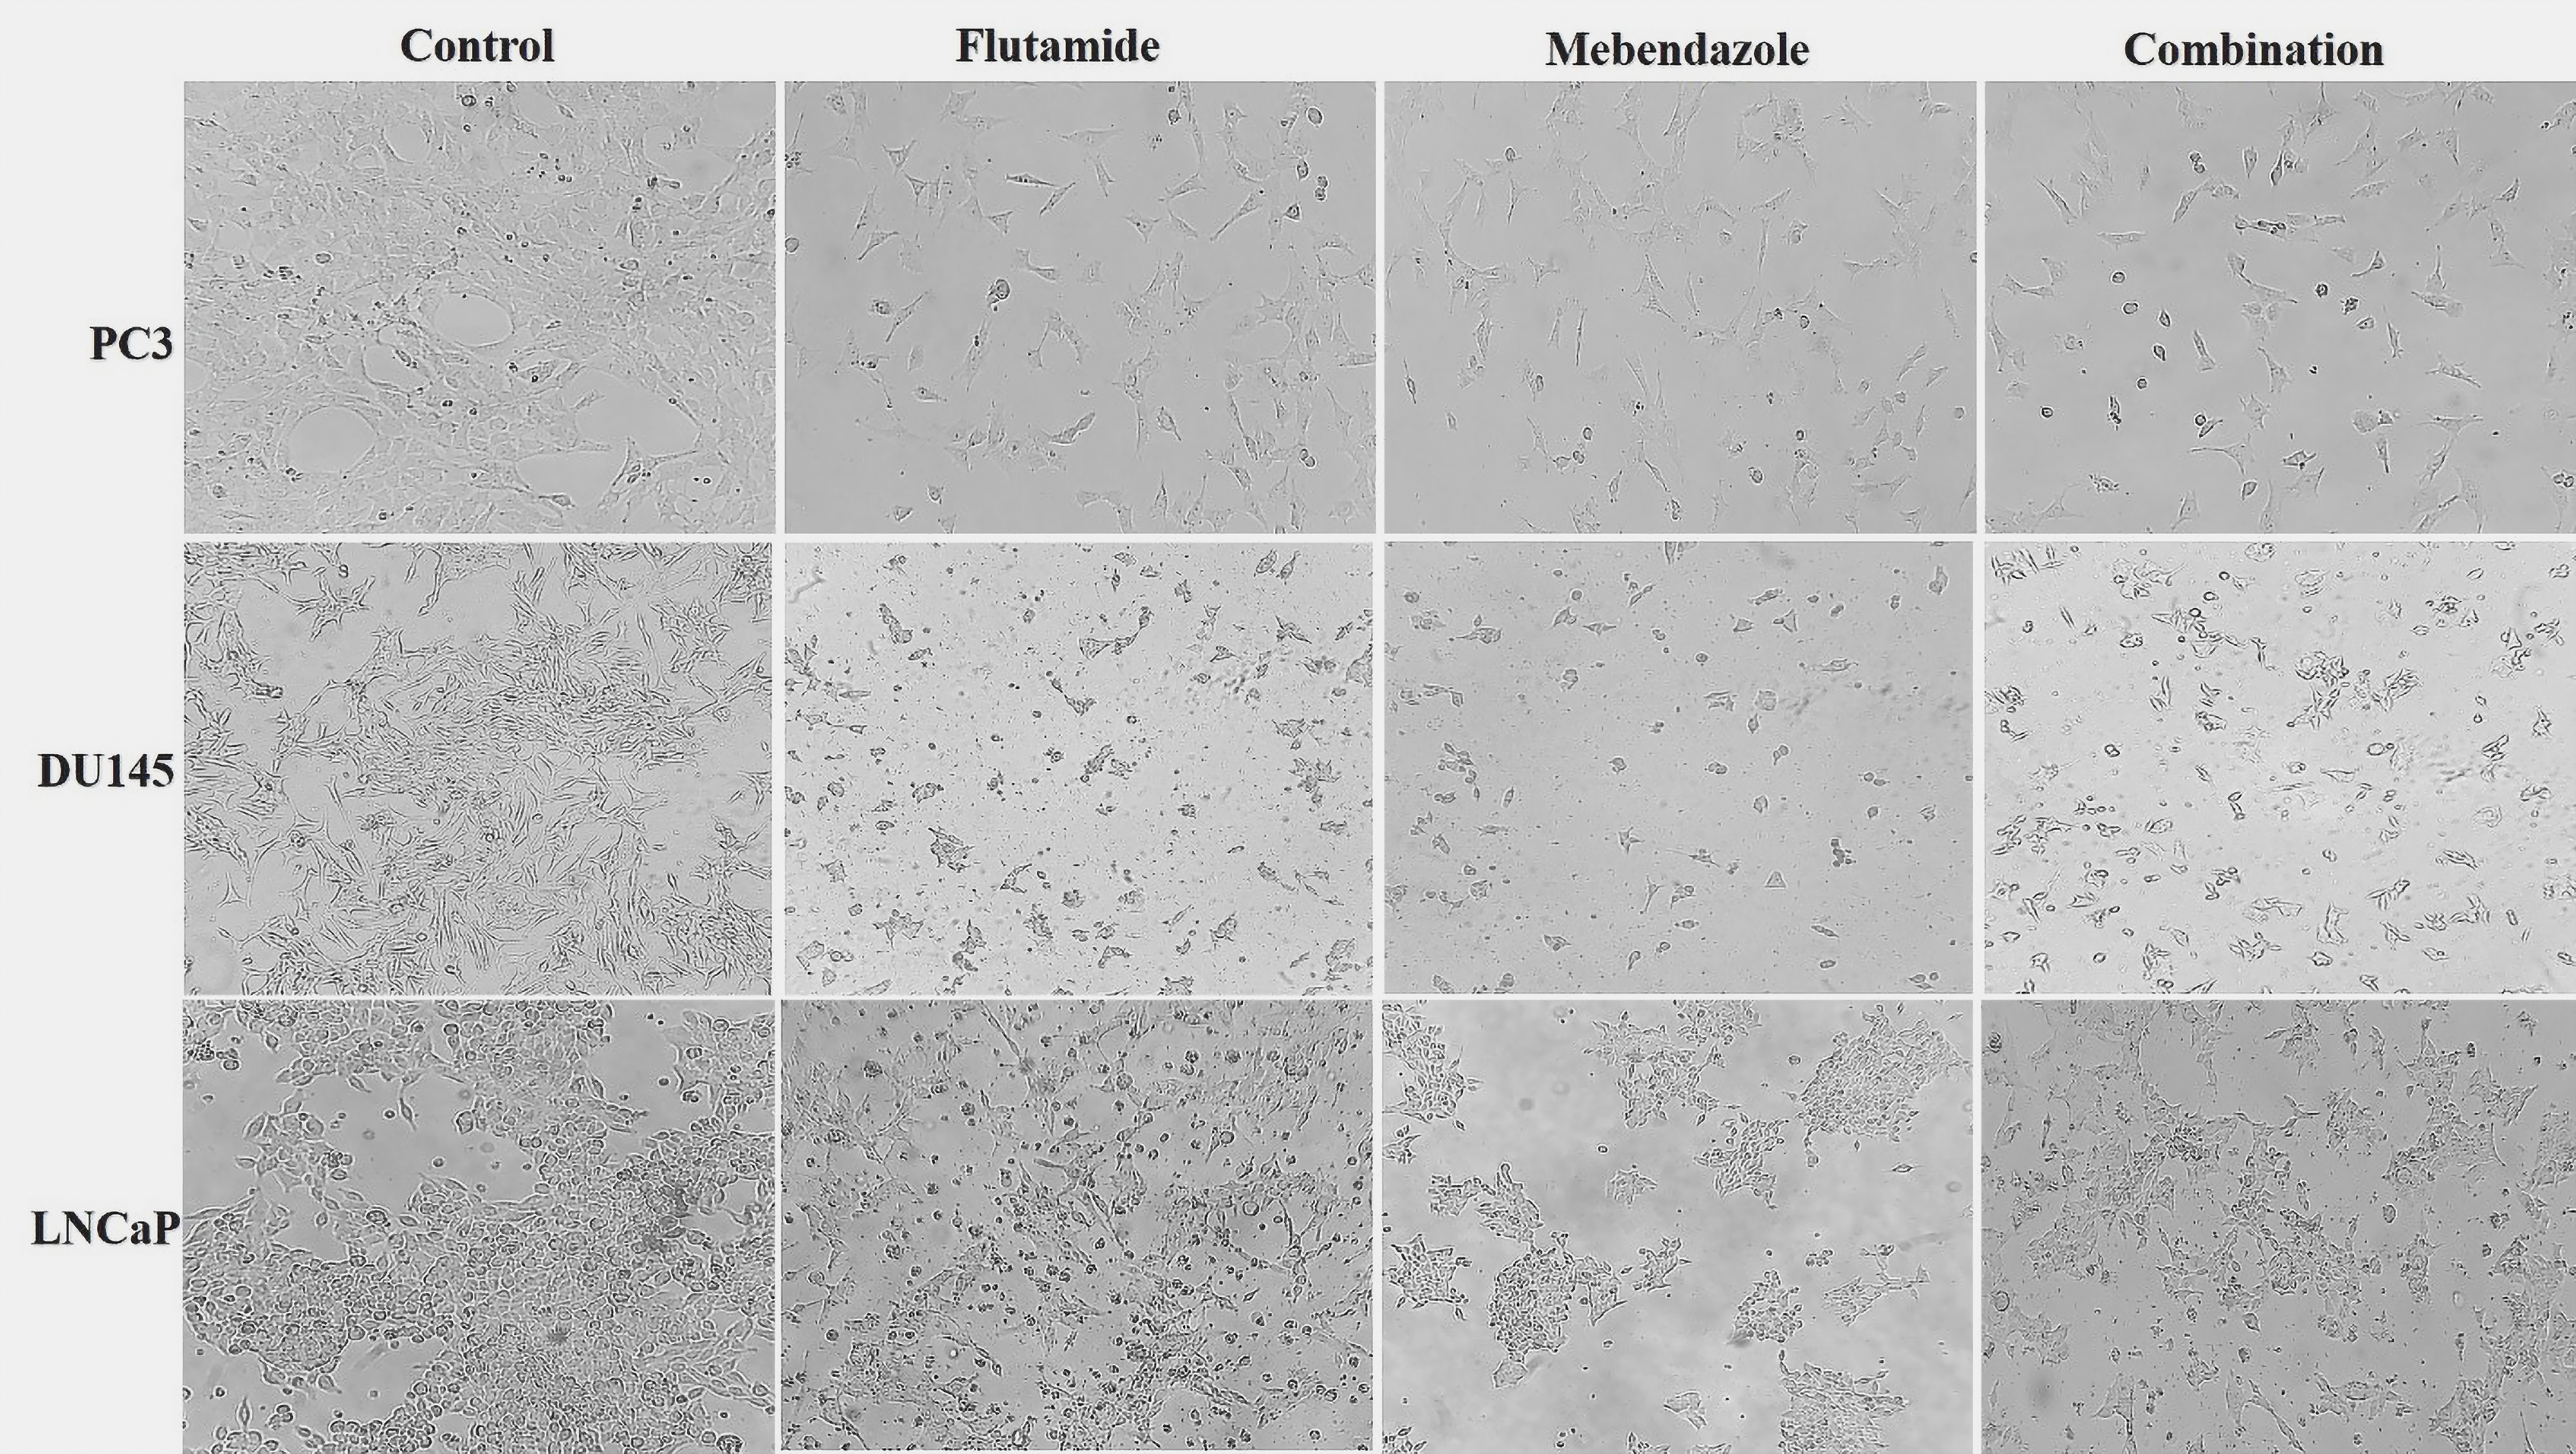
Fig. 2: Morphological changes in prostate cancer cell lines induced by Mebendazole and flutamide treatment. Representative phase-contrast micrographs show the morphological effects of Mebendazole (55 μM), flutamide (10 μM and 12 μM), and their combination (flutamide 8 μM and10 μM + Mebendazole 50 μM and 55 μM) on LNCaP/ DU145 and PC3 prostate cancer cells after 48 hours of treatment. Untreated control cells exhibited a typical adherent and spread morphology. Treatment with Mebendazole or flutamide alone induced cell rounding and detachment, while the combination treatment resulted in a substantial reduction in cell density and the presence of numerous detached and shrunken cells, indicative of enhanced cell death. Scale bar: 100 μm.
Evaluation of colony formation
The colony formation assay was performed to assess the long-term effects of Mebendazole and flutamide, both individually and in combination, on the clonogenic potential of prostate cancer cells. The results revealed a significant reduction in colony formation across all three cell lines (LNCaP, DU145, and PC3) upon treatment with Mebendazole or flutamide alone, compared to the untreated control cells. In the LNCaP cell line, treatment Flutamide (10 μM) alone resulted in a reduction of colony formation with significant difference (P<0.05), when compared to Mebendazole. Notably, the combination treatment of Mebendazole (50 μM) and flutamide (8 μM) exhibited a remarkable enhanced inhibitory effect, leading to a substantial suppression of colony formation, compared to each group of Flutamide (P<0.001) or Mebendazole (P<0.0001). Similar trends were observed in the DU145 cell line, where Mebendazole (55 μM) or flutamide (10 μM) alone reduced colony formation. The combination of Mebendazole (50 μM) and flutamide (8 μM) resulted in inhibition of colony formation, compared to Flutamide (P<0.0001) or Mebendazole (P<0.001). In the PC3 cell line, treatment with Mebendazole (55 μM) or flutamide (12 μM) alone decreased colony formation. Moreover, the combination of Mebendazole (55 μM) and flutamide (10 μM) also exhibited the enhanced inhibitory effect, leading to a substantial reduction in colony formation (Fig. 3).
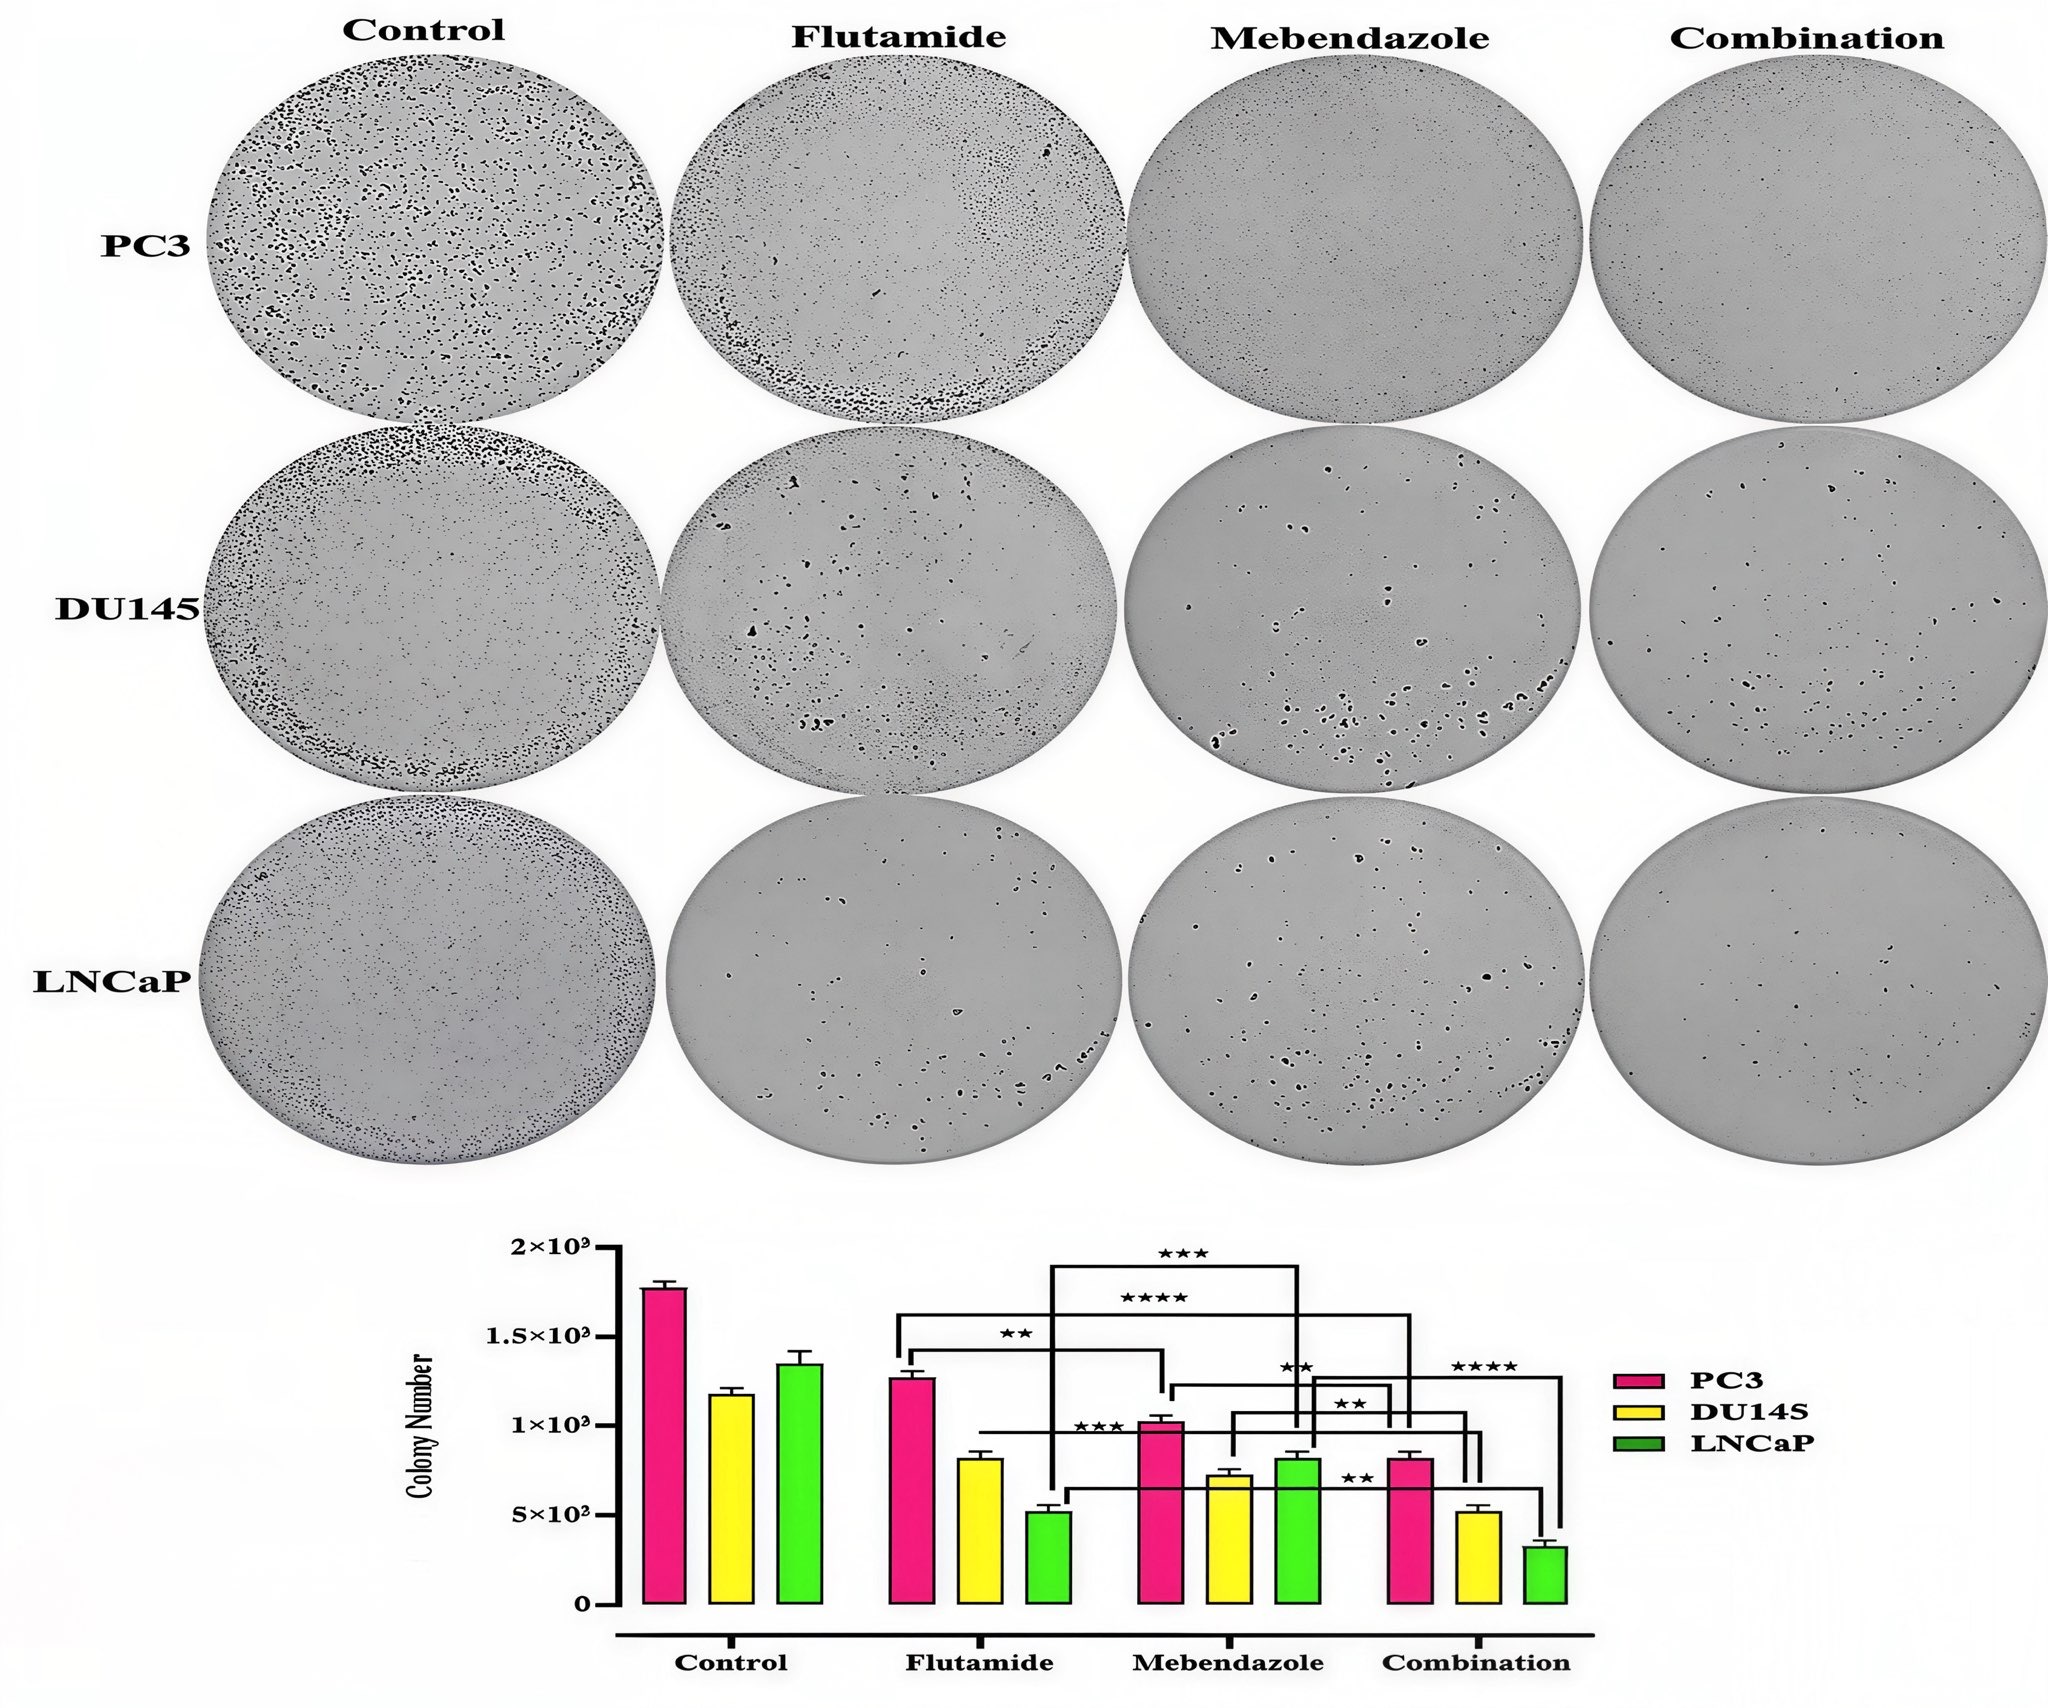
Fig. 3: Inhibition of colony formation in prostate cancer cell lines by Mebendazole and flutamide treatment. The clonogenic potential of LNCaP/ DU145, and PC3 cells was assessed by colony formation assays after treatment with Mebendazole (55 μM), flutamide (10 μM and12 μM), or their combination (flutamide 8 μM and 10 μM + Mebendazole 50 μM and 55 μM). The bar graph represents the percentage of colonies formed relative to the untreated control. Data are presented as mean ± SEM from three independent experiments. At the tested concentrations, the combination treatment produced a greater reduction in colony formation than either single-agent treatment across the three prostate cancer cell lines.
Effects of Flutamide and Mebendazole on the migration of the prostate cancer cells
The migration assay was performed to evaluate the effects of Mebendazole and flutamide, both individually and in combination, on the migratory potential of prostate cancer cells. The results demonstrated a significant reduction in cell migration across all three cell lines (LNCaP, DU145, and PC3) upon treatment with Mebendazole or flutamide alone, compared to the untreated control group. However, the combination treatment exhibited a greater inhibitory effect than either single treatment at the tested concentrations, leading to a more pronounced inhibition of cell migration. In the LNCaP cell line, treatment with flutamide (10 μM) or Mebendazole (55 μM) alone resulted in a significant reduction in cell migration, compared to the control group. Notably, the combination of flutamide (8 μM) and Mebendazole (50 μM) led to a substantial suppression of cell migration. Similar trends were observed in the DU145 cell line, where flutamide (10 μM) or Mebendazole (55 μM) alone significantly reduced cell migration. However, the combination of flutamide (8 μM) and Mebendazole (50 μM) exhibited an enhanced inhibitory effect, resulting in a remarkable inhibition of cell migration compared to the control group. In the PC3 cell line, treatment with flutamide (12 μM) or Mebendazole (55 μM) alone significantly decreased cell migration. Notably, the combination of flutamide (10 μM) and Mebendazole (55 μM) led to a substantial reduction in cell migration compared to the untreated control (Fig. 4).
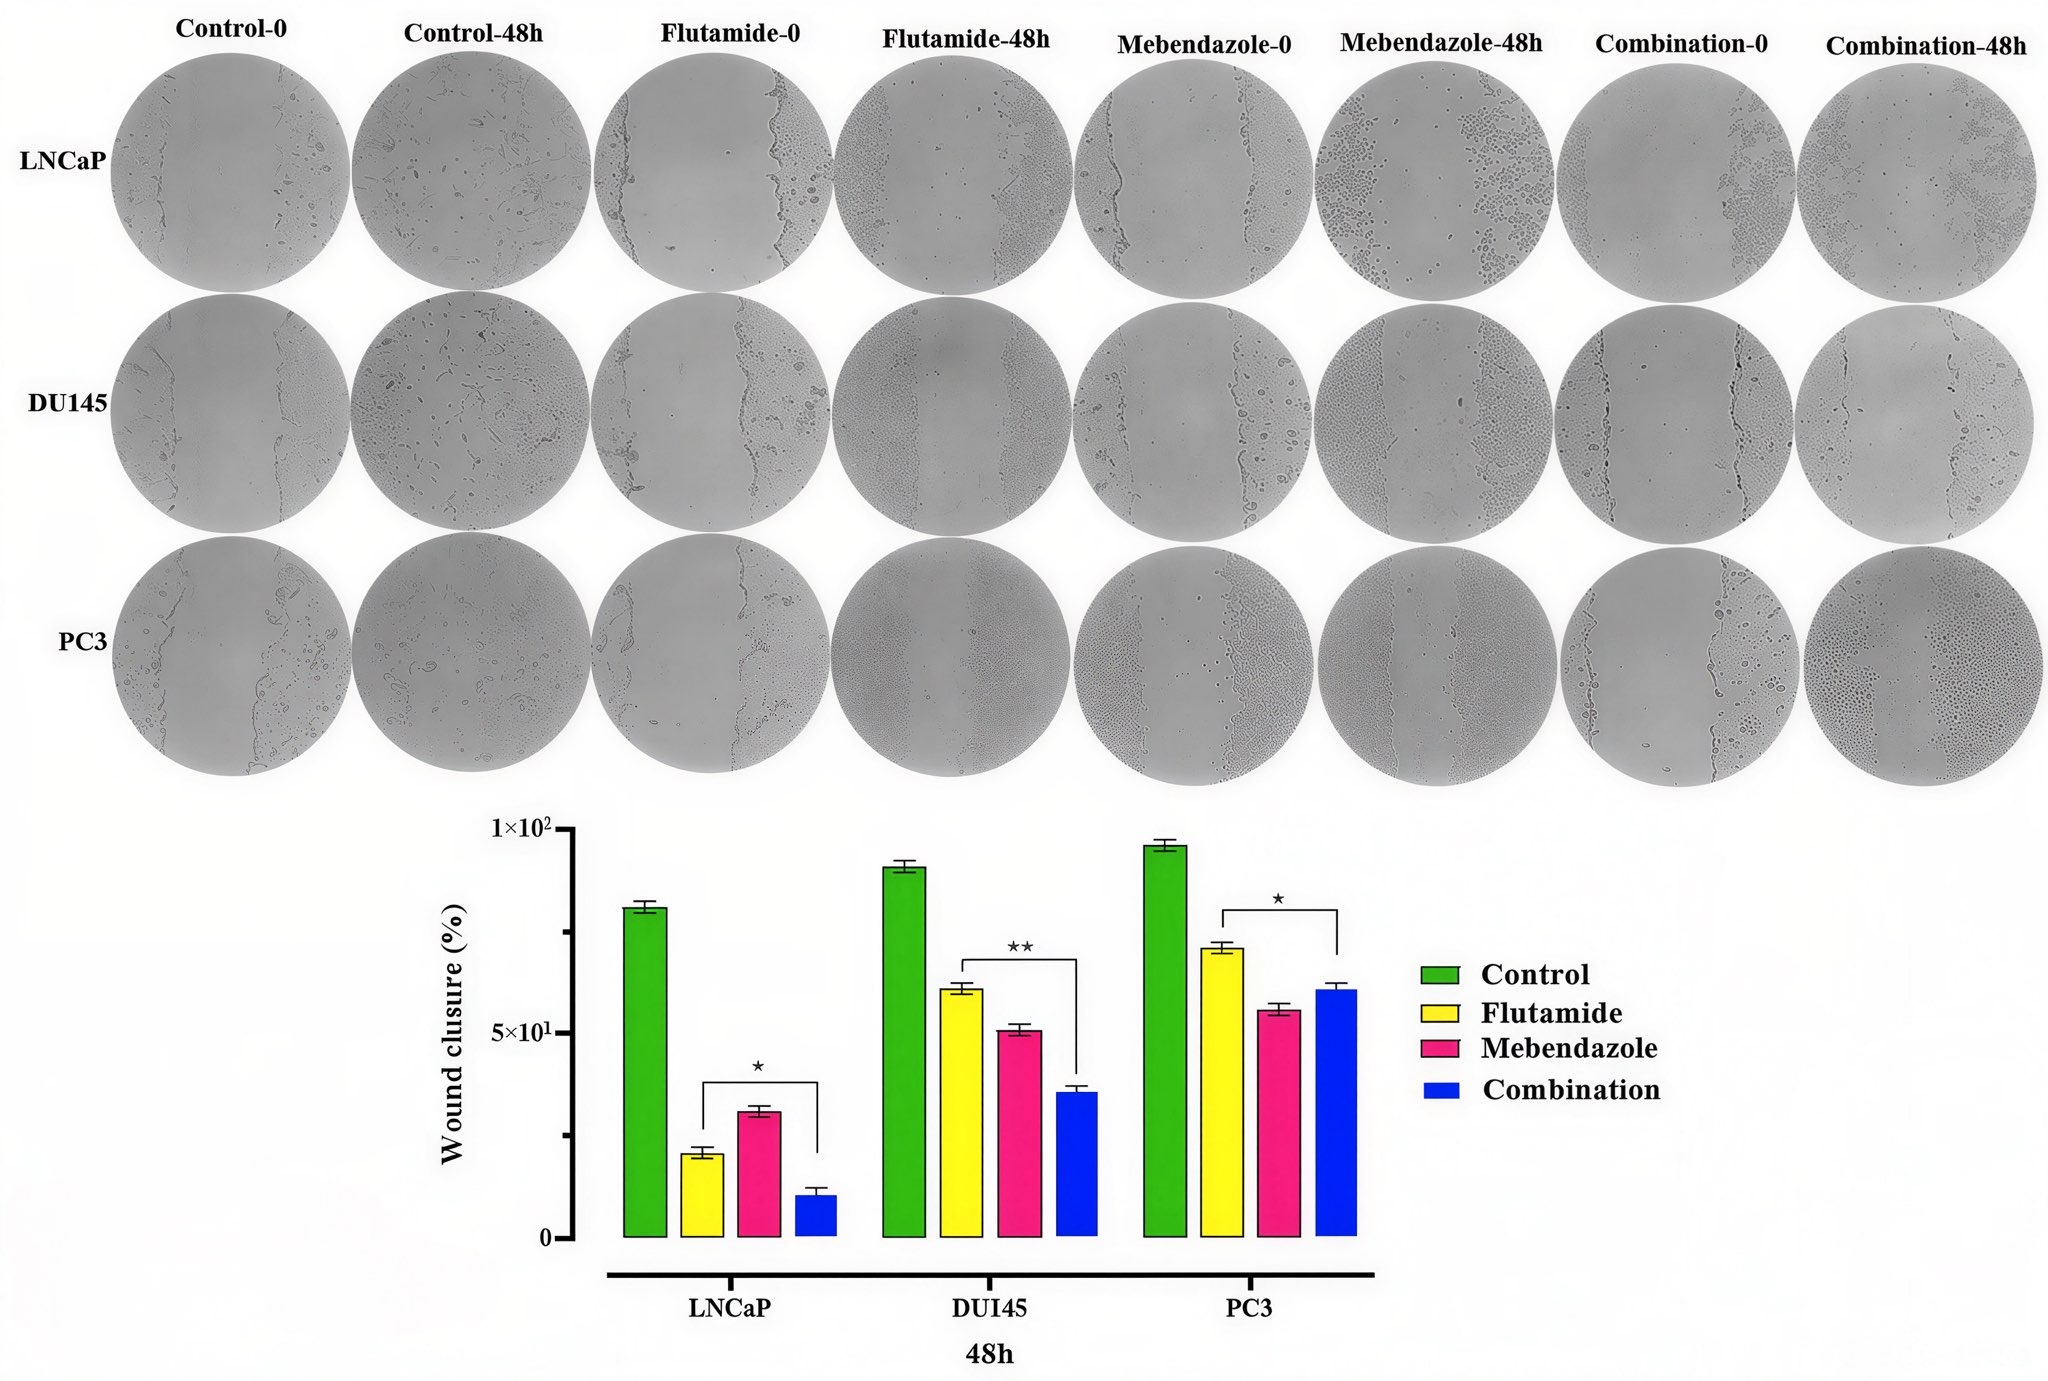
Fig. 4: Inhibition of cell migration in prostate cancer cell lines by Mebendazole and flutamide treatment. The bar graph represents the percentage of cell migration relative to the untreated control in LNCaP, DU145, and PC3 cells after treatment with Mebendazole (55 μM), flutamide (10 μM and 12 μM), or their combination (flutamide 8 μM and 10 μM + Mebendazole 50 μM and 55 μM) for 48 hours. The images show the migratory patterns of cells in the respective treatment groups compared to the untreated control. Scale bar: 200 μm. Data are presented as mean ± SD from three independent experiments. Statistical significance was determined using one-way ANOVA with Dunnett's multiple comparison test.
Findings of Cell Apoptosis Changes by Flow Cytometry
Flow-cytometric analysis using Annexin V/PI staining was performed to evaluate apoptosis after 48 h of treatment with mebendazole, flutamide, or their combination. Total apoptosis was calculated as the sum of early apoptotic cells and late apoptotic cells. In LNCaP and DU145 cells, both single-agent treatments increased apoptotic cell populations compared with the untreated control, while the combination treatment produced the highest percentage of apoptotic cells. In PC3 cells, apoptosis induction was less pronounced; however, the combination treatment still increased the apoptotic population compared with the control group. These findings suggest that apoptosis contributes to the inhibitory effects of the combination treatment, particularly in LNCaP and DU145 cells. Although, in the DU145 and LNCaP cell lines, the combination therapy of Mebendazole and Flutamide was the most effective treatment, interestingly, Mebendazole alone showed promising effects on LNCaP cells. Necrosis, apoptosis (sum of early and late), and viability rate of each group is illustrated in Fig. 5.
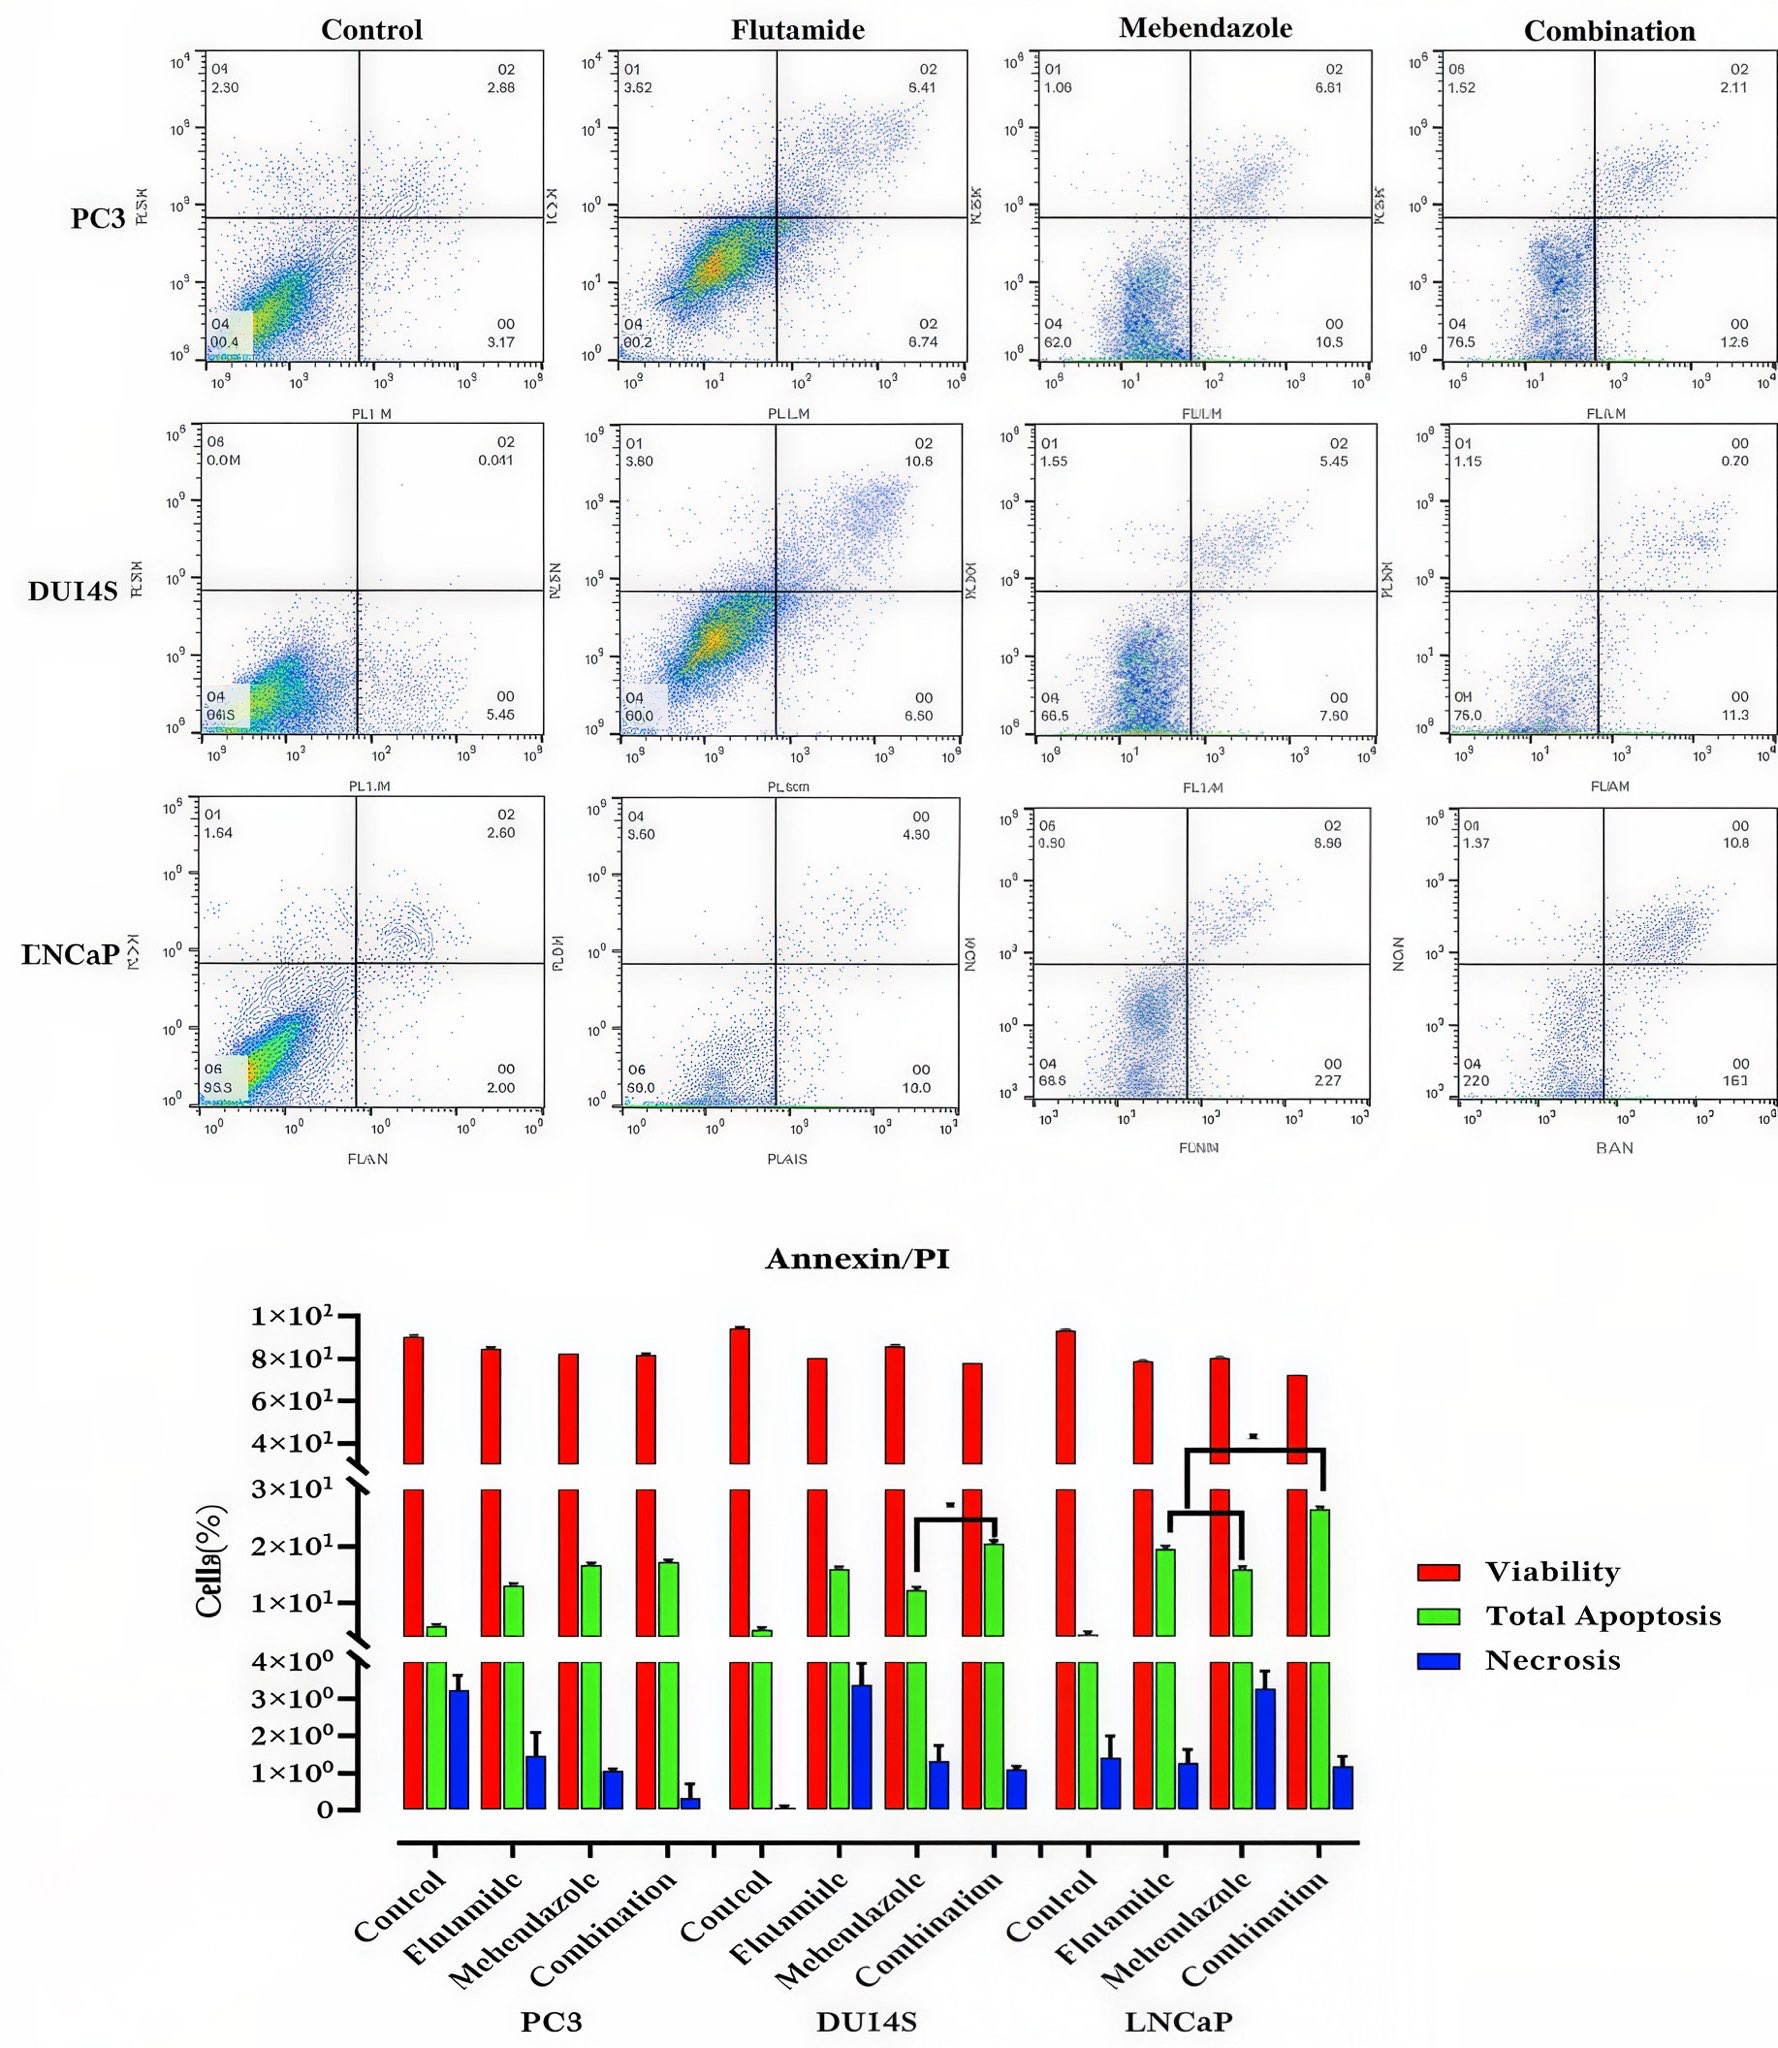
Fig. 5: Quantitative flow-cytometric analysis of apoptosis in LNCaP, DU145, and PC3 cells after 48 h of treatment with mebendazole, flutamide, or their combination. Total apoptosis was calculated as the sum of early apoptotic and late apoptotic cell populations. Data are presented as mean ± SD from three independent experiments.
Findings of Cell Cycle Changes by Flow Cytometry
Cell cycle flow cytometry assessment was undertaken to analyze the effect of the drugs’ IC50 s on cell cycle arrests of LNCaP, DU145 and PC3 cells. Our findings showed that in all three cell lines, cell arrest in combination was observed in G1/S phase in LNCaP, DU145 and S/G2 in PC3 (Fig. 6). The distribution of cells across cell-cycle phases was altered after treatment with mebendazole, flutamide, and their combination. In the combination-treated groups, LNCaP and DU145 cells showed increased accumulation in the G0/G1 phase, whereas PC3 cells showed increased accumulation in the G2/M phase compared with untreated controls. In addition, accumulation of cells in the sub-G1 population supported the apoptosis findings.
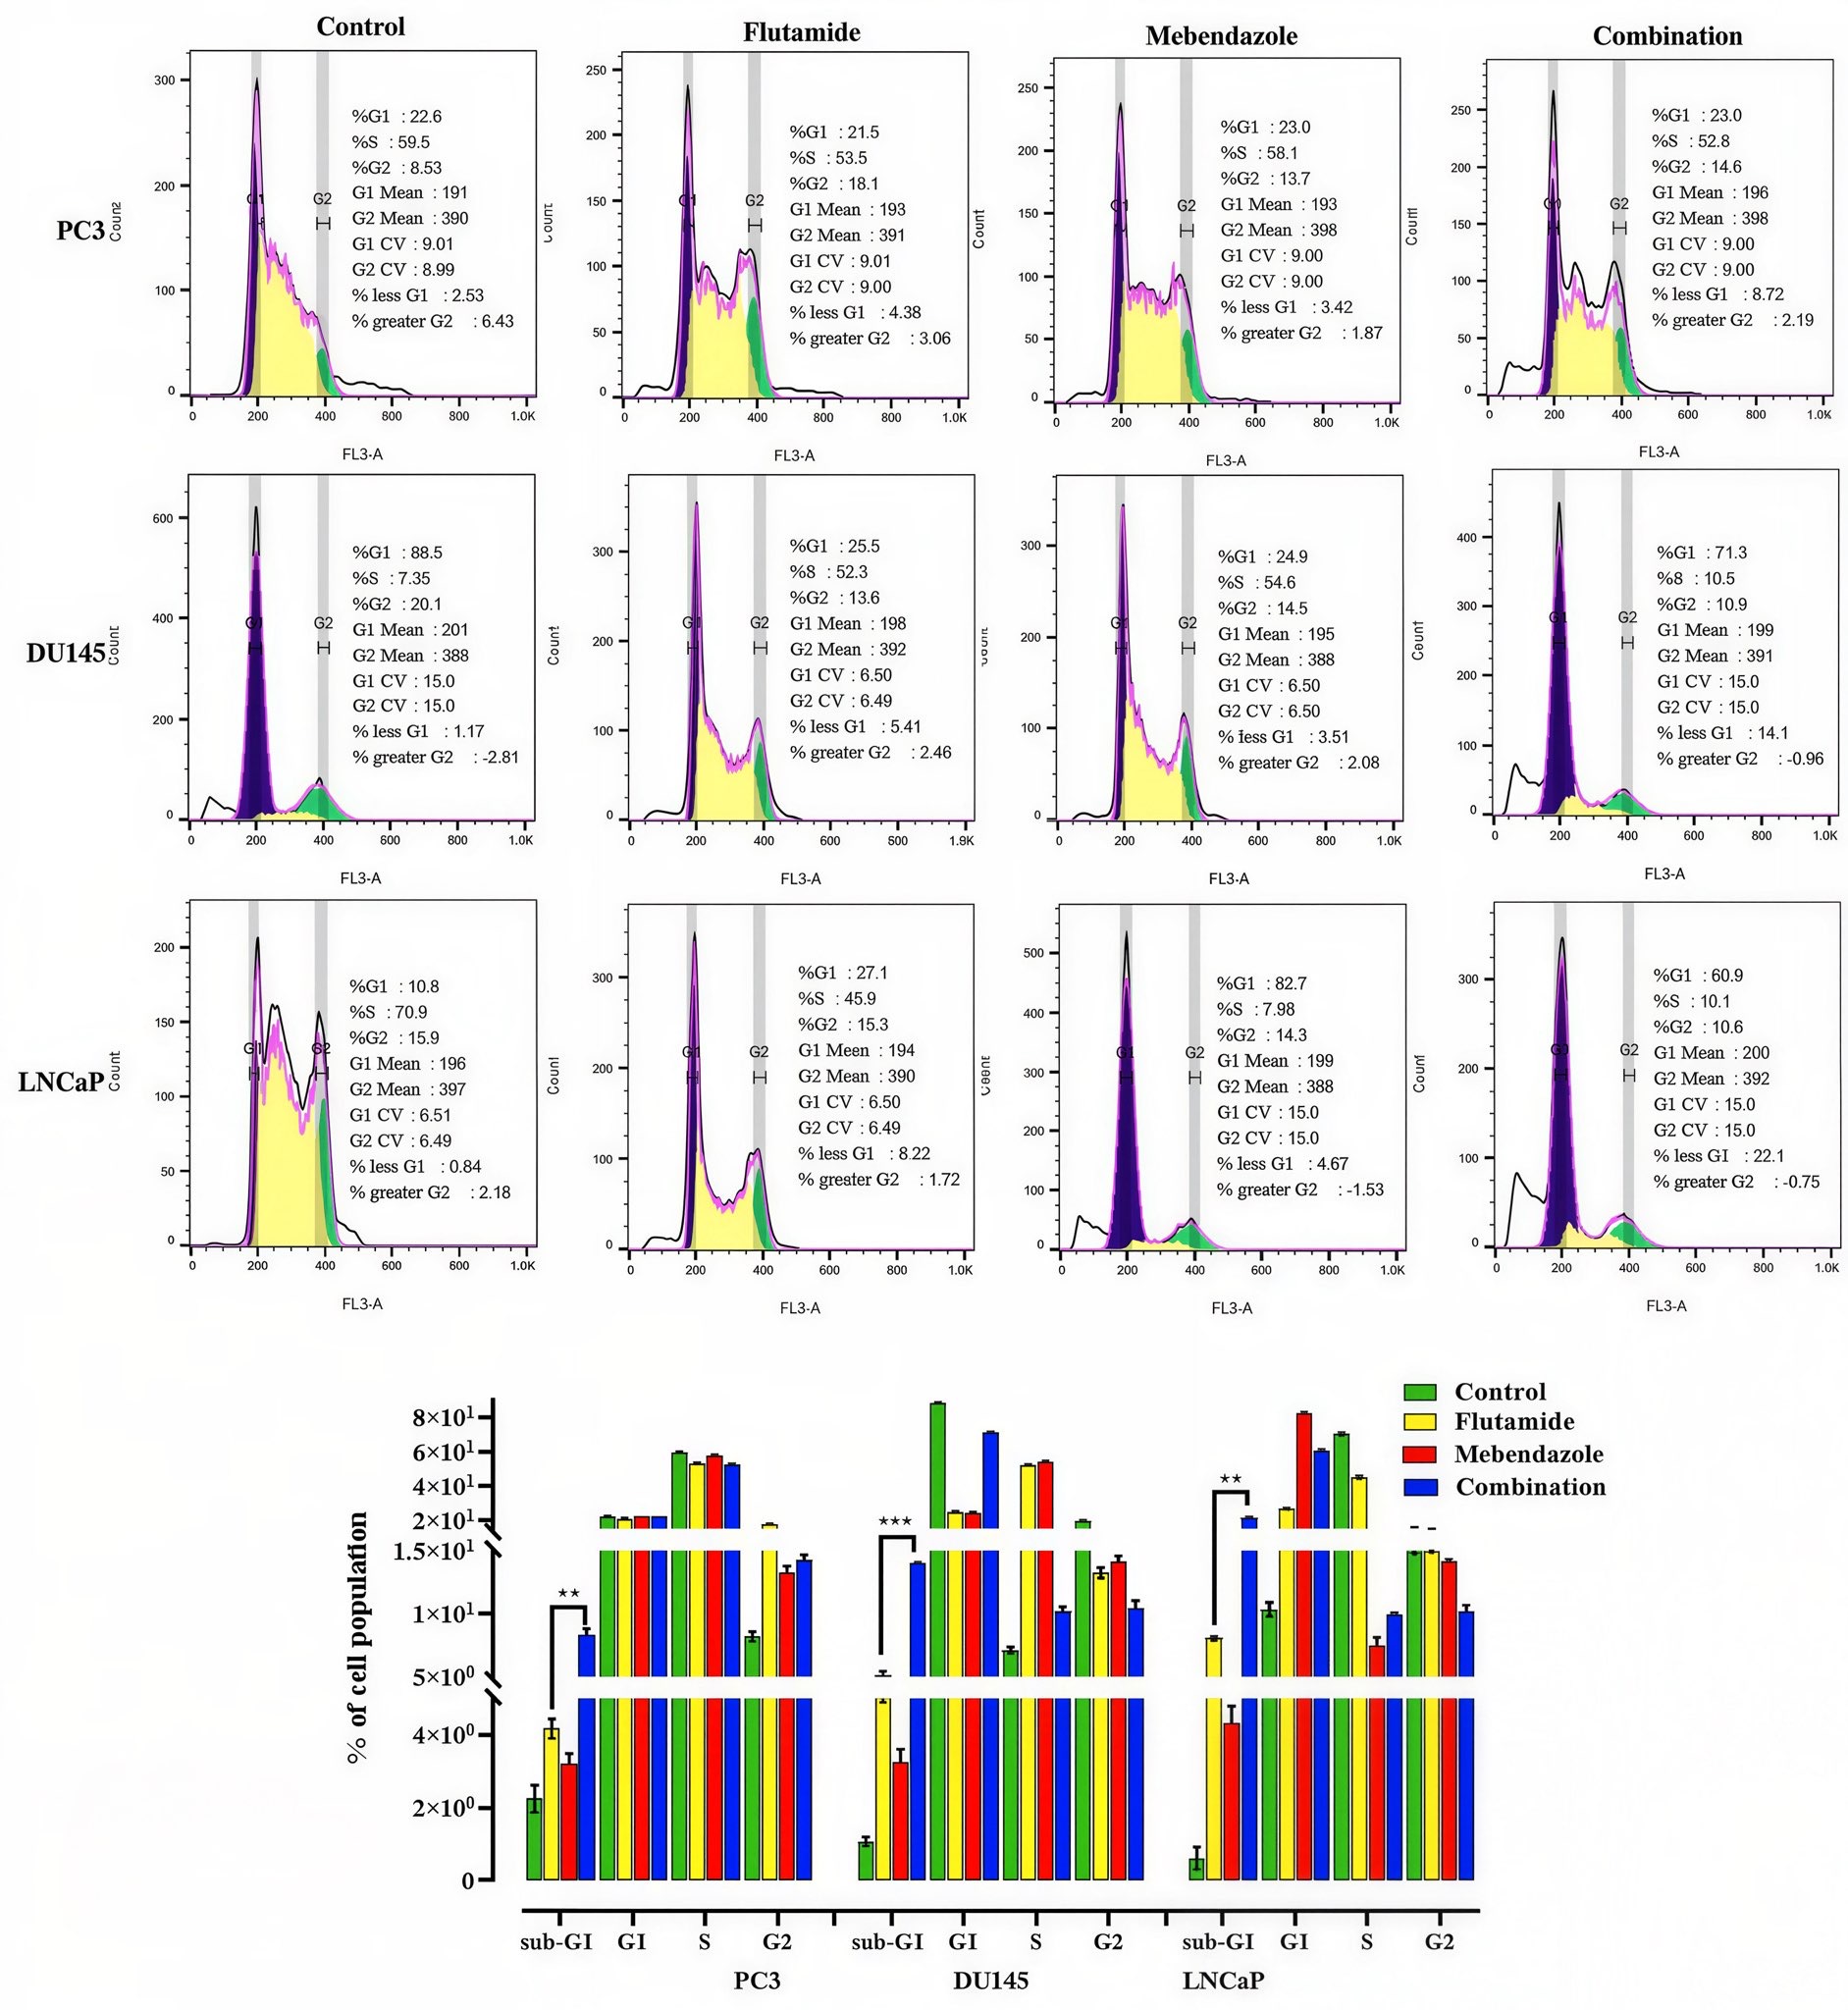
Fig. 6: Cell cycle analysis of LNCaP, DU145 and PC3. Cells accumulation in sub-G1 phase indicates the increased rate of apoptosis.
Gene Expression Profiles Across Experimental Groups
Following a 48-hour treatment period with Mebendazole, Flutamide, and their combination, the cells were examined for the expression levels of genes related to apoptosis (BAX and BCL-2), elements involved in the epithelial-mesenchymal transition (EMT) pathway (Snail1, E-Cadherin, and N-Cadherin), markers linked to angiogenesis (VEGFC and HIF-1α), as well as the prostate cancer biomarker (KLK3), and finally beta-tubulin (β-tubulin) family such as Tubulin Beta 1 Class VI (TUBB1) and Tubulin Beta 3 Class III (TUBB3) This analysis was conducted using RT-PCR. The data presented in Fig. 7 indicates that the LNCaP cell line exhibited a notable enhancement in the expression levels of E-Cadherin (P < 0.0001), BAX and the BAX/BCL2 ratio (P<0.001) following treatment with combination of Mebendazole and Flutamide. This elevation in expression is associated with an increase in apoptosis and a reduction in epithelial-mesenchymal transition (EMT). Additionally, the combination treatment did not significantly alter the expression levels of VEGFC, HIF-1α , SNAIL1, KLK3, N-Cadherin, TUBB1 and TUBB3. In the DU145 cell line, the administration of Mebendazole in conjunction with Flutamide resulted in a marked decrease in the expression levels of beta-tubulin isoforms TUBB1 and TUBB3 (P<0.01). Furthermore, there was a significant increase in the levels of E-Cadherin, BAX and the BAX/BCL2 ratio (P<0.001). This combined treatment also produced a non-significant reduction in the expression of VEGFC, SNAIL1, KLK3, N-Cadherin, HIF-1α, and N-Cadherin. These mRNA-level findings are consistent with activation of apoptosis-related transcriptional responses; however, protein-level validation is required to confirm activation of the corresponding apoptotic pathway. Also, as demonstrated in Fig. 7, the combination of Mebendazole and Flutamide in the PC3 cell line exhibited a greater efficacy in reducing the expression levels of the N-Cadherin, and TUBB3 genes, as well as in enhancing the expression of E-Cadherin, BAX and the BAX/BCL2 ratio, compared to the effects of Mebendazole or Flutamide administered individually (P<0.001). Additionally, the combined treatment of Mebendazole and Flutamide did not result in a significant reduction in the expression of the VEGFC, HIF-1α, SNAIL1, KLK3, and TUBB1 genes.
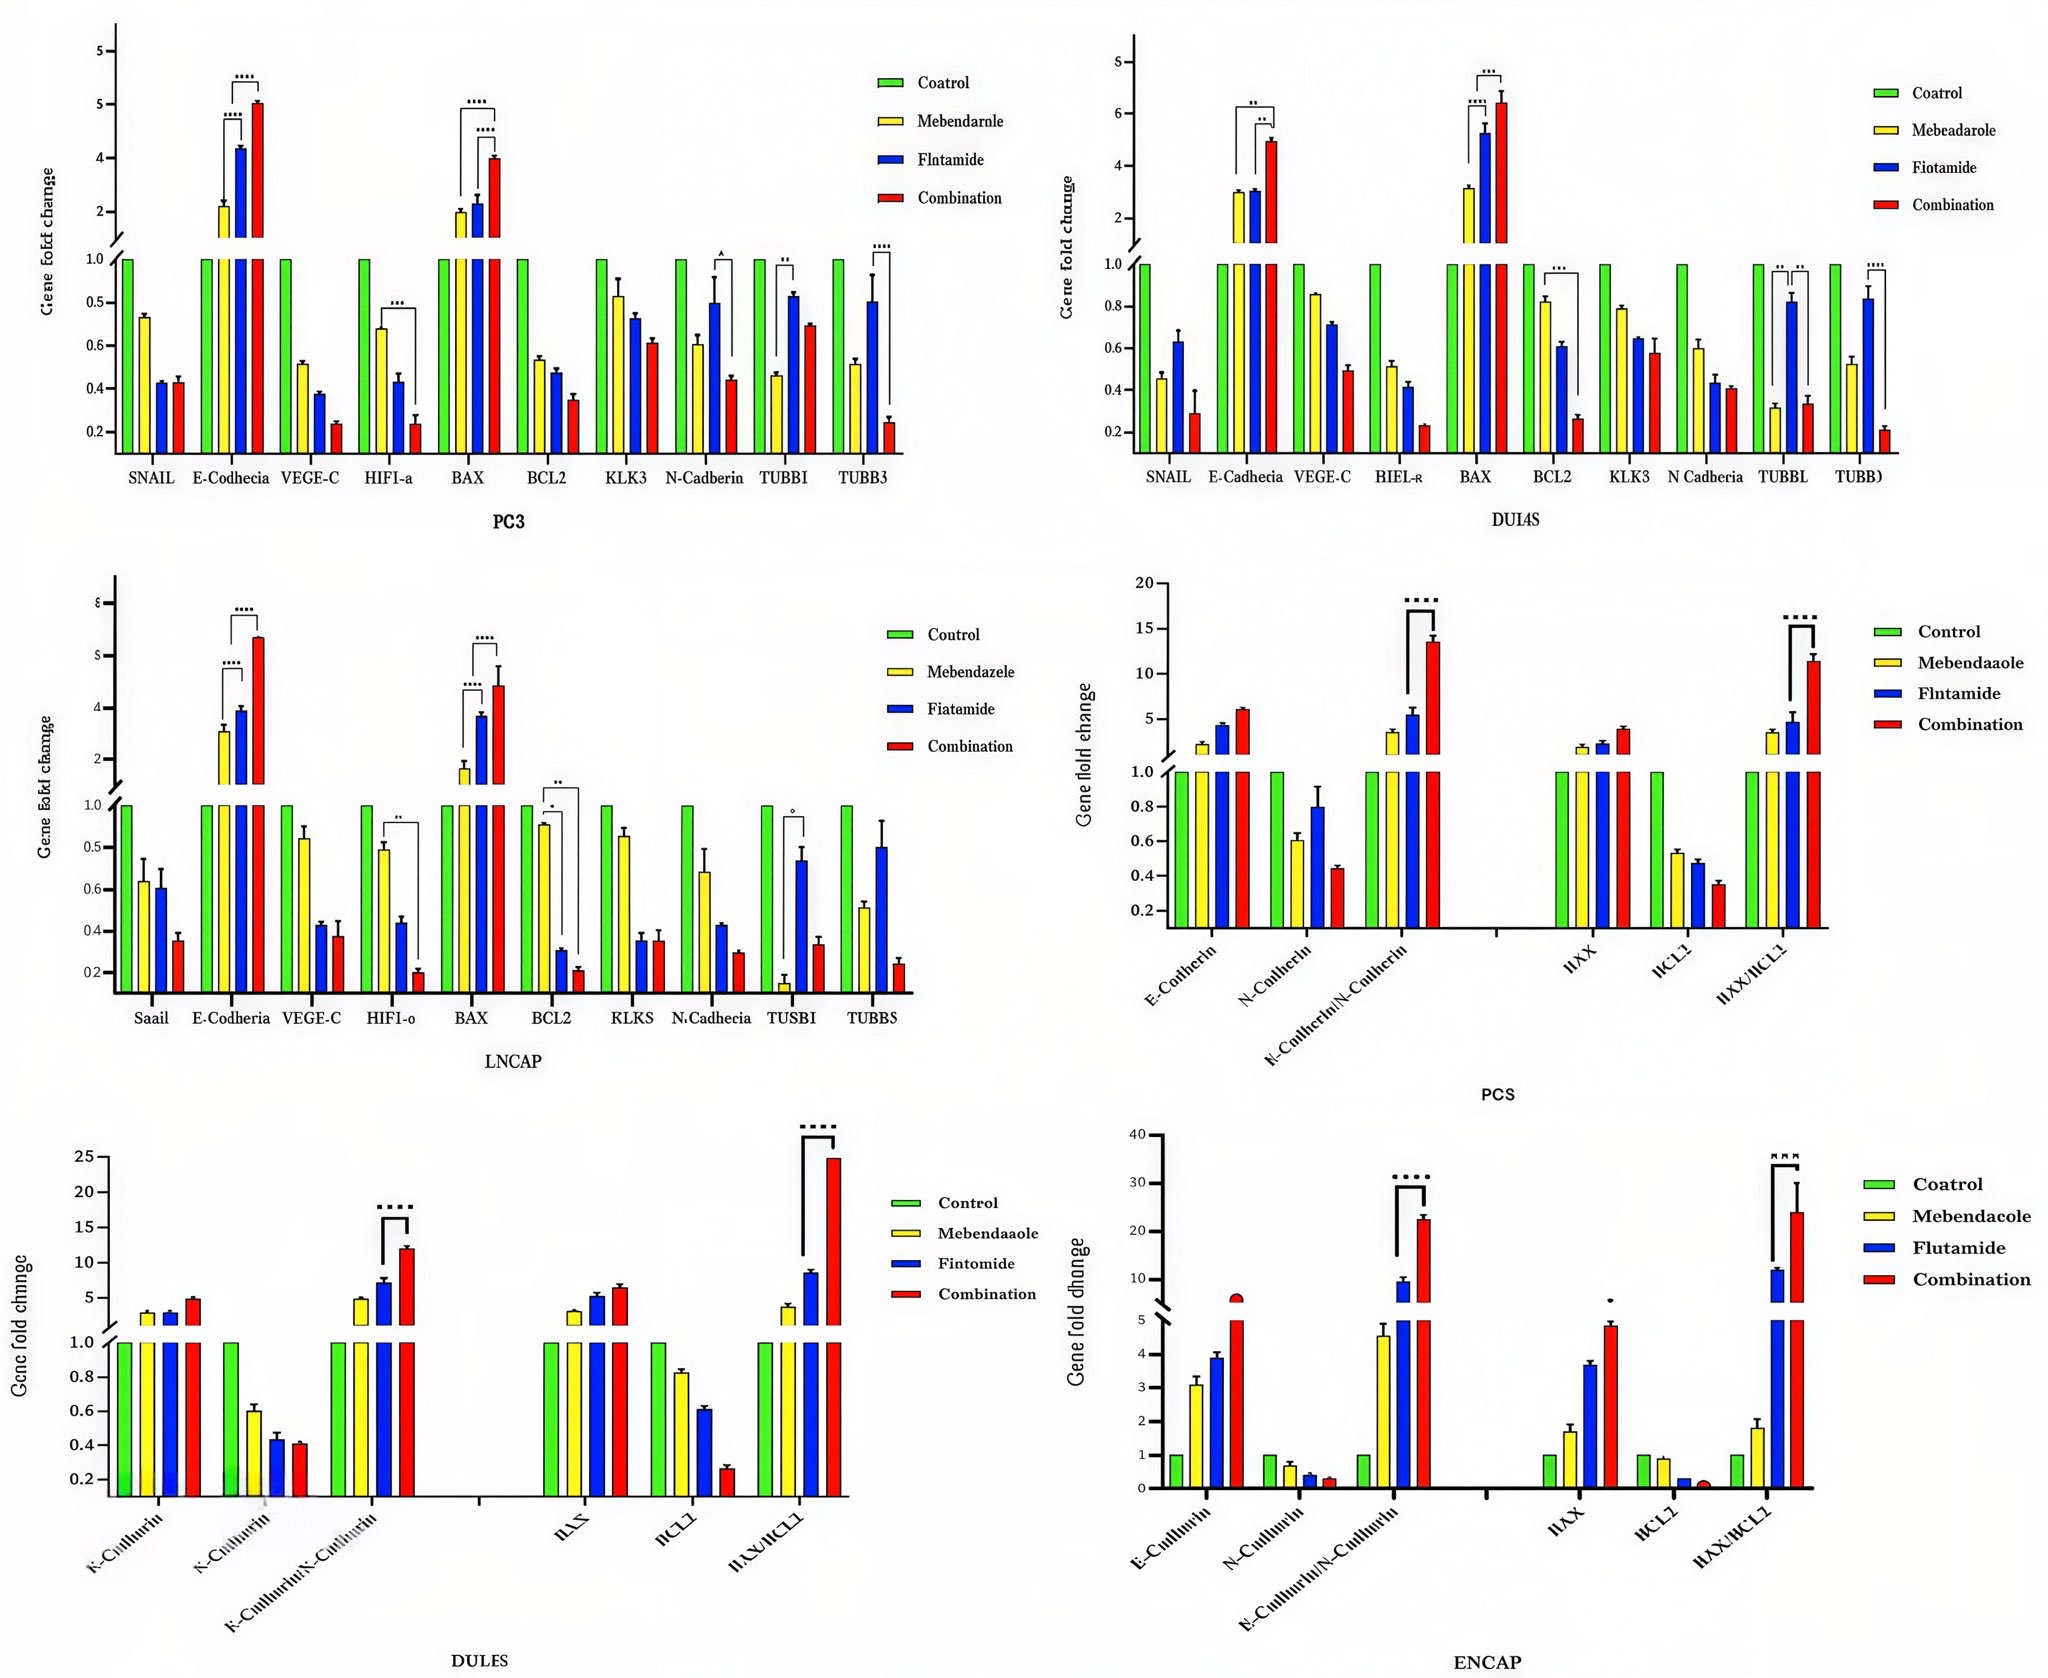
Fig. 7: The fold change results of mRNA level of genes in LNCaP, DU145 and PC3 prostate cancer cells following 48-hour treatment with Mebendazole, Flutamide and Mebendazole plus Flutamide. Comparing the combination groups with drugs alone treatments was performed using Graph Pad Prism software version 9, and the statistically significant changes are indicated by star signs.
Discussion
In the past two decades, significant advances have been made in the treatment and management of prostate cancer. However, disease progression and resistance to hormonal therapies remain major clinical challenges, particularly in advanced disease (20). Therefore, continued investigation of novel treatment strategies is needed to address therapeutic resistance and disease progression. The results of our study indicate that, at the tested concentrations, the combination of mebendazole and flutamide produced greater inhibitory effects on cell viability, colony formation, and cell migration than either agent alone. In addition, the combination treatment was associated with increased E-cadherin expression in all three cell lines and an increased BAX/BCL2 mRNA ratio. These findings suggest that combined mebendazole and flutamide treatment warrants further preclinical investigation in prostate cancer models. However, because a formal drug-interaction analysis was not performed, the observed effects should not be interpreted as definitive evidence of pharmacological synergy or additivity. Among tubulin-related genes, TUBB3 has been investigated in prostate cancer and has been associated with aggressive disease and resistance to taxane-based therapies (23-25). In other cancer models, suppression of PTEN/AKT signaling has been associated with reduced TUBB3 expression (26, 27). In the present study, combination treatment reduced TUBB1 mRNA expression in DU145 cells and TUBB3 mRNA expression in DU145 and PC3 cells, whereas no significant changes in these genes were observed in LNCaP cells. These findings suggest that treatment-related modulation of tubulin-associated genes may be cell-line dependent. Previous evidence has shown that androgen signaling may regulate Tubb3 expression in Sertoli cells and that flutamide reduced Tubb3 mRNA in that model (28). However, this observation cannot be directly extrapolated to prostate cancer cells, and the direct effect of flutamide on tubulin regulation in prostate cancer requires further investigation. Mebendazole has been investigated as a repurposed anticancer agent because of its ability to disrupt microtubule dynamics through inhibition of tubulin polymerization. Previous studies have reported that mebendazole may inhibit tumor growth, induce mitotic arrest and apoptosis, reduce angiogenesis, and affect signaling pathways associated with cancer progression (5, 29). Consistent with these observations, the present study showed that mebendazole, alone and in combination with flutamide, reduced MTT-based cell viability and clonogenic potential and increased apoptosis-related changes in prostate cancer cell lines. However, the present experiments do not establish the specific molecular mechanism responsible for these effects. Previous work showed that mebendazole reduced cell migration and proliferation in oral squamous cell carcinoma cells and premalignant oral keratinocytes (30). Consistent with these findings, we observed that mebendazole alone and in combination with flutamide inhibited cell migration in prostate cancer cell lines, particularly in LNCaP cells. In another study by Martarelli et al. (2008), the effect of mebendazole on H295R, SW-13 (human adrenocortical carcinoma) and WI-38 (normal fibroblast) cell lines was investigated and they found that the two cancer cell lines showed dose-dependent growth arrest and mebendazole reduced tumor volume in both H295R (50% and 60% reduction, respectively) and SW-13 (70% and ~60% reduction, respectively) compared to the control group (31). Similarly, in the present study, the combination treatment produced a greater reduction in MTT-based cell viability and colony formation than either single-agent treatment at the tested concentrations. Previous studies have reported that high TUBB3 expression is associated with metastatic prostate cancer, PTEN loss, resistance to androgen-targeted therapies, and poorer outcomes during androgen-deprivation therapy (25). In the present study, TUBB3 mRNA expression was reduced by combination treatment in DU145 and PC3 cells, whereas no significant change was observed in LNCaP cells. These findings support further investigation of TUBB3-related pathways in a cell-line-specific manner. This study has several limitations. First, the combination was tested at selected concentrations, and formal combination-index, Bliss, Loewe, or ZIP analyses were not performed. Therefore, the observed effects should not be described as synergistic or additive. Second, mechanistic conclusions are limited by the absence of protein-level validation of apoptosis-related markers. Finally, these findings are based exclusively on in vitro prostate cancer cell-line models. Further studies using formal drug-interaction analyses, protein-based mechanistic assays, and in vivo models are required before clinical relevance can be inferred.
Conclusion
The combination of mebendazole and flutamide demonstrated a significant reduction in the viability of prostate cancer cells across all three tested cell lines, surpassing the effects of either agent used independently. Additionally, this combination effectively inhibited cell migration and overall progression in various prostate cancer cell lines, including PC3, DU145, and LNCaP. These in vitro findings suggest that combined mebendazole and flutamide treatment may represent a promising experimental approach for further investigation in prostate cancer models. Nonetheless, further extensive research is required to validate and reinforce these findings.
Acknowledgements
The authors would like to express their sincere gratitude to the statistical consultants at the Research Development Center of Sina Hospital for their invaluable technical support and insightful guidance throughout the statistical analyses of this study. The authors also gratefully acknowledge the Students' Scientific Research Center (SSRC), Tehran University of Medical Sciences, Tehran, Iran, for establishing and pioneering the Research Diploma Program. This unique initiative has provided outstanding opportunities for students to bridge fundamental laboratory research with clinical medicine, fostering translational research and enabling the successful execution of the in vitro aspects of the present study. The educational environment and mentorship provided through this program have been instrumental in shaping the scientific foundation of this work. During the revision of this manuscript, the authors also used ChatGPT (OpenAI) solely for assistance with English language editing, grammar correction, and improvement of readability. All scientific content, interpretation, and final wording were reviewed and approved by the authors.
Authors’ contributions
Mohammad Reza Fattahi: conceptualization, interpretation the result and writing original draft and revision; Diana Taheri, Seyed Hassan Inanloo, Akram Mirzaei, and Helia Azodian Ghajar: validation and methodology; Leonardo Oliveira Reis: editing and reviewing; Seyed Mohammad Kazem Aghamir: conceptualization, project administration
Data Availability Statement
Data will be provided on request.
Disclosure Statement
All authors declare that they have no competing interests.
References
- Bray F, Laversanne M, Sung H, Ferlay J, Siegel RL, Soerjomataram I, et al. Global cancer statistics 2022: GLOBOCAN estimates of incidence and mortality worldwide for 36 cancers in 185 countries. CA: A Cancer Journal for Clinicians. 2024;74(3):229-63. https://doi.org/10.3322/caac.21834
- Chen C-R, Briggs L, Koelker M, Stone BV, Alkhatib K, Labban M, et al. The association between behavioral habits and physical health status in prostate cancer patients: a large US national health-related survey. Prostate International. 2024. https://doi.org/10.1016/j.prnil.2024.08.001
- Siegel RL, Miller KD, Fuchs HE, Jemal A. Cancer statistics, 2022 CA: a cancer journal for clinicians. 2022;72(1). https://doi.org/10.3322/caac.21708
- Sekhoacha M, Riet K, Motloung P, Gumenku L, Adegoke A, Mashele S. Prostate cancer review: genetics, diagnosis, treatment options, and alternative approaches. Molecules. 2022;27(17):5730. https://doi.org/10.3390/molecules27175730
- Sasaki J-i, Ramesh R, Chada S, Gomyo Y, Roth JA, Mukhopadhyay T. The anthelmintic drug mebendazole induces mitotic arrest and apoptosis by depolymerizing tubulin in non-small cell lung cancer cells. Molecular cancer therapeutics. 2002;1(13):1201-9.
- Jamroze A, Chatta G, Tang DG. Androgen receptor (AR) heterogeneity in prostate cancer and therapy resistance. Cancer letters. 2021;518:1-9. https://doi.org/10.1016/j.canlet.2021.06.006
- Kahn B, Collazo J, Kyprianou N. Androgen receptor as a driver of therapeutic resistance in advanced prostate cancer. International journal of biological sciences. 2014;10(6):588. https://doi.org/10.7150/ijbs.8671
- Tamehri Zadeh SS, Taheri D, Shivarani S, Khatami F, Kazemi R. Liquid Biopsy in Prostate Cancer Diagnosis and Prognosis: A Narrative Review. Translational Research in Urology. 2020;2(4):139-46.
- Mazdak H, Zandi Mashhadi Z, Nouri Mahdavi K, Kazemi R. Determination of Pre/Post Treatment Changes in Prostate Specific Antigen Levels in Patients with Acute Prostatitis. Translational Research in Urology. 2022;4(1):24-9.
- Wirth MP, Hakenberg OW, Froehner M. Antiandrogens in the treatment of prostate cancer. European urology. 2007;51(2):306-14. https://doi.org/10.1016/j.eururo.2006.08.043
- Chang A, Yeap B, Davis T, Blum R, Hahn R, Khanna O, et al. Double-blind, randomized study of primary hormonal treatment of stage D2 prostate carcinoma: flutamide versus diethylstilbestrol. Journal of clinical oncology. 1996;14(8):2250-7. https://doi.org/10.1200/JCO.1996.14.8.2250
- Mirzaei A, Akbari MR, Zadeh SST, Khatami F, Mashhadi R, Aghamir SMK. Novel combination therapy of prostate cancer cells with arsenic trioxide and flutamide: An in-vitro study. Tissue and Cell. 2022;74:101684. https://doi.org/10.1016/j.tice.2021.101684
- Vellky JE, Ricke WA. Development and prevalence of castration-resistant prostate cancer subtypes. Neoplasia. 2020;22(11):566-75. https://doi.org/10.1016/j.neo.2020.09.002
- Mora-Rodríguez JM, Sánchez BG, Sebastián-Martín A, Díaz-Yuste A, Sánchez-Chapado M, Palacín AM, et al. Resistance to 2-Hydroxy-Flutamide in Prostate Cancer Cells Is Associated with the Downregulation of Phosphatidylcholine Biosynthesis and Epigenetic Modifications. International journal of molecular sciences. 2023;24(21). https://doi.org/10.3390/ijms242115626
- Suzuki H, Okihara K, Miyake H, Fujisawa M, Miyoshi S, Matsumoto T, et al. Alternative nonsteroidal antiandrogen therapy for advanced prostate cancer that relapsed after initial maximum androgen blockade. The Journal of urology. 2008;180(3):921-7. https://doi.org/10.1016/j.juro.2008.05.045
- Iguchi T, Tamada S, Kato M, Yasuda S, Yamasaki T, Nakatani T. Enzalutamide versus flutamide for castration-resistant prostate cancer after combined androgen blockade therapy with bicalutamide: study protocol for a multicenter randomized phase II trial (the OCUU-CRPC study). BMC Cancer. 2019;19(1):339. https://doi.org/10.1186/s12885-019-5526-3
- Guerini AE, Triggiani L, Maddalo M, Bonù ML, Frassine F, Baiguini A, et al. Mebendazole as a candidate for drug repurposing in oncology: An extensive review of current literature. Cancers. 2019;11(9):1284. https://doi.org/10.3390/cancers11091284
- Pantziarka P, Bouche G, Meheus L, Sukhatme V, Sukhatme VP. Repurposing Drugs in Oncology (ReDO)-mebendazole as an anti-cancer agent. ecancermedicalscience. 2014;8. https://doi.org/10.3332/ecancer.2014.485
- Hong J, Kwon KY, Jang DG, Kwon T, Yoon H, Park TJ. Mebendazole preferentially inhibits cilia formation and exerts anticancer activity by synergistically augmenting DNA damage. Biomedicine & Pharmacotherapy. 2024;174:116434. https://doi.org/10.1016/j.biopha.2024.116434
- Ali A, Kulik G. Signaling pathways that control apoptosis in prostate cancer. Cancers. 2021;13(5):937. https://doi.org/10.3390/cancers13050937
- Maffioli EM. Is traditional male circumcision effective as an HIV prevention strategy? Evidence from Lesotho. PloS one. 2017;12(5):e0177076. https://doi.org/10.1371/journal.pone.0177076
- Collaborators G. The global, regional, and national burden of benign prostatic hyperplasia in 204 countries and territories from 2000 to 2019: a systematic analysis for the Global Burden of Disease Study 2019 Lancet Healthy Longev. 2022; 3 (11): e754-76 2022.
- Maahs L, Sanchez BE, Gupta N, Van Harn M, Barrack ER, Reddy P-v, et al. Class III β-tubulin expression as a predictor of docetaxel-resistance in metastatic castration-resistant prostate cancer. PLoS One. 2019;14(10):e0222510. https://doi.org/10.1371/journal.pone.0222510
- Sekino Y, Han X, Kawaguchi T, Babasaki T, Goto K, Inoue S, et al. TUBB3 reverses resistance to docetaxel and cabazitaxel in prostate cancer. International journal of molecular sciences. 2019;20(16):3936. https://doi.org/10.3390/ijms20163936
- Sekino Y, Han X, Babasaki T, Miyamoto S, Kobatake K, Kitano H, et al., editors. TUBB3 is associated with PTEN, neuroendocrine differentiation, and castration resistance in prostate cancer. Urologic Oncology: Seminars and Original Investigations; 2021: Elsevier. https://doi.org/10.1016/j.urolonc.2021.03.001
- Yang Z, Liu Y, Shi C, Zhang Y, Lv R, Zhang R, et al. Suppression of PTEN/AKT signaling decreases the expression of TUBB3 and TOP2A with subsequent inhibition of cell growth and induction of apoptosis in human breast cancer MCF-7 cells via ATP and caspase-3 signaling pathways. Oncology Reports. 2017;37(2):1011-9. https://doi.org/10.3892/or.2017.5358
- Chen G, Sun L, Han J, Shi S, Dai Y, Liu W. RILPL2 regulates breast cancer proliferation, metastasis, and chemoresistance via the TUBB3/PTEN pathway. American journal of cancer research. 2019;9(8):1583.
- De Gendt K, Denolet E, Willems A, Daniels VW, Clinckemalie L, Denayer S, et al. Expression of Tubb3, a beta-tubulin isotype, is regulated by androgens in mouse and rat Sertoli cells. Biology of reproduction. 2011;85(5):934-45. https://doi.org/10.1095/biolreprod.110.090704
- Bai R-Y, Staedtke V, Aprhys CM, Gallia GL, Riggins GJ. Antiparasitic mebendazole shows survival benefit in 2 preclinical models of glioblastoma multiforme. Neuro-oncology. 2011;13(9):974-82. https://doi.org/10.1093/neuonc/nor077
- Kralova V, Hanušová V, Caltová K, Špaček P, Hochmalová M, Skálová L, et al. Flubendazole and mebendazole impair migration and epithelial to mesenchymal transition in oral cell lines. Chemico-biological interactions. 2018;293:124-32. https://doi.org/10.1016/j.cbi.2018.07.026
- Martarelli D, Pompei P, Baldi C, Mazzoni G. Mebendazole inhibits growth of human adrenocortical carcinoma cell lines implanted in nude mice. Cancer chemotherapy and pharmacology. 2008;61:809-17. https://doi.org/10.1007/s00280-007-0538-0