Original Article – DOI: 10.33594/000000891
CPB (60): 576 - 591
Accepted: 21.09.2026 - Published 28.09.2026
An in Vitro Comparison of the Effects of Tetrabromobisphenol A and Tetrabromobisphenol S on Threshold-Like Hemolysis in Human Erythrocytes
Keywords
Abstract
Background/Aims: The use of tetrabromobisphenol A (TBBPA) as a brominated flame retardant has raised growing concerns of its potential toxicity due to its widespread use and persistence. The present study compares the threshold-like mechanism of hemolysis induced by TBBPA with that of its sulfone analog, tetrabromobisphenol S (TBBPS), using an in vitro model of human erythrocytes. Methods: Isolated red blood cells (5% hematocrit) obtained from healthy donors were exposed to TBBPA (10–50 µg/mL) or TBBPS (10–100 µg/mL) for 24 hours at 37°C. Hemolysis, methemoglobin formation, lipid peroxidation, glutathione levels, ATPase activity, membrane protein integrity, and interactions with human serum albumin were evaluated using spectrophotometric, fluorometric, flow cytometric, and electrophoretic (SDS-PAGE) analyses. Interactions of both compounds with human serum albumin (HSA) were investigated by fluorescence quenching and fluorescence lifetime measurements. Results: TBBPA induced a distinct threshold-like hemolytic response, with hemolysis increasing sharply above 12.5 µg/mL and reaching approximately 43.7% at 30 µg/mL, whereas TBBPS did not induce hemolysis within the tested concentration range. TBBPA-induced hemolysis was preceded by increased MetHb formation and accompanied by depletion of glutathione, impaired ATPase activity, and alterations in membrane proteins, including aggregation and loss of cytoskeletal components, but not by detectable lipid peroxidation. TBBPS produced substantially weaker effects on erythrocyte membrane integrity and antioxidant status. Fluorescence studies demonstrated that both TBBPs interacted with HSA, with predominantly static quenching accompanied by a contribution from dynamic quenching. The two compounds exhibited similar effects on HSA fluorescence under the experimental conditions used. Conclusion: TBBPA and TBBPS exhibit markedly different effects on erythrocytes despite their structural similarity, with TBBPA showing a distinct threshold-like hemolytic response associated with protein and antioxidant system damage rather than lipid peroxidation. The results suggest that differences in the chemical structure of TBBPs influence their interactions with proteins and may contribute to their distinct biological effects.
Introduction
The brominated flame retardant Tetrabromobisphenol A (TBBPA) is widely used in various materials such as plastics and electronic parts, where it is recognized for decreasing flammability and improving fire resistance [1]. It is also found in epoxy resins and polycarbonate materials used in inter alia electrical engineering, construction, mining, furniture, transportation, and the clothing industry [2]. The use of TBBPA raises environmental and health concerns due to its persistence and its potential to bioaccumulate, thanks to its hydrophobic nature. Studies also suggest that exposure to brominated flame retardants, including TBBPA, may have adverse effects, such as endocrine disruption and developmental and reproductive health problems [3, 4]. The European Chemicals Agency (ECHA) has classified TBBPA as a persistent, highly-toxic and carcinogenic substance, and as an endocrine disruptor, and has been included in the REACH classification (Registration, Evaluation, Authorization, Restriction of Chemicals). According to the 2020 Global Tetrabromobisphenol-A (TBBPA) Market Professional Survey Report [5], global production was dominated by the Middle East, the USA and China, with these regions producing 100, 82 and 60 thousand tonnes per year, respectively. The sulfone analogue of tetrabromobisphenolA, TBBPS, was later developed as a brominated flame retardant (BFR). Consequently, environmental TBBPs contamination has increased, with notable increases being recorded across various environmental systems. Research has indicated that TBBPS is lipophilic, allowing it to accumulate in the body, and prolonged contact could result in negative health impacts for organisms or people [6]. The structure of TBBPS resembles that of TBBPA, differing only in the bridging structure: while both have two 2,6-dibromophenol (2,6-DBP) units, TBBPA has an isopropyl chain but TBBPS has a sulfone group (Fig. 1) [7]. Barańska et al. (2022) report that TBBPS at a concentration of 5 µg/mL caused apoptosis in peripheral blood mononuclear cells. Also, treatment resulted in the relocation of phosphatidylserine to the outer layer of the cell membrane, elevation of cytosolic Ca2+ levels, reduction of mitochondrial membrane potential; this resulted in caspase-8, -9, and -3 activation, DNA fragmentation and chromatin condensation. It was also found that TBBPA elicited a stronger reaction than TBBPS [8]. In addition, in mice, treatment with TBBPS was found to induce thyroid dysfunction at a dose of 2 mg/kg body weight/day, and impair thyroid gland structure at 20 mg/kg body weight/day [9]. Therefore, there is a need to better determine the impact of TBBPS on the environment and human health. Exposure to TBBPA and other xenobiotic compounds can cause various forms of damage to erythrocytes, and directly contribute to their breakdown, i.e. hemolysis, where hemoglobin is released into the bloodstream. In a physiological situation, free hemoglobin forms a complex with the plasma protein haptoglobin, which is then removed by the liver. However, haptoglobin has a limited capacity and is rapidly depleted during massive hemolysis, leaving free hemoglobin in the blood. The presence of such large amounts of free hemoglobin has toxic effects, which can lead to kidney damage and nitric oxide (NO) binding, and thus vasoconstriction and hypertension [10]. Proper erythrocyte function relies on maintaining the integrity of the plasma membrane and its constituent proteins. One such protein is the band 3 protein, which serves as a component of the cytoskeletal complexes that connect it to the lipid bilayer. Any disruption of protein function increases the risk of membrane fragmentation, which in turn leads to hemolysis [11]. Exogenous compounds can induce increased production of reactive oxygen species (ROS). The resulting oxidative stress can affect erythrocyte membranes, causing lipid peroxidation and compromising their integrity [12]. After entering erythrocytes, ROS have a number of deleterious effects, including oxidizing iron II to III and contributing to the formation of methemoglobin, which is unable to bind oxygen; they also degrade proteins, lipids, and cytoplasmic components through oxidation [13]. Also, as glycolytic enzymes are highly sensitive to oxidation status, oxidative stress leads to a decrease in adenosine triphosphate (ATP) production by forcing ATP to decompose into phosphate compounds with lower energy levels [14]. In cells, the damage caused by oxidation to the proteins and lipids essential for proper functioning is countered by various enzymatic systems and antioxidant proteins that rapidly neutralize harmful oxidant molecules [13]. Such erythrocyte damage, and ultimately hemolysis, may arise through a range of mechanisms. However, while research has confirmed that TBBPA is toxic to red blood cells, the mechanism responsible for hemolysis remains unclear. The aim of the present study was therefore to determine the threshold-like concentration of TBBPA associated with the onset of erythrocyte breakdown, identify the cellular process primarily responsible for erythrocyte lysis, and compare these effects with those of TBBPS.
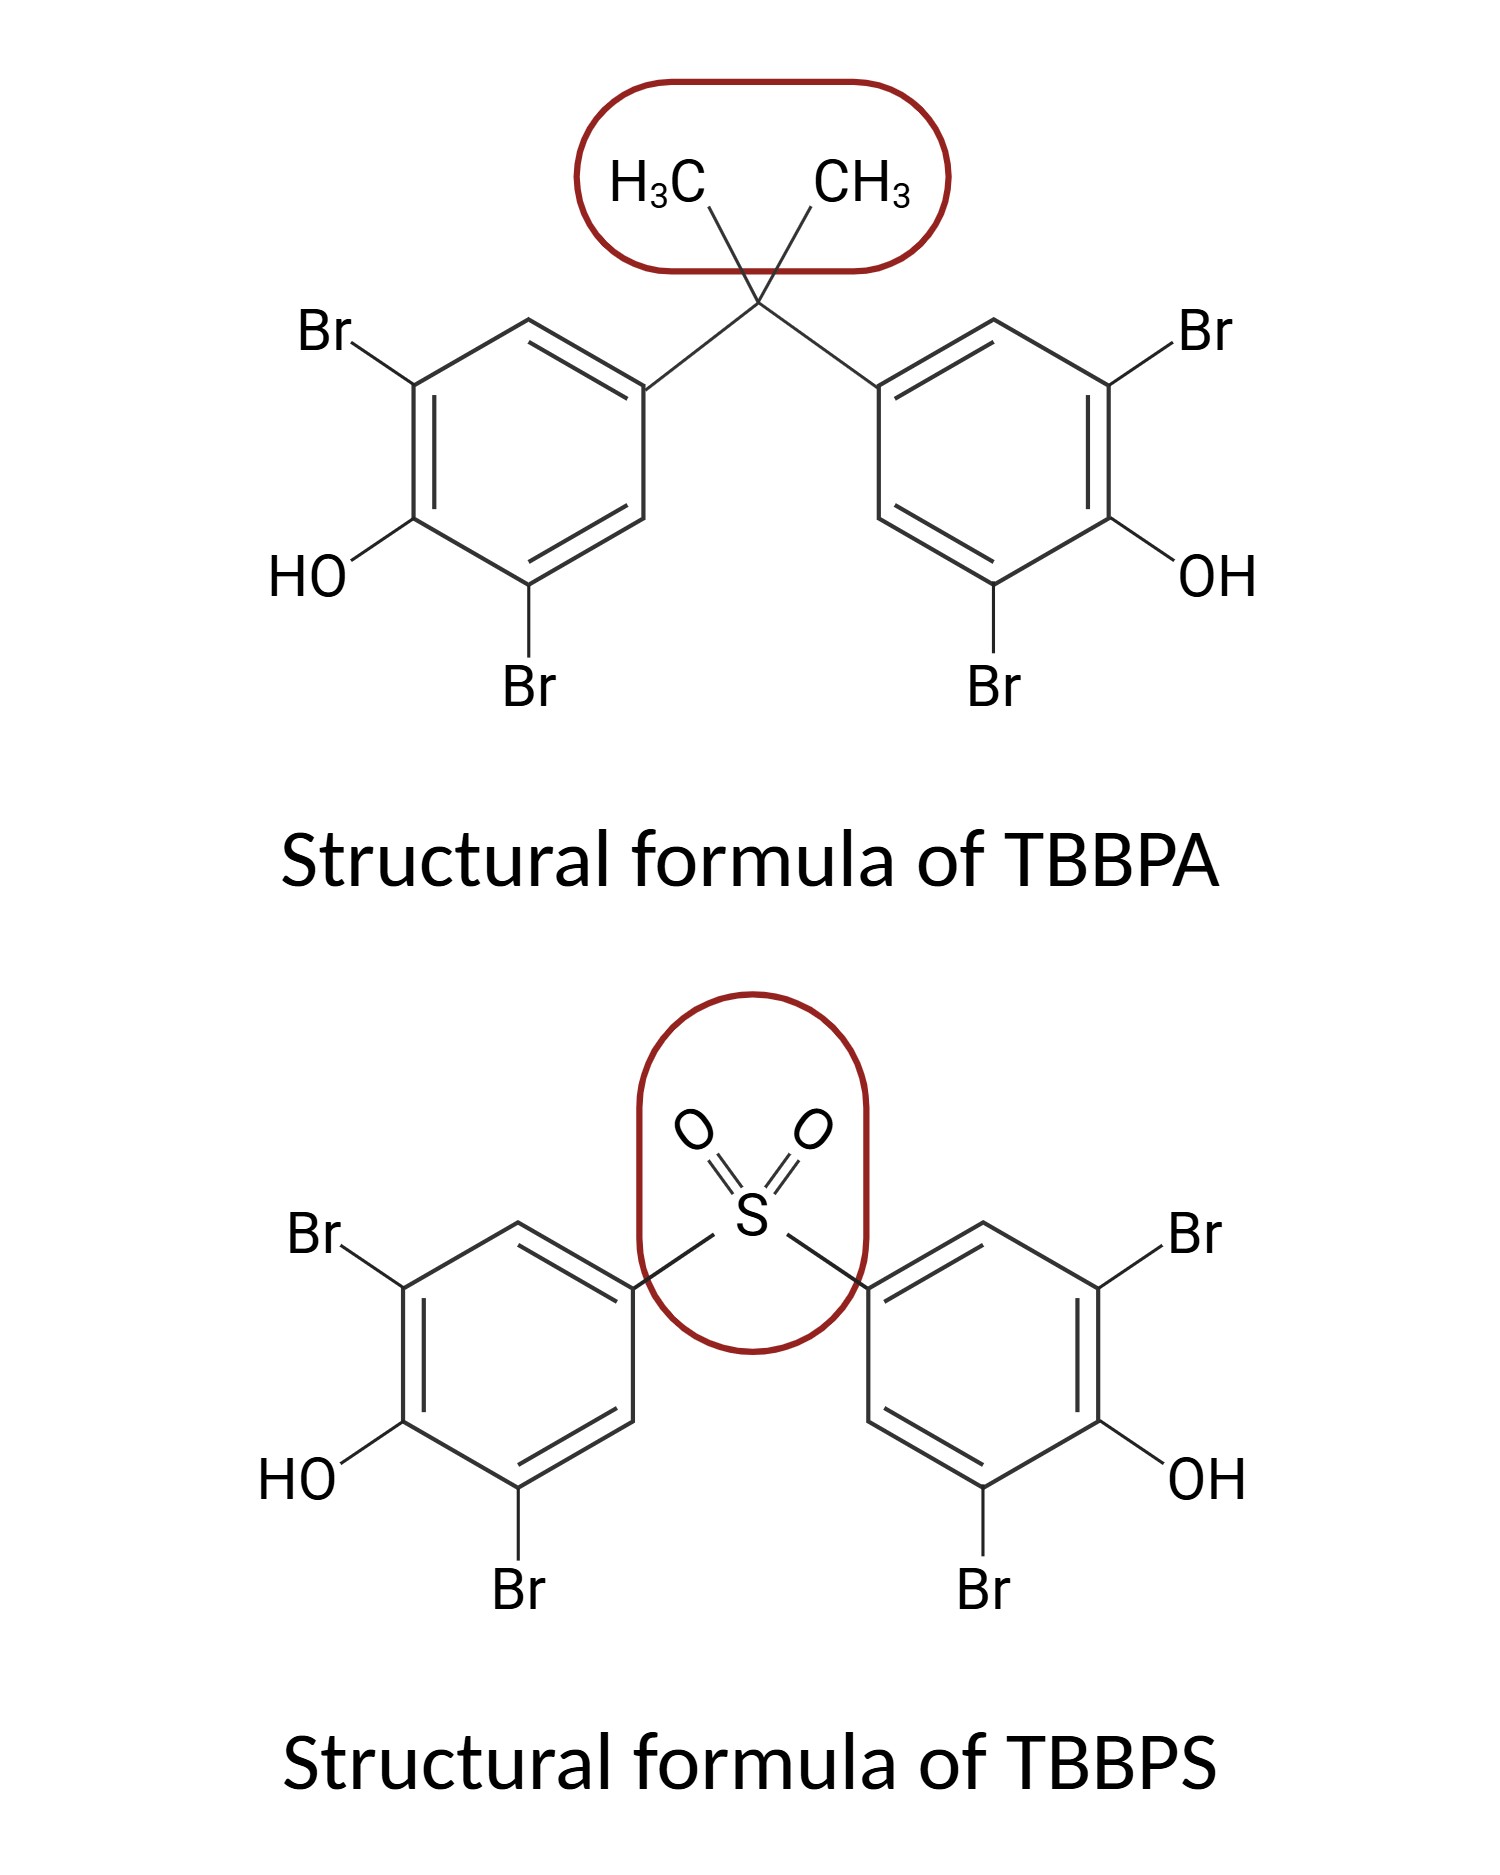
Fig. 1: The difference in the chemical structure of TBBPA and TBBPS
Materials and Methods
Chemicals
Tetrabromobisphenol A (4,4’-isopropylidenebis (2,6-dibromophenol), purity 97%, CAS 79-94-7) was obtained from Sigma-Aldrich (USA), Tetrabromobisphenol S (2,6-dibromo-4-(3,5-dibromo-4-hydroxyphenyl) sulfonylphenol, purity 98.8%, CAS 39635-79-5) was synthesized in the Institute of Industrial Organic Chemistry in Warsaw (Poland). The compounds were dissolved in dimethyl sulfoxide (DMSO, CAS 67-68-5), purchased from Avantor Performance Materials (Poland). Phosphate-buffered saline (PBS) (pH ~ 7.4) was prepared from ready-to-use tablets purchased from Sigma-Aldrich (USA). Potassium ferricyanide (CAS 13746-66-2) was obtained from POCH (Poland). The BODIPY™ 581/591 C11 (Invitrogen™) was purchased from Thermo Fisher Scientific (USA). The Protein Carbonyl Fluorometric Assay Kit (Cat. No. 701530) was obtained from Cayman Chemical (USA). Electrophoresis was performed using 7.5% precast polyacrylamide gel (8.6x6.7cm), 10x premixed electrophoresis buffer (contains 25 mM Tris, 192 mM glycine (CAS 56-40-6), 0.1% sodium dodecyl sulfate (SDS, CAS 151-21-3) pH 8.3) and premixed staining solution for polyacrylamide protein gels (Bio-Rad, USA). Dithiothreitol (DTT, CAS 3483-12-3) was obtained from Sigma-Aldrich (USA). The ATPase/GTPase Activity Assay Kit (Cat. No. MAK113), Glutathione Assay Kit (Cat. No. CS0260), and Human serum albumin (HSA, CAS 70024-90-7) were provided by Sigma-Aldrich (USA). Ethylenediaminetetraacetic acid (EDTA, CAS 60-00-4) and Luperox™ (tert-Butyl hydroperoxide solution, 70 wt. % in H2O, CAS 75-91-2) were obtained from Sigma-Aldrich (USA), and Phenylmethylsulphonyl fluoride (PMSF) from Thermo Fisher Scientific (USA).
Methods
Cell Isolation and Treatment. Human red blood cells were obtained from leucocyte-platelet buffy coats purchased from the Regional Centre for Blood Donation and Treatment (RCBDT) in Lodz, Poland (accredited by the Minister of Health, No. BA/2/2004). Venous blood samples were drawn from volunteers aged between 18 and 55 years (healthy, non-smoking). Buffy coats were collected and stored using CPD (Citrate Phosphate Dextrose) anticoagulant, according to the standard collection protocol used at the Regional Blood Donation and Blood Treatment Center in Lodz. The buffy coat was centrifuged (600 × g, 10 min, 20°C) to separate erythrocytes from plasma, platelets, and leucocytes. The isolated red blood cells were washed three times with PBS by centrifugation (600 × g, 10 min, 20°C). The erythrocytes were centrifuged for 3 min in a microhematocrit centrifuge to determine hematocrit. The erythrocyte suspensions in PBS with 5% hematocrit were treated with TBBPA (10–50 µg/mL) or TBBPS (10–100 µg/mL) and incubated for 24 hours at 37°C, in total darkness. A preparation with a hematocrit of 5% contains approximately 5 × 10⁸ erythrocytes/mL, i.e., 500 million cells per mL of suspension [15]. The control samples were incubated with the same concentration of DMSO solvent used in the TBBPA and TBBPS samples (0.4%). In the studies, the erythrocytes were incubated in PBS buffer to test how they would cope with exposure to a dangerous xenobiotic, TBBPA, under conditions of nutrient deficiency.
Preparation of Erythrocyte Membranes. The erythrocytes were incubated with the test compounds, following which, their membranes were isolated by hemolysis. The procedure was conducted at 4°C using 20 volumes of 20 mM Tris-HCl buffer (pH 7.4) with 1 mM EDTA and 0.5 mM PMSF to prevent protease activity. The free erythrocyte membranes were washed in ice-cold Tris-HCl buffer (pH 7.4) at 20 mM, 10 mM, and then 5 mM, until a cream-colored precipitate was obtained. After each wash, the samples were centrifuged (12 000 × g, 10 min, 4°C). The protein concentration in the membrane preparations was determined according to [16]. The erythrocyte membranes were stored at –80 °C.
Determination of Hemolysis. The degree of hemolysis in culture was determined based on the amount of hemoglobin (Hb) released. Briefly, after incubation, the cell suspension was centrifuged, the supernatant was collected, and the pellet was hemolyzed with the same amount of distilled water and centrifuged. All procedures were performed at 4°C using ice-cold distilled water. The hemoglobin contents of the supernatant and the solution were determined spectrophotometrically based on absorbance at λ = 542 nm after erythrocyte pellet hemolysis. The hemolysis ratio was determined using the formula:
H% = × 100%
where: H% is the percentage of hemolysis of the erythrocytes, A1 is the absorbance of Hb in the supernatant of the samples, and A2 is the absorbance of the solution after complete hemolysis with distilled water (100%).
Determination of MetHb. After incubation, the erythrocyte pellet was hemolyzed with deionized water and centrifuged (12 000 × g, 10 min, 4°C). The absorbance of the solutions was measured at 630 nm and 690 nm. Then, potassium ferricyanide solution (1 M Hb Fe2+: 3 M K3[Fe(CN)6]) was added to the erythrocyte suspension to oxidize hemoglobin to MetHb. The absorbance of the samples was again measured at the same wavelengths. The percentage of MetHb in erythrocytes was determined using the equation:
MetHb% = × 100%
where: MetHb% is the percent of MetHb, A1 is the absorbance of sample before oxidation to the MetHb form at λ = 630 nm, A2 is the absorbance of sample before oxidation to MetHb at λ = 690 nm, A3 is the absorbance of the sample after complete conversion of Hb to MetHb at λ = 630 nm, A4 is the absorbance of the sample after complete conversion to MetHb at λ = 690 nm.
Degree of Lipid Peroxidation. The red blood cells were treated with TBBPA (10–30 µg/mL) or TBBPS (10–100 µg/mL). After 24-hour incubation at 37°C, a fluorescent marker (BODIPY™ 581/591 C11) was added, and the cells were incubated for another hour. After this time, the samples were centrifuged (600 × g, 10 min, room temperature) and suspended in PBS to obtain a hematocrit of 2.5%. The positive control consisted of erythrocytes with the addition of Luperox™ at a concentration of 350 µM or 700 µM. The fluorescence of the samples was analyzed with an LSR II flow cytometer (Becton-Dickinson): excitation/emission maxima: 488/510 nm for BODIPY™. An FCM gate was established on the red blood cells for data acquisition, and the data were recorded for 50 000 cells per sample. Lipid peroxidation levels were expressed in arbitrary units, with the negative control value being 1.00.
Polyacrylamide Gel Electrophoresis (SDS-PAGE). The samples containing the obtained erythrocyte membranes were first solubilized in 0.5 M Tris–HCl buffer (pH 6.8), 5% SDS, 60% glycerol (CAS 56-81-5), 0.05% bromophenol blue (CAS 115-39-9), with or without 0.5 M dithiothreitol (DTT), at a sample to solution ratio of 1:3. The resulting mixtures were then incubated for 15 minutes in a hot water bath at 95°C. The electrophoresis apparatus was prepared with ready-to-use 7.5% precast polyacrylamide gel plates, and the samples were applied in a volume of 10 µl per well. Electrophoresis was carried out in Tris–HCl buffer (25 mM Tris, 192 mM glycine, 0.1% SDS; pH 8.3), which was diluted 10-fold. Electrophoresis was performed using a Bio-Rad system with a current of 20 mA. The gels were then stained with Bio-Safe™ Coomassie Stain (Bio-Rad) to visualize the protein bands. Finally, the gels were digitized and analyzed qualitatively.
Membrane Protein Oxidation Level. The intact erythrocytes were incubated with TBBPA or TBBPS for 24 hours. Following this, the erythrocyte membranes were isolated and their protein carbonyl content was determined using the Protein Carbonyl Fluorometric Assay Kit (Cayman Chemical). The test was performed according to the manufacturer’s protocol. Fluorescence was measured at an excitation wavelength of 560 nm and an emission wavelength between 585–595 nm using a Cary Eclipse spectrofluorometer.
Glutathione Level. Glutathione (GSH) levels were determined using the Glutathione Assay Kit (Sigma-Aldrich) in accordance with the manufacturer's guidelines. After incubation with TBBPA or TBBPS, the erythrocytes were centrifuged (600 × g, 10 min, room temperature) and then washed three times with PBS. Following this, 200 µl of the red blood cell pellet was mixed with 400 µl of 5% 5-sulfosalicylic acid solution. The samples were vortexed and left for 10 minutes at 4°C. They were then centrifuged (10 000 × g, 10 min, 4°C), and the glutathione content of the resulting supernatant was determined according to the manufacturer’s protocol. Kinetic absorbance measurements were performed at a wavelength of 412 nm for five minutes using a BioTek PowerWaveXS microplate reader.
ATPase Activity. The ATPase activity of the obtained erythrocyte membranes was determined using the ATPase/GTPase Activity Assay Kit (Sigma-Aldrich) according to the manufacturer’s protocol. The assay was performed both with and without ouabain, a blocker of Na+,K+-ATPase activity. The result was obtained by reading the optical density (OD) at λ = 620 nm (PowerWaveXS microplate reader, BioTek). The ATPase/GTPase Activity Assay Kit is a non-selective colorimetric assay that quantifies total inorganic phosphate released by ATP hydrolysis via any membrane-bound ATPase present in the sample. Parallel measurements performed with and without ouabain, a specific inhibitor of sodium-potassium ATPase (Na+,K+-ATPase), were used to distinguish the ouabain-sensitive (Na+,K+-ATPase) fraction from total ATPase activity, the latter additionally reflecting Ca2+- and Mg2+-dependent ATPases.
Spectroscopic Measurements. The fluorescence intensity and fluorescence lifetime changes were assessed in PBS solutions at 25°C during the experiments. The final HSA concentration in the samples was 2 mM. Fluorescence emission spectra were recorded using a Varian Cary Eclipse Fluorescence Spectrophotometer (Agilent Technologies, Santa Clara, USA). All tests were performed in a cuvette with a 10 mm optical path length, adjusted for inner-filter effect Type I due to TBBPA, TBBPS, and protein absorption of the excitation light [17]. No Type II inner filter effect was noted. Fluorescence emission decay was determined using a PicoQuant FluoTime 300 spectrometer equipped with an R3809U-50 microchannel plate photomultiplier (MCP-PMT) and a TimeHarp 260 PICO TCSPC module. The excitation sources were the SuperK EXTREME EXR-20 with a Super EXTEND-UV unit (Deep UV model, tuning range 265-345 nm), obtained from NKT Photonics. The excitation wavelength was set at 280 nm and observation wavelength at 330 nm. The instrument response function (IRF) was recorded with Ludox showing full width at half maximum (FWHM) around 72 ps. The data were analyzed with EasyTau version 2 software (PicoQuant, Germany).
Statistical Analysis. The results are reported as means ± standard deviation. The number of observations (n) denotes the number of trials (such as individual blood donors). For each donor, cells obtained from a single blood sample were divided into an untreated control aliquot, a vehicle (DMSO) control aliquot, and aliquots treated with different concentrations of TBBPA or TBBPS. For all photometric and fluorometric assays, a corresponding blank (plate blank and/or reagent/buffer blank, as specified for each method above) was included in every run, and its value was subtracted from the sample reading prior to calculation. The normality of the data was assessed using the Shapiro-Wilk test. Variables were evaluated using a mixed-effects model (restricted maximum likelihood, REML) or one-way repeated-measures ANOVA. The Geisser–Greenhouse correction was applied when the assumption of sphericity was violated. Dunnett's multiple comparisons test was used post hoc to compare each treatment concentration with the untreated control. Findings with a p-value below 0.05 were deemed to be statistically significant. Statistical analyses were performed using GraphPad Prism (version 8.4.3) software from Dotmatics, USA.
Results
The percentage hemolysis measured in TBBPA- or TBBPS-treated cells after 24-hour incubation is shown in Fig. 2. For TBBPA, the intensity of hemolysis was found to be significantly higher than controls from a concentration of 12.5 µg/mL; at 30 µg/mL, erythrocyte disintegration was almost 50% (43.67% ± 5.77%). However, in the case of TBBPS, no significant changes were observed. In the TBBPA samples, hemolysis was preceded by an increase in MetHb level compared to controls, with the significant increases observed from a concentration of 10 µg/mL. In contrast, the TBBPS samples did not show a statistically significant increase in MetHb level at any of the tested concentrations, including the highest concentration used (100 µg/mL), consistent with the absence of a significant increase in hemolysis across the tested TBBPS concentration range. The results for MetHb level are presented in Fig. 3. The degree of lipid peroxidation, assessed with the BODIPY™ 581/591 C11 fluorescent label, is given in Table 1[A1] . No significant changes in lipid peroxidation were observed in the treated erythrocytes. However, a considerable increase in fluorescence intensity was noted in the positive control, treated with Luperox™, indicating a strong degree of lipid peroxidation. In the SDS-PAGE images, bands 3 (red arrows), 4.1, 4.2 (green arrows), and actin (blue arrow) were absent or very faint, at the highest TBBPA concentration (50 µg/mL). A diffuse band of aggregates can be seen above the spectrin bands (Fig. 4). The α- and β-spectrin bands were attenuated, and these bands appeared as a single narrower band with changed intensity (black arrows). Identical band patterns were noted in samples exposed to both reducing (with DTT) and non-reducing (without DTT) conditions, indicating the proteins aggregated predominantly by covalent bonds and not by disulfide bridges. Protein oxidation resulted in the formation of carbonyl groups, which subsequently reacted with rhodamine B hydrazide (RBH) to form fluorescent carbonyl-RBH hydrazones. The samples incubated with TBBPA at a concentration of 20 µg/mL demonstrated significantly lower levels of oxidized membrane proteins (2.31 ± 0.23) compared to controls (4.71 ± 1.65) (Fig. 5). No significant differences compared to controls were observed for TBBPS. In the TBBPA samples, a rapid decrease in glutathione levels was observed as the concentrations increased. For the highest concentration of TBBPA (50 μg/mL), the glutathione level was below 4% of control values. For TBBPS, this effect was not observed, even at the highest concentration used (Fig. 6[AK2] ). As GSH levels were calculated based on measured values with standard deviation, the maximum error was calculated using the total differential method. In cells treated with TBBPA, Na+,K+-ATPase activity was significantly reduced at 15 µg/mL and 20 µg/mL compared with the untreated control. Total ATPase activity, reflecting the combined contribution of sodium-potassium, calcium, and magnesium ATPases, was significantly decreased at 20 µg/mL TBBPA. No significant changes in either Na+,K+-ATPase or total ATPase activity were observed for TBBPS at any of the tested concentrations (Fig. 7). The samples were subjected to fluorescence quenching measurements to determine the interactions of tetrabromobisphenol A (TBBPA) and tetrabromobisphenol S (TBBPS) with human serum albumin (HSA). Briefly, HSA was excited at 280 nm, selectively exciting aromatic amino acid residues, viz. tyrosine and tryptophan, and the emission spectrum was recorded in the range of 290 - 500 nm. Gradual addition of TBBPA or TBBPS resulted in a concentration-dependent decrease in HSA fluorescence intensity, indicating direct ligand–protein interactions. Both the fluorescence intensity and fluorescence lifetime quenching data were used to determine the Stern–Volmer quenching constants (KSV) using the Stern–Volmer equation [18]. The classical Stern−Volmer equation relates the drop in fluorescence to the concentration of a quencher, as:
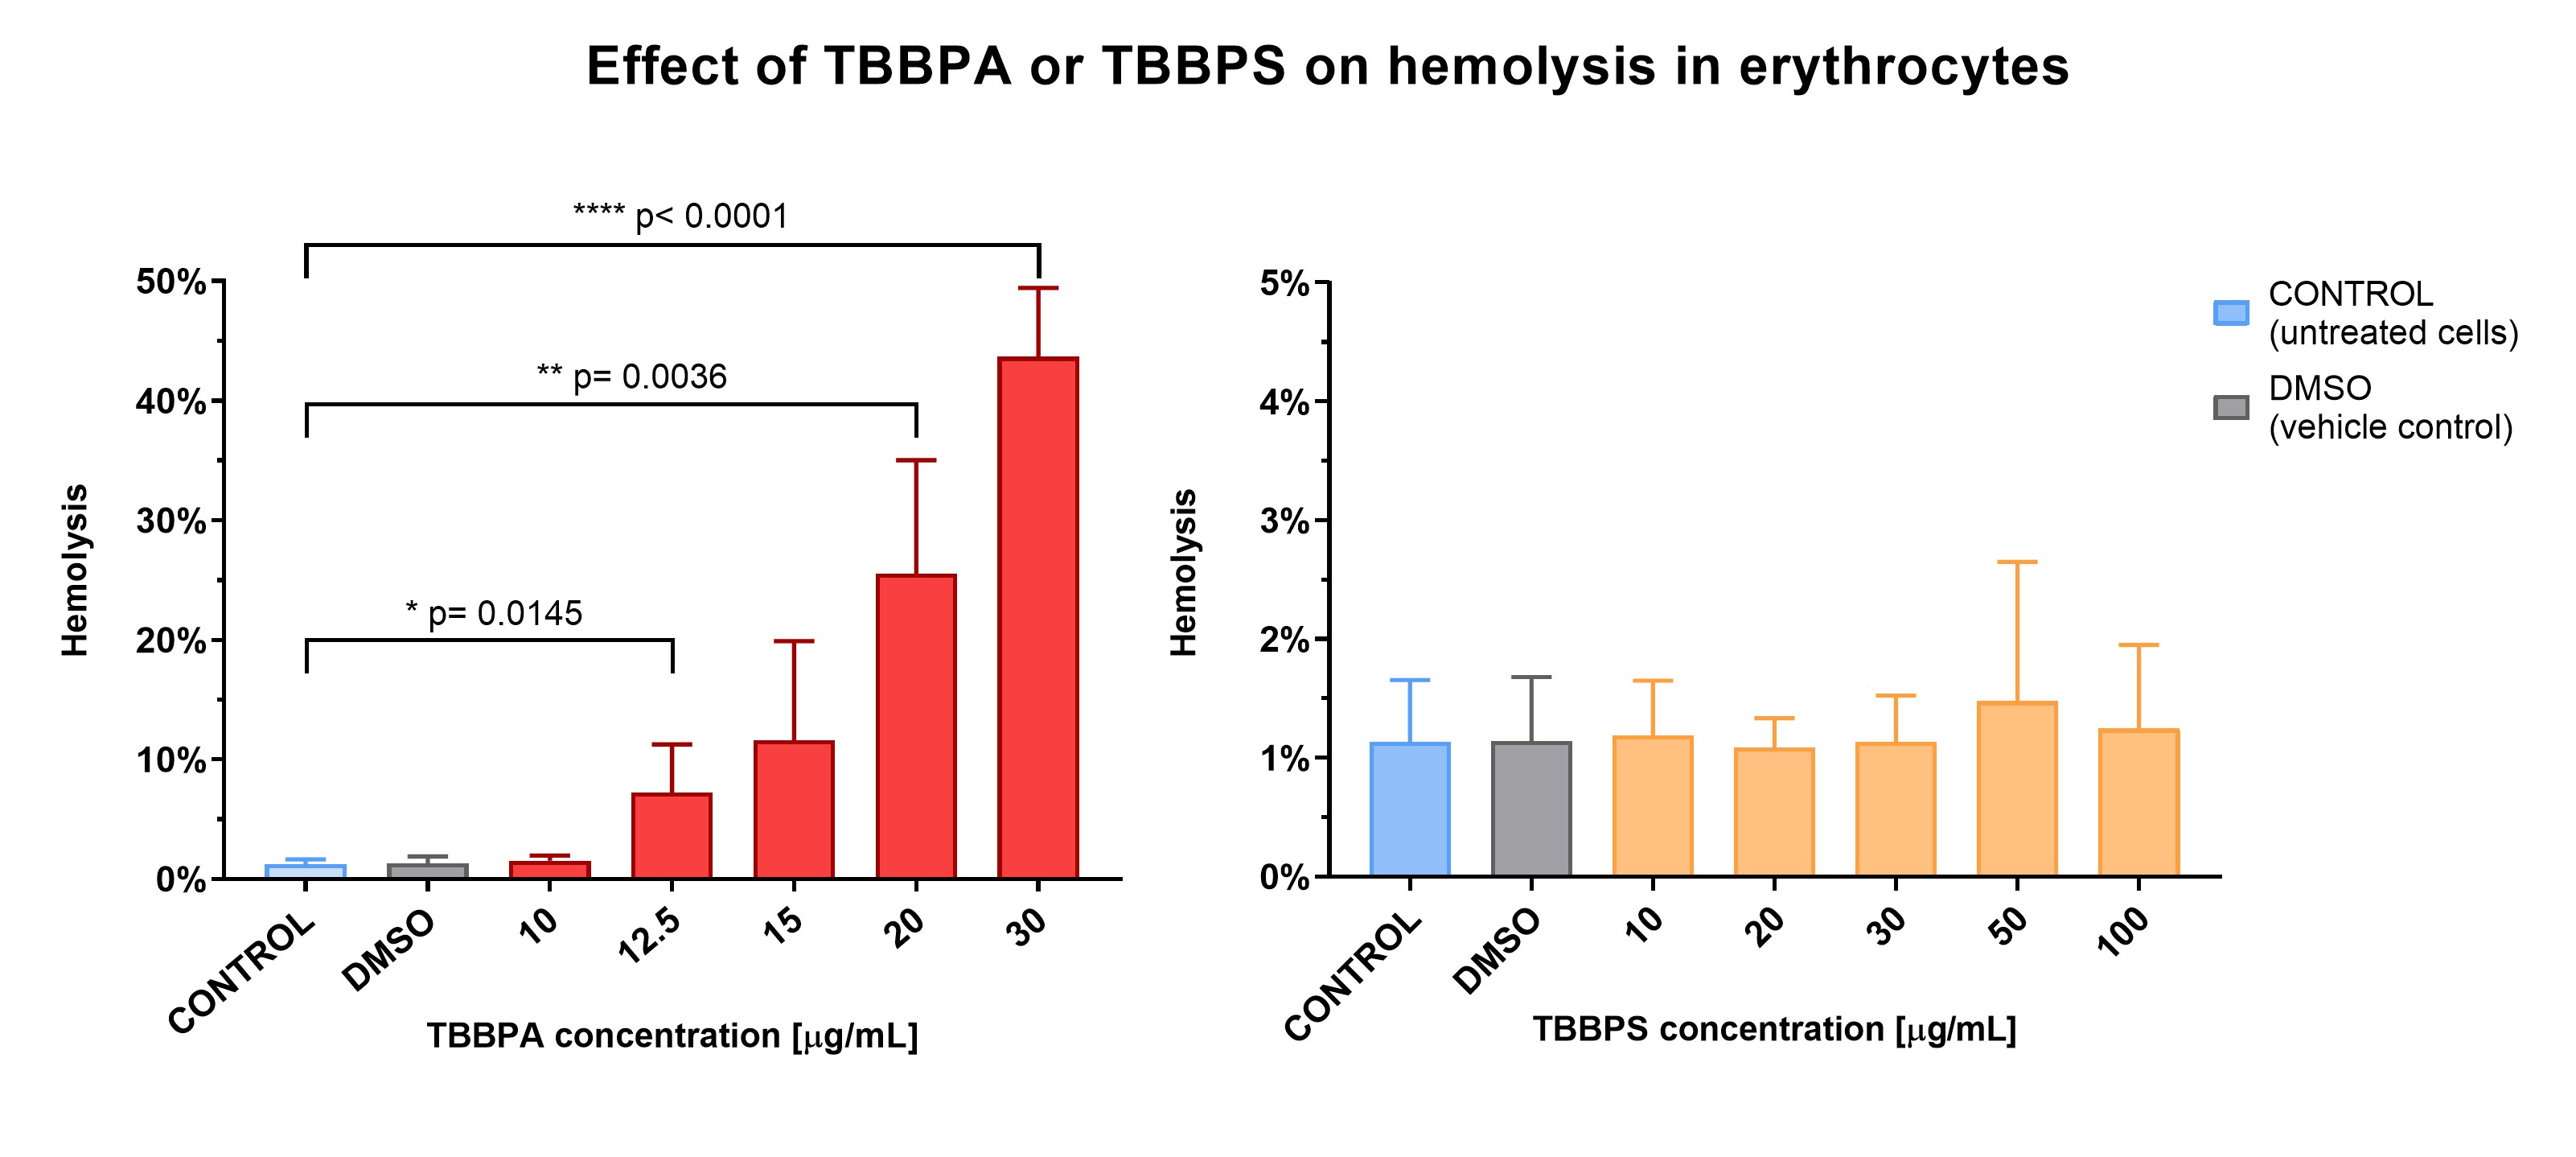
Fig. 2: Hemolysis of erythrocytes incubated with TBBPA (10–30 µg/mL) or TBBPS (10–100 µg/mL) for 24 h. Data are presented as mean ± SD, n = 6–9 for TBBPA and n = 4 for TBBPS. Significantly different from control: *p<0.05, **p<0.01, ****p<0.0001. Mixed-effects model (REML) for TBBPA or one-way repeated-measures ANOVA for TBBPS with Geisser–Greenhouse correction and Dunnett's multiple comparisons test.
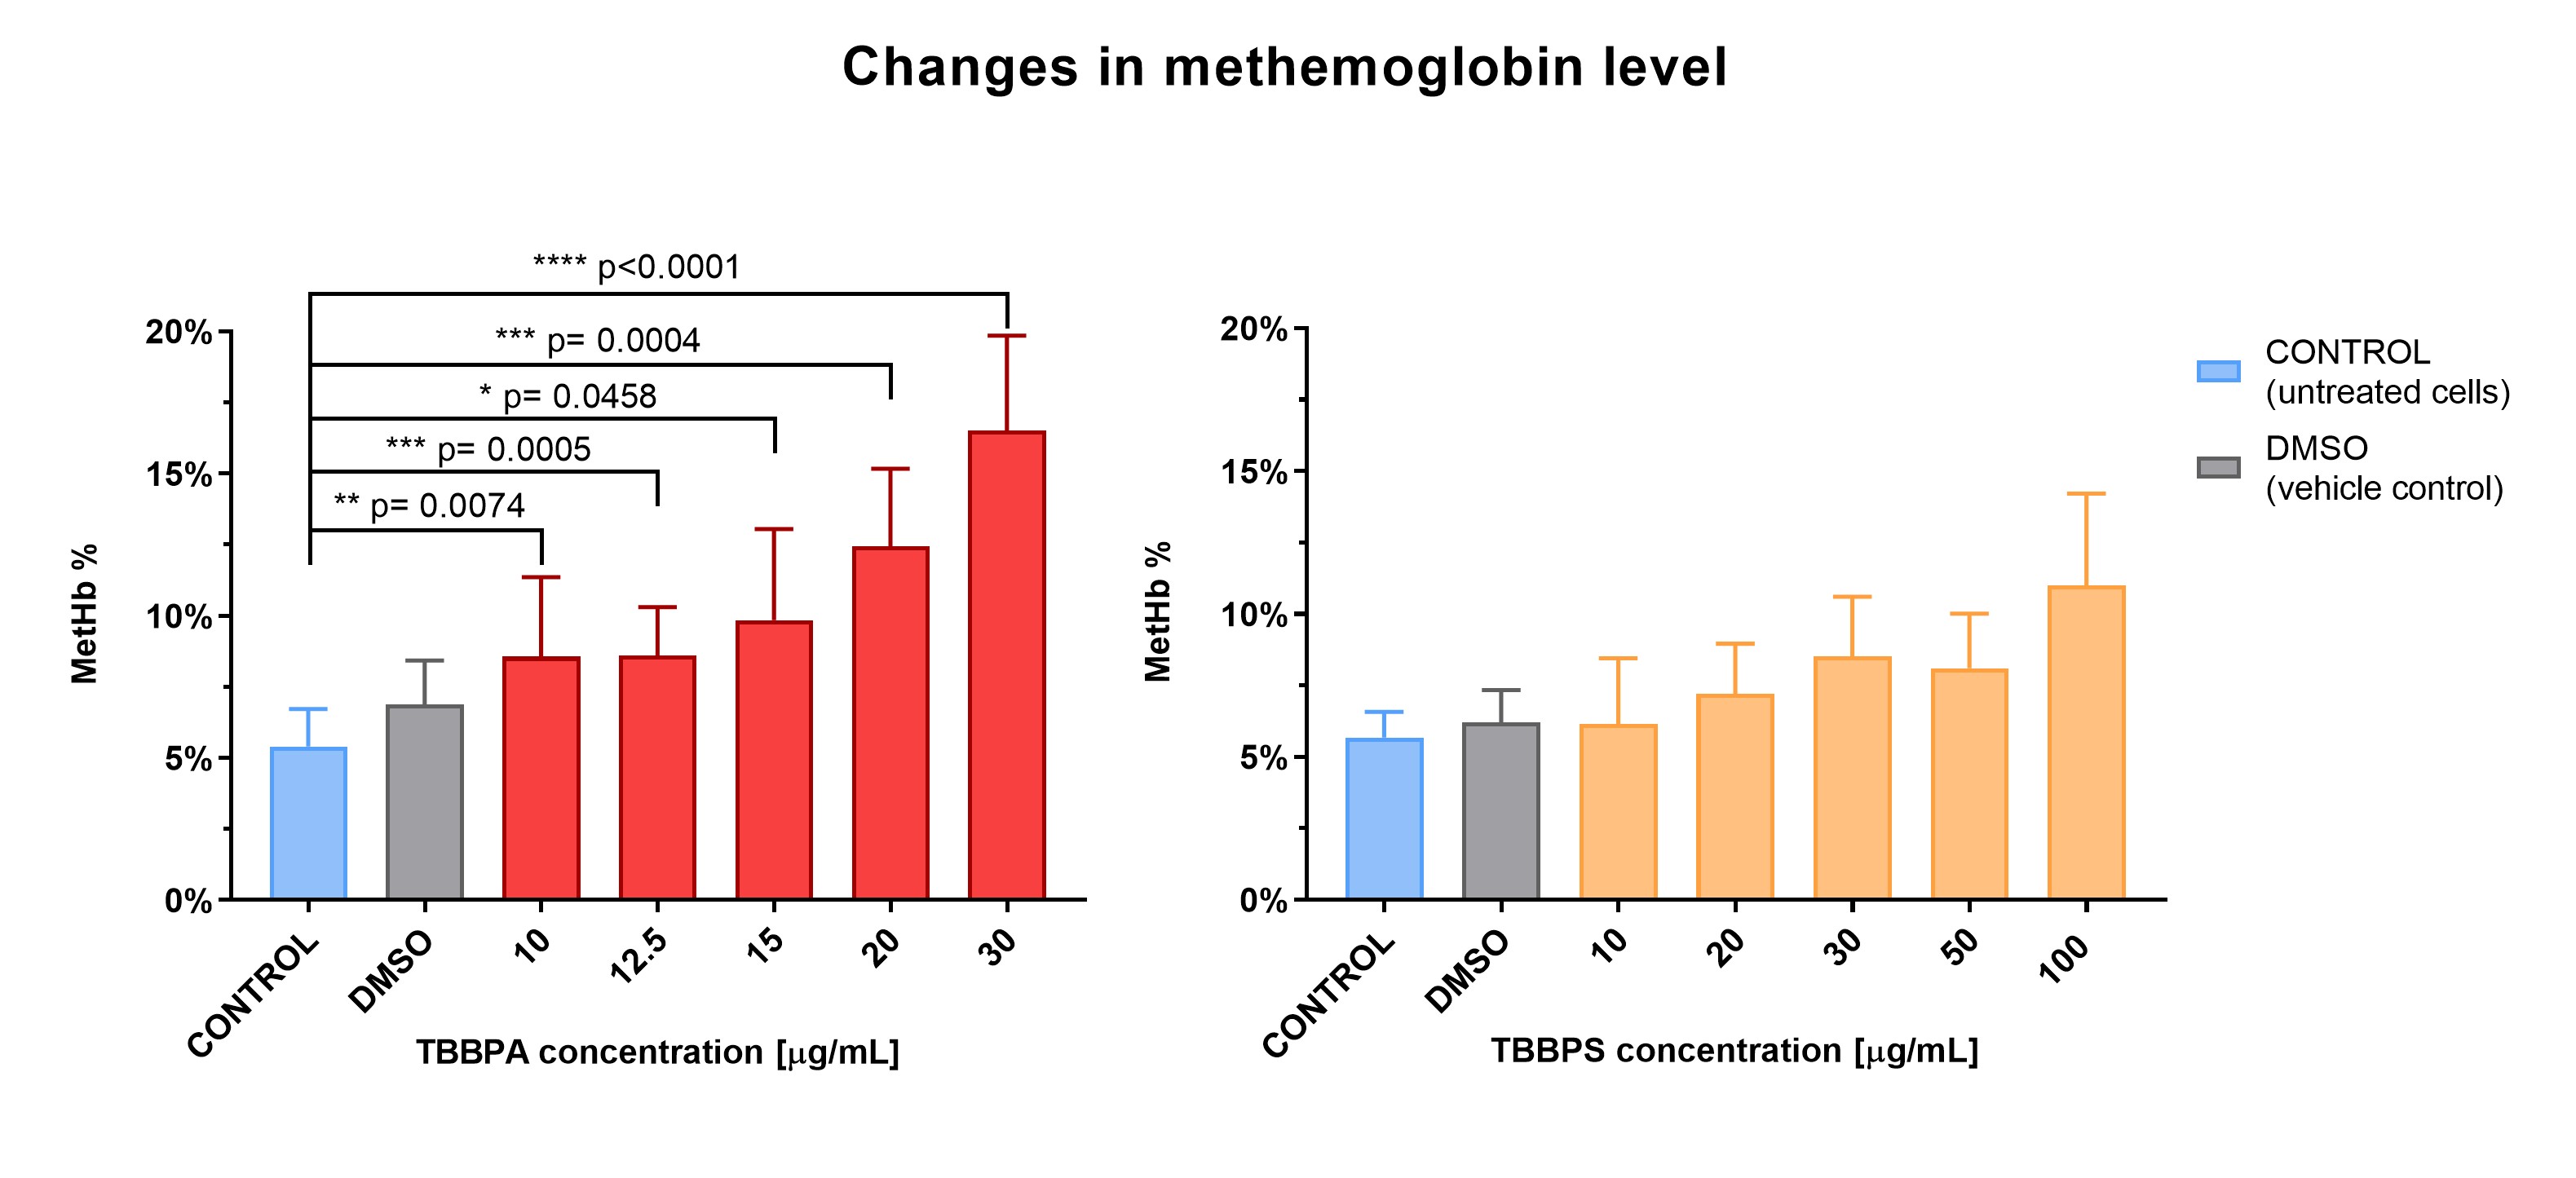
Fig. 3: Changes in methemoglobin levels in control erythrocytes and erythrocytes incubated with TBBPA (10–30 µg/mL) or TBBPS (10–100 µg/mL) after 24 h of incubation. Results are given as mean ± SD, n = 6–10 for TBBPA and n = 4 for TBBPS. Significantly different from the control: *p<0.05, **p<0.01, ***p<0.001, ****p<0.0001. Mixed-effects model (REML) for TBBPA or one-way repeated-measures ANOVA for TBBPS with Geisser–Greenhouse correction and Dunnett's multiple comparisons test.
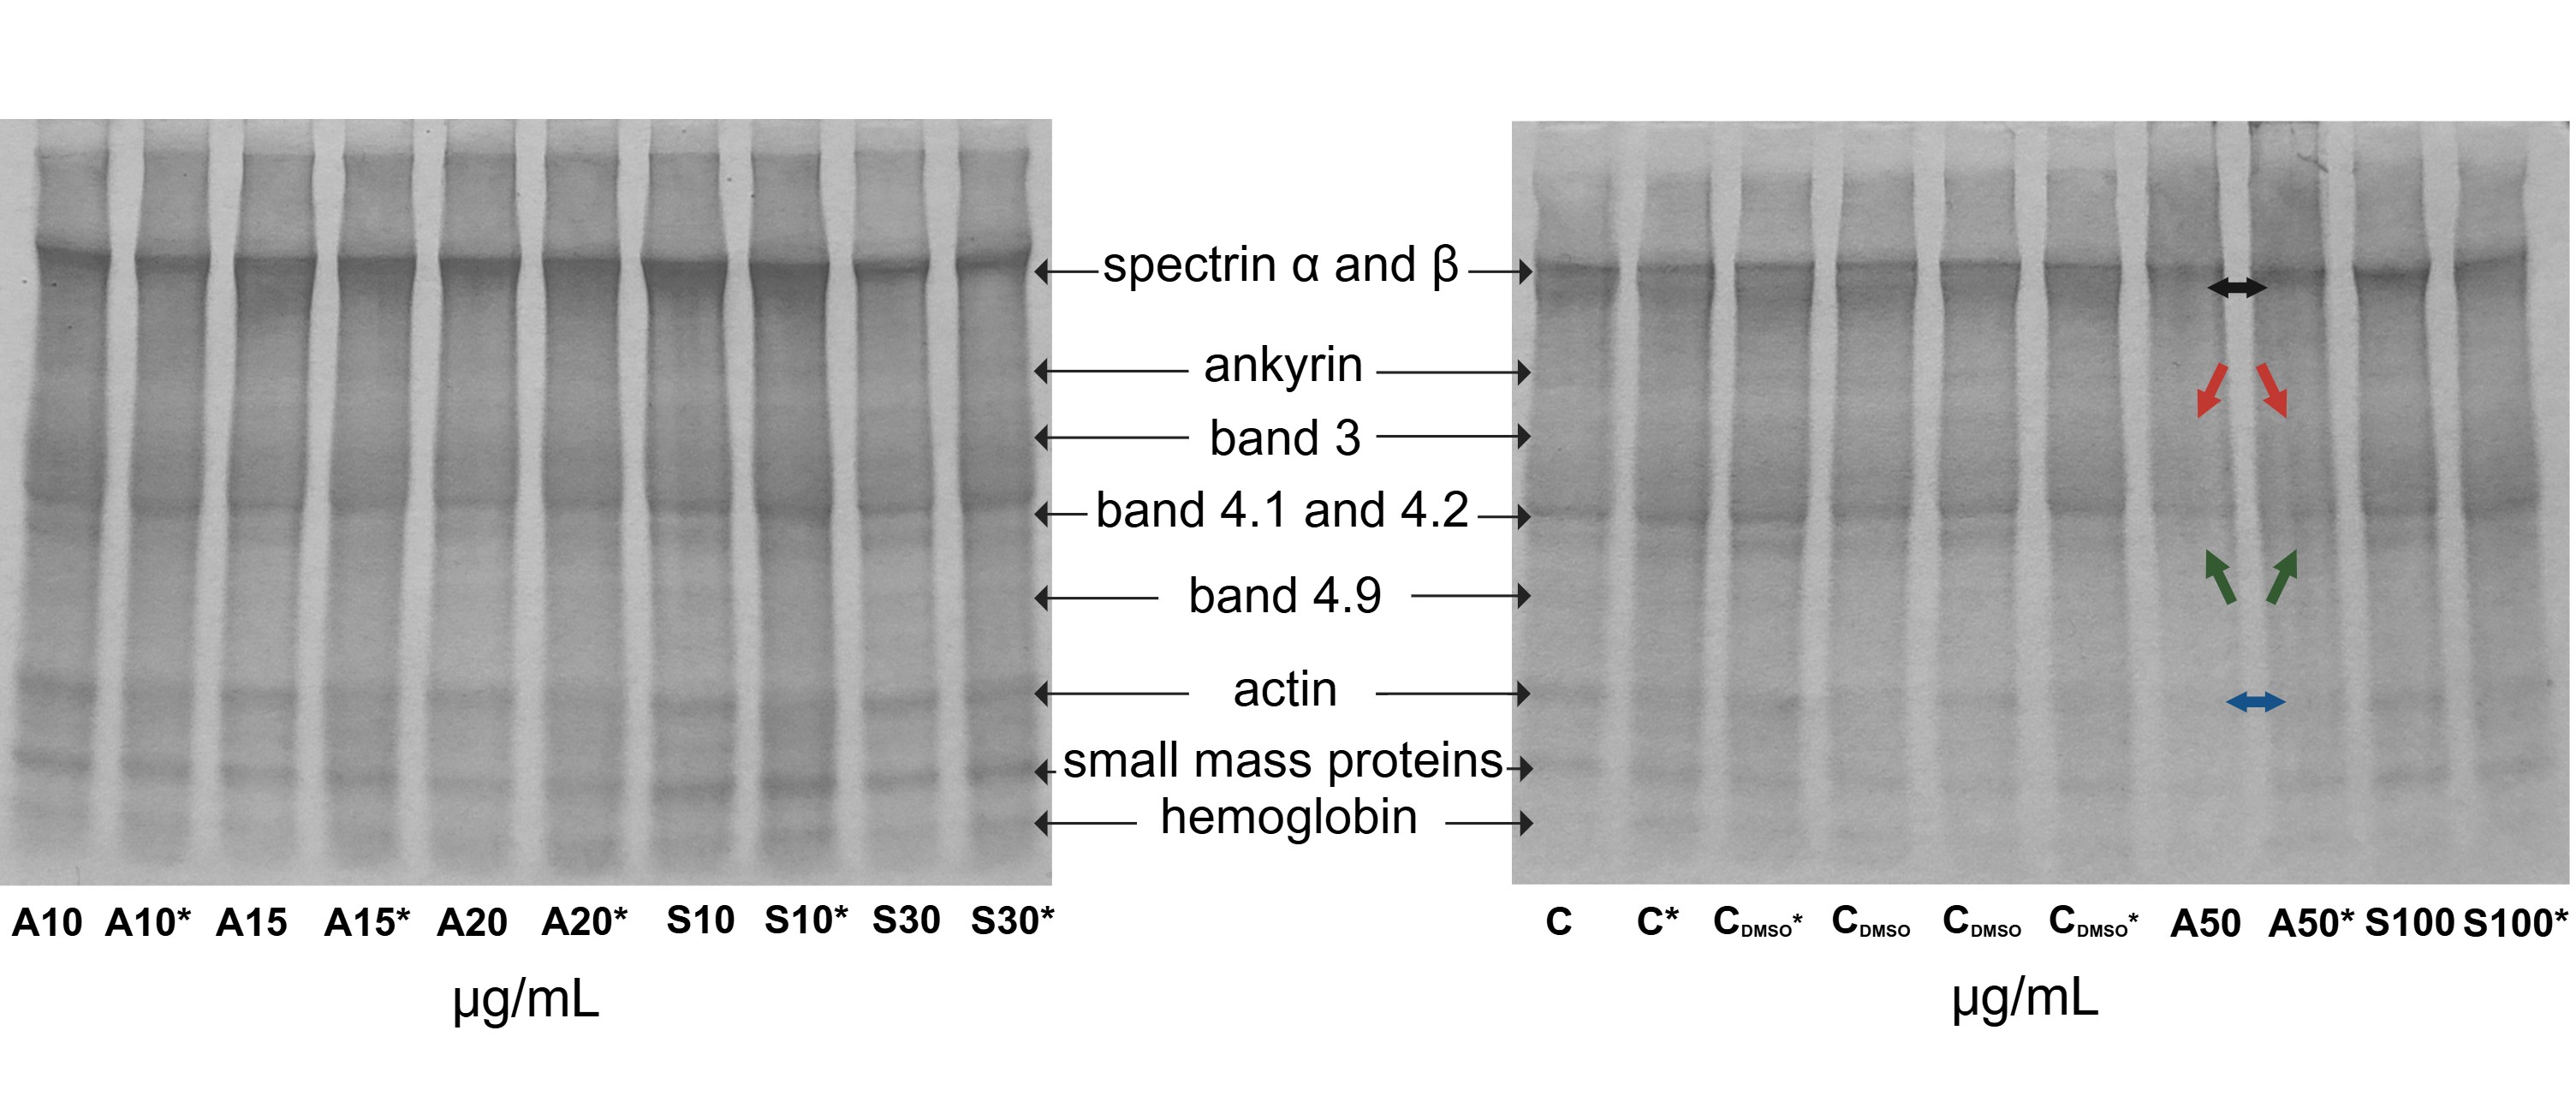
Fig. 4: SDS-PAGE of proteins of erythrocyte membranes incubated with TBBPA or TBBPS (24 h at 37 °C) under non-reductive or reductive conditions (DTT at 0.5 M). The asterisk indicates samples treated with the reducing agent (DTT).
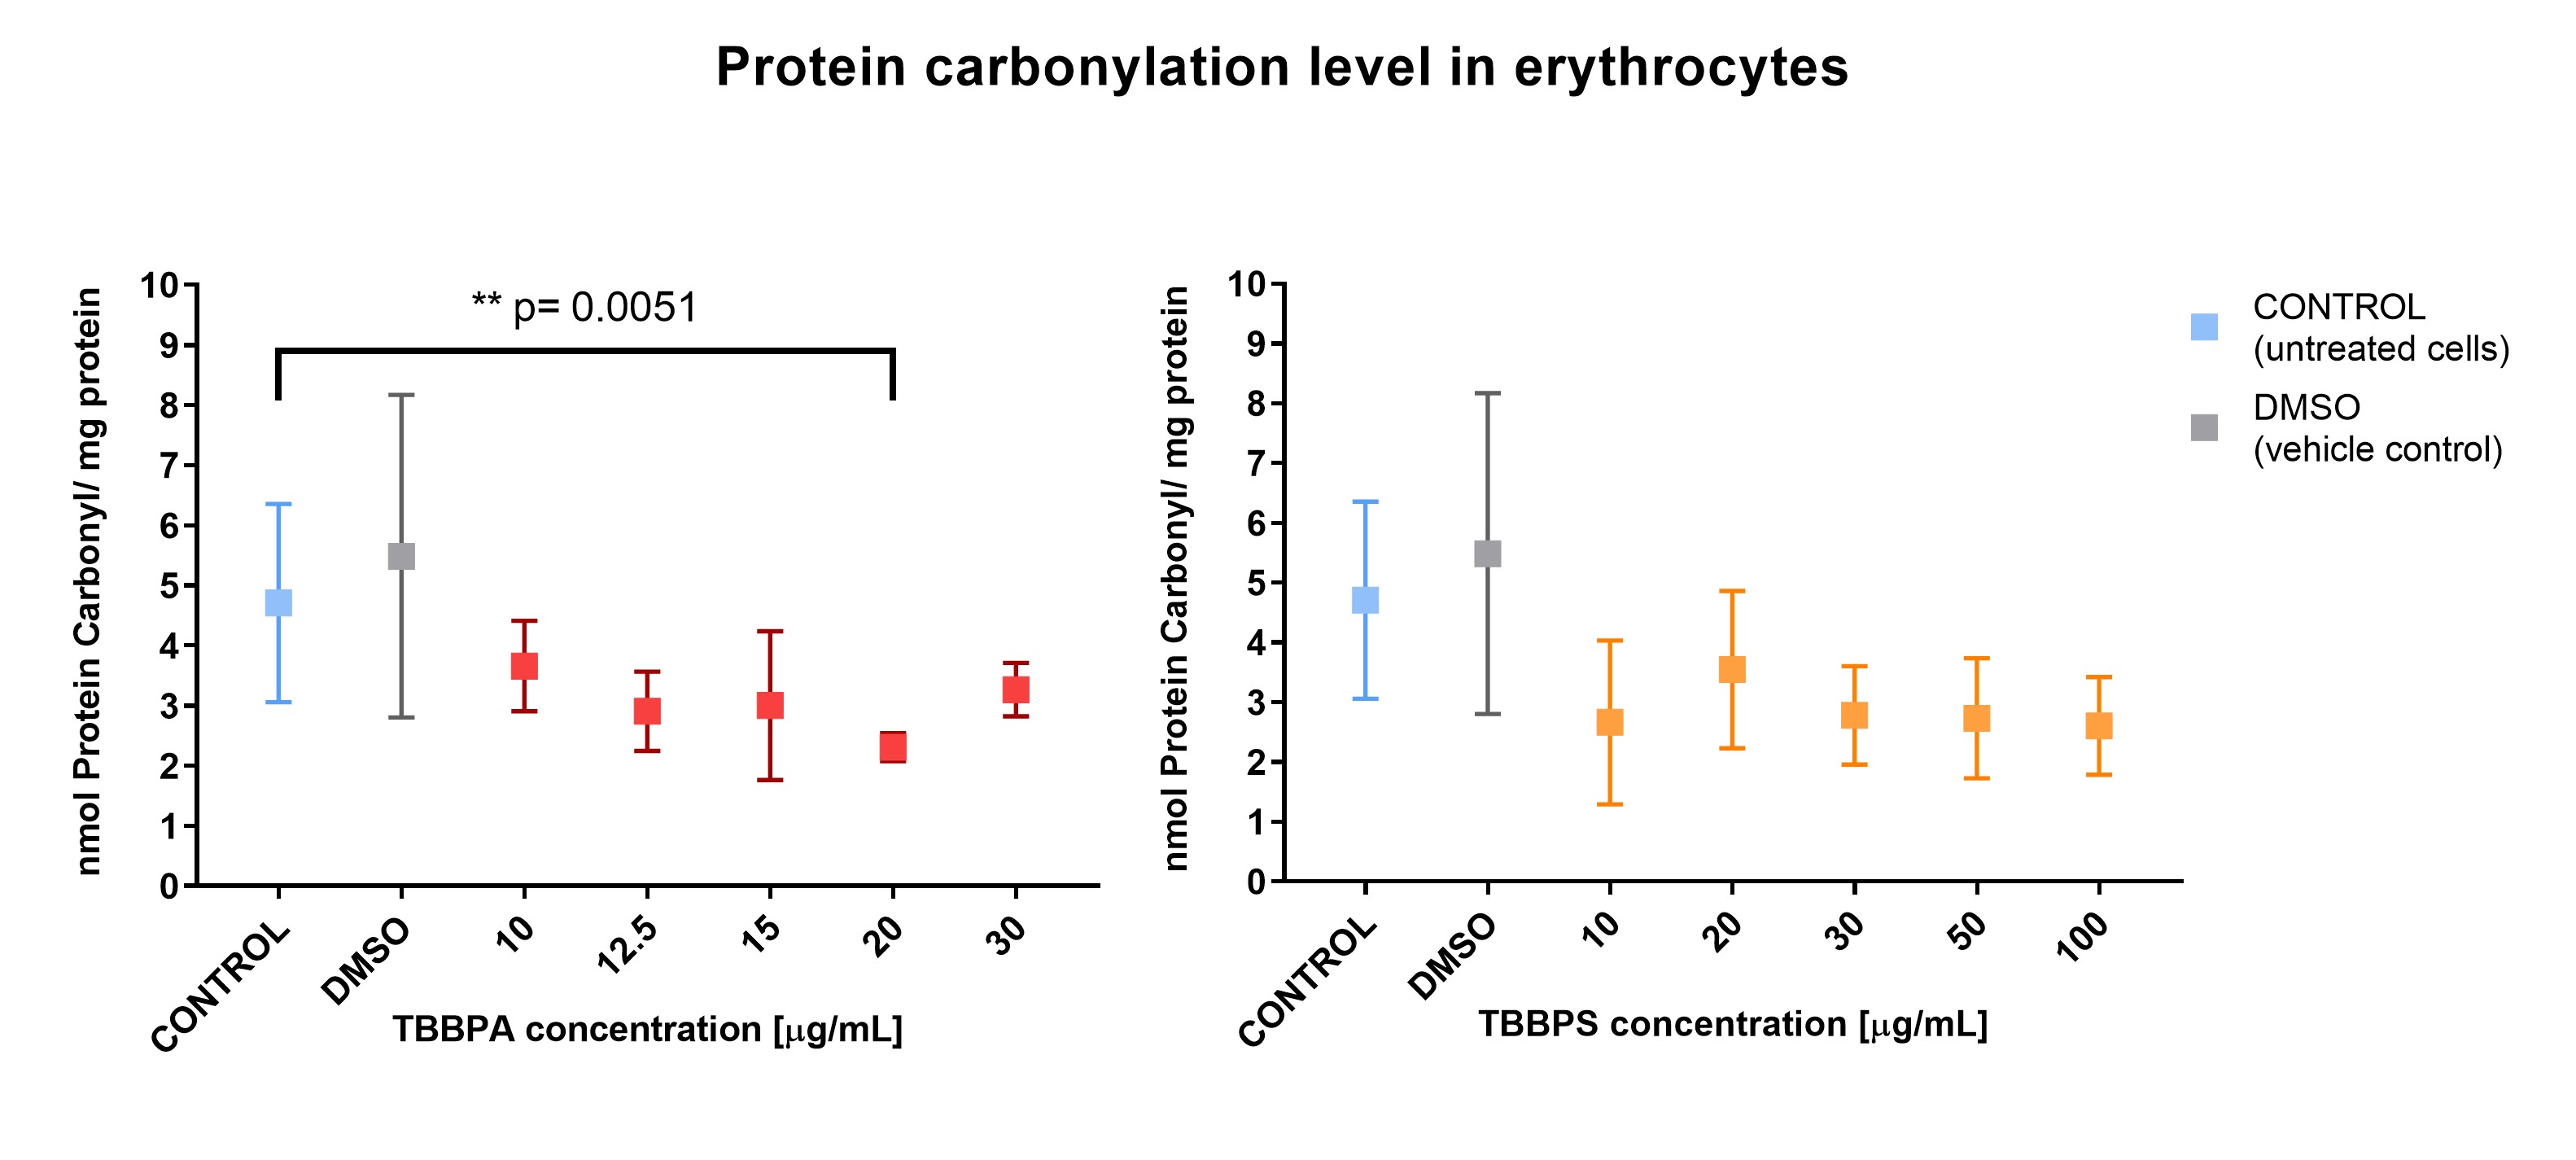
Fig. 5: Membrane protein oxidation in erythrocytes incubated with TBBPA (10–30 µg/mL) or TBBPS (10–100 µg/mL) after 24 h of incubation. Data are presented as mean ± SD, n = 3–5. Significantly different from control (** p<0.01). Mixed-effects model (REML) followed by Dunnett's multiple comparisons test.
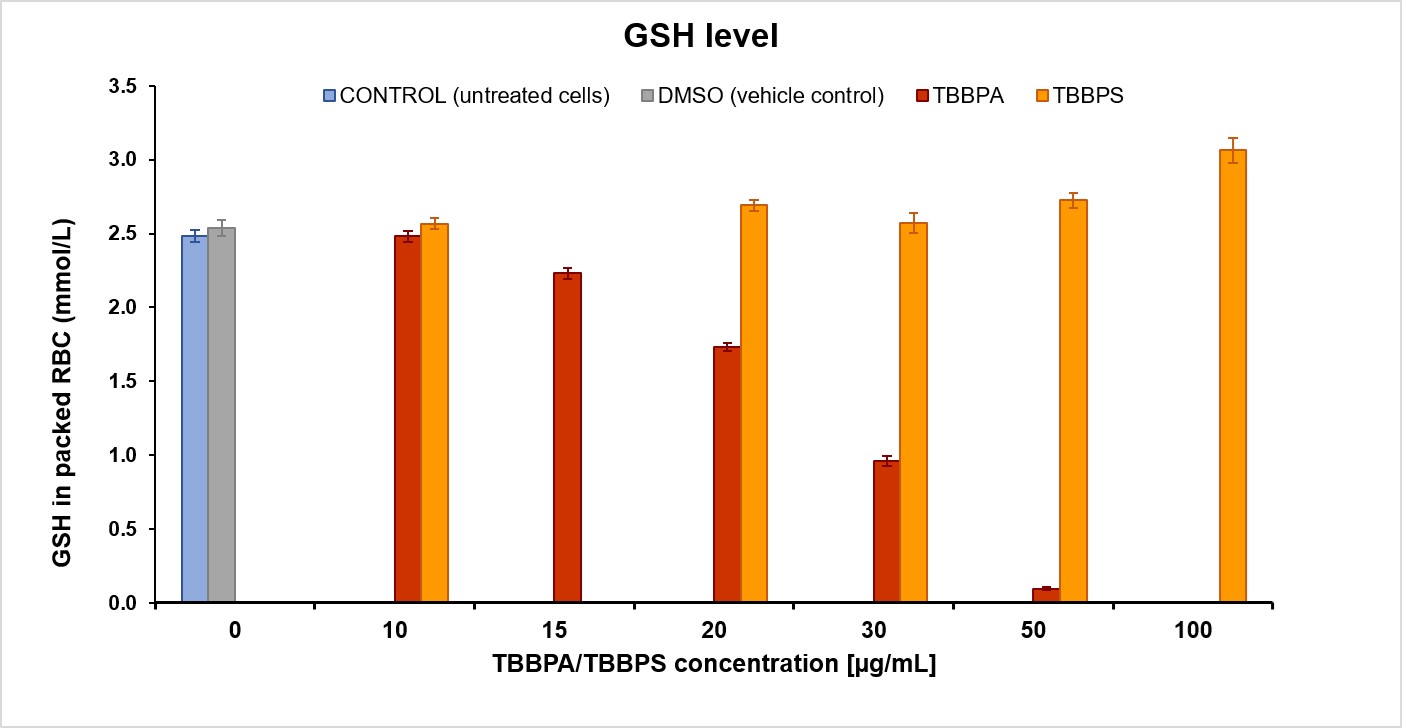
Fig. 6: Glutathione levels in erythrocytes treated with TBBPA (10–50 μg/mL) or TBBPS (10–100 μg/mL) after 24 h of incubation. Each value represents the mean, the maximum error was calculated by the total differential method, n = 3.
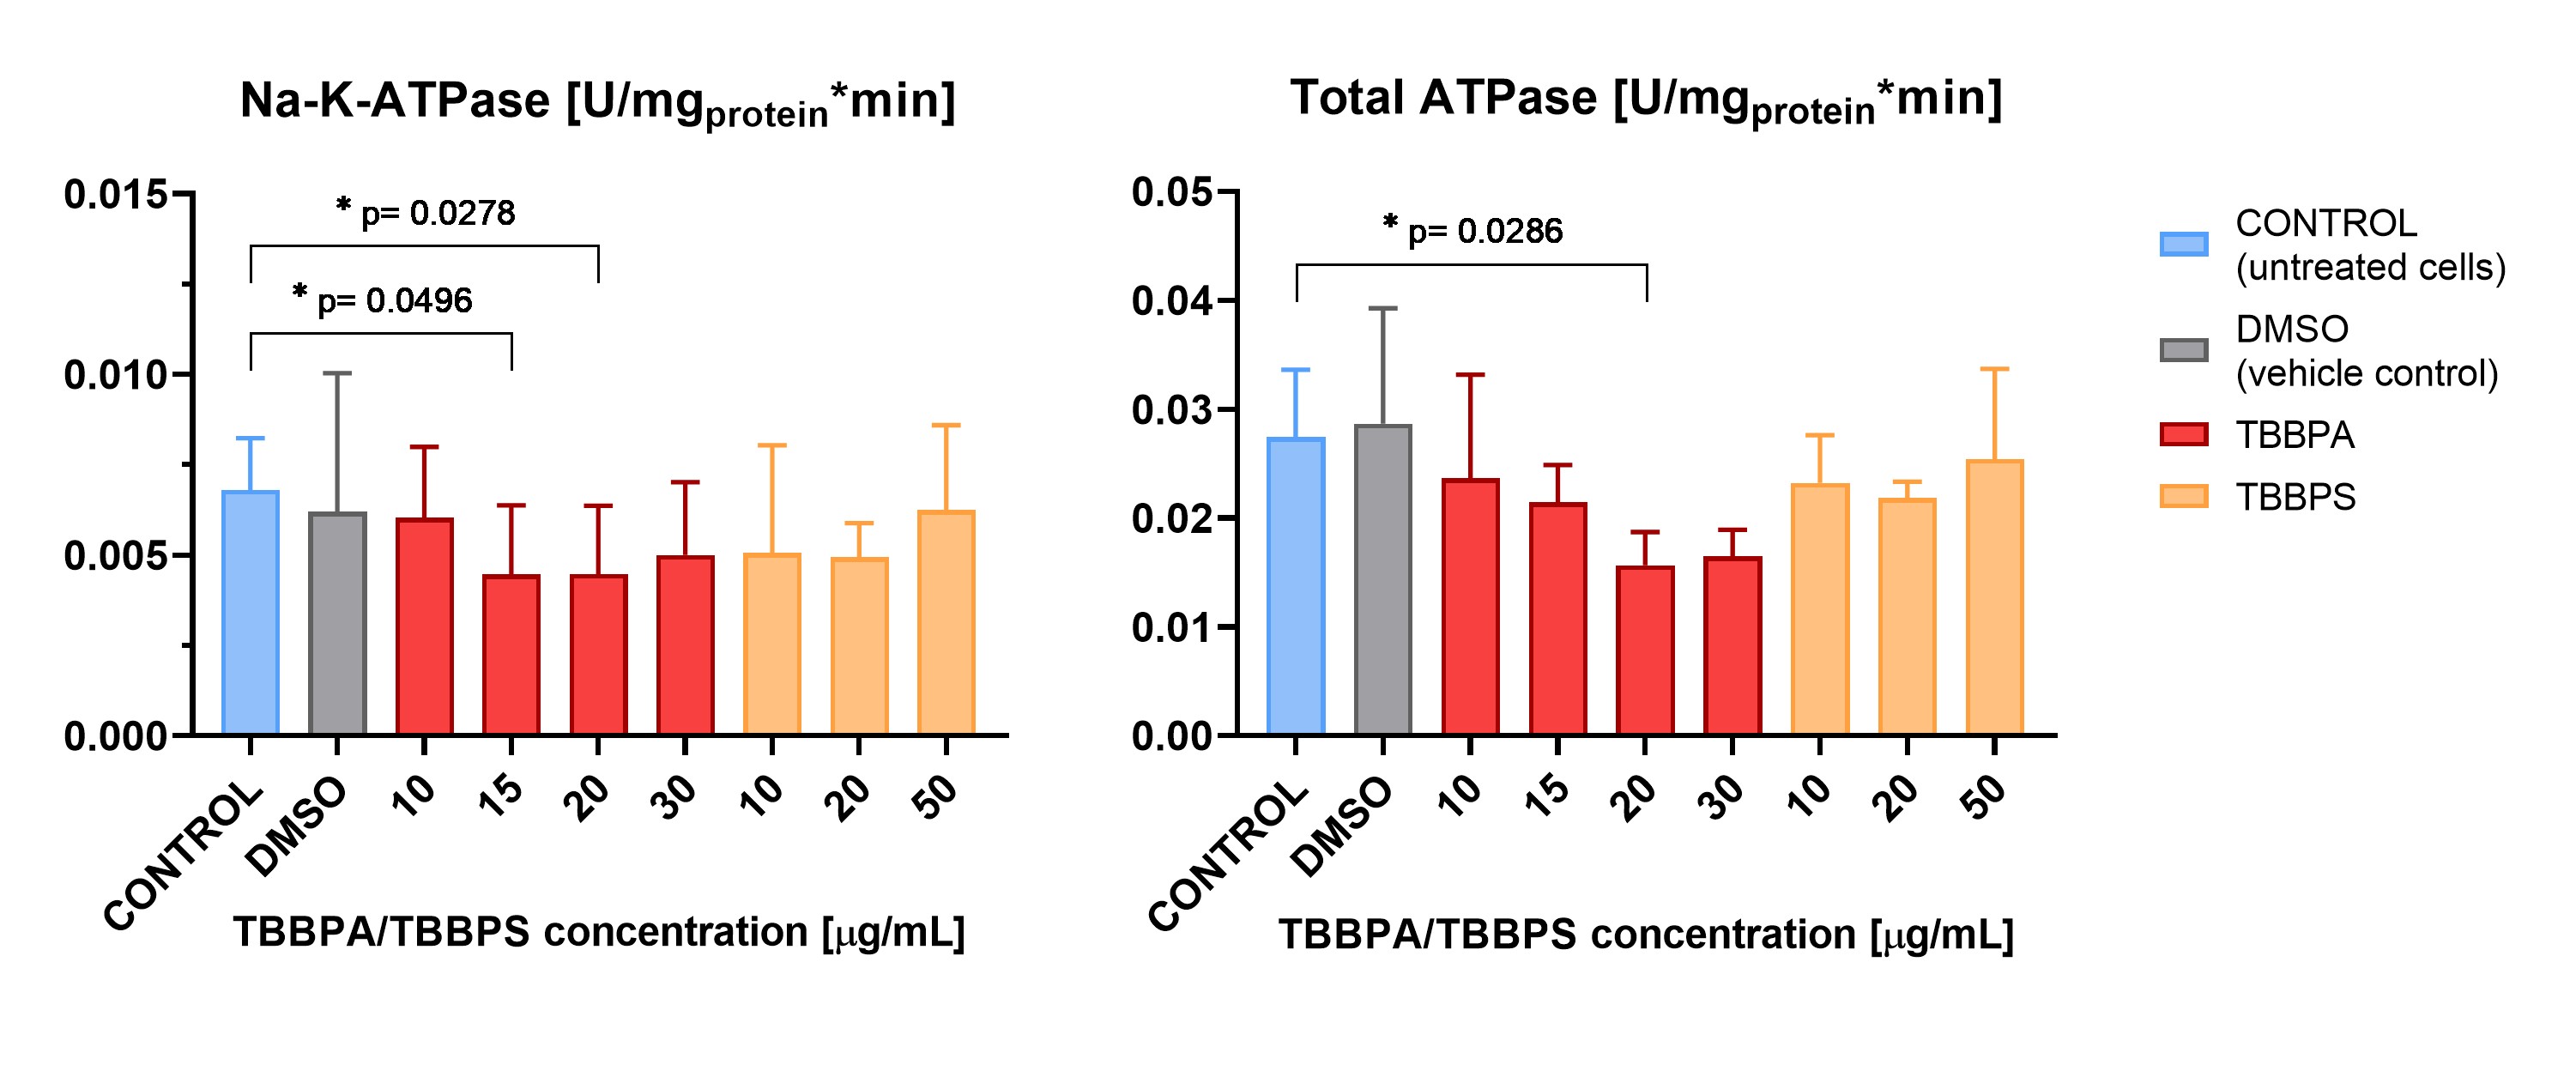
Fig. 7: ATPase activity of erythrocytes treated with TBBPA (10–30 μg/mL) or TBBPS (10–50 μg/mL) after 24 h of incubation. Each value represents mean ± SD, n = 4. Significantly different from control (*p<0.05). One-way repeated-measures ANOVA with Geisser-Greenhouse correction and Dunnett's multiple comparisons test.
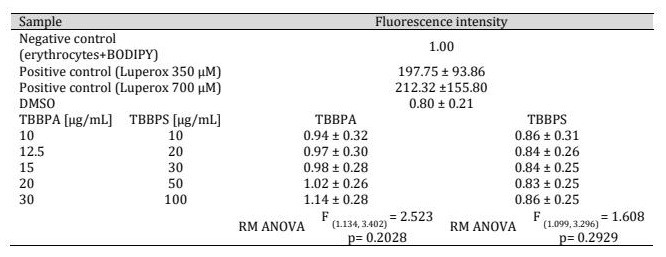
Table 1: Lipid peroxidation in erythrocytes treated with TBBPA (10–30 μg/mL) or TBBPS (10–100 μg/mL) after 24 h of incubation. Lipid peroxidation levels were expressed in arbitrary units (AU), with the negative control value set to 1.00. Data are presented as mean ± SD, n = 4. One-way repeated-measures ANOVA with Geisser–Greenhouse correction and Dunnett's multiple comparisons test
where I or t are the fluorescence intensity or fluorescence lifetime, respectively, in the presence of the quencher, I0 or t0 are the intensity or the lifetime in the absence of the quencher, [Q] is the quencher concentration, and KSV is the Stern−Volmer quenching constant. A linear Stern–Volmer dependence was observed for both compounds within the 0–5.0 μM concentration range. Further increases in TBBPA and TBBPS concentrations were associated with a diminished response to the fluorescence signal; this was attributed to progressive saturation of HSA binding sites by the quenchers. This phenomenon was especially pronounced in the fluorescence lifetime measurements (Fig. 8). The two compounds demonstrated similar Stern-Volmer quenching constants (Ksv), calculated from the linear portion of the plots: reaching 0.112 μM⁻¹ for TBBPA and 0.113 μM⁻¹ for TBBPS. The apparent quenching constants are higher if calculated from steady-state fluorescence intensities. This observation suggests the presence of an additional static-quenching component, particularly at higher concentrations of TBBPA and TBBPS.
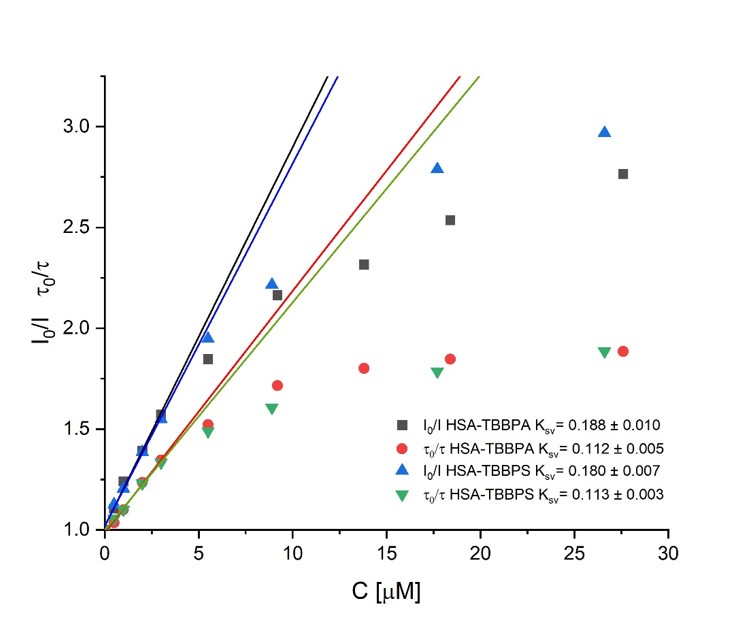
Fig. 8: Stern-Volmer plots of HSA fluorescence intensity quenching (TBBPA represented by squares, TBBPS represented by triangles) or for the fluorescence lifetime measurements (TBBPA – circles; TBBPS – inverted triangle).
Discussion
The first experiments on the effect of tetrabromobisphenol A or S (1–100 µg/mL) on blood cells found exposure to 25 µg/mL TBBPA to cause a significant increase in hemolysis after 24 and 48 hours; however, no such effect was observed when the erythrocytes were treated with TBBPS. Extending the incubation with TBBPA to 72 hours resulted in a significant increase in hemolysis, even at a concentration of 10 µg/mL [19]. Therefore, in the present study, it was decided to use a concentration range of 10 to 30 µg/mL to examine the effect of TBBPA exposure on the initiation of hemolysis in human erythrocytes. TBBPA-induced hemolysis exhibited a threshold-like response, with a slight increase in concentration from 12.5 µg/mL to 20 µg/mL causing a significant increase in the level of hemolysis. At a TBBPA concentration of 12.5 µg/mL, a hemolysis level of 7.23% was observed, whereas increasing the concentration to 20 µg/mL resulted in an increase in erythrocyte hemolysis to approximately 25.5%. Exposure to TBBPA also increased the level of methemoglobin, with the critical concentration yielding a significant increase being 10 µg/mL. Similarly to hemolysis, TBBPS did not induce a statistically significant increase in the oxidation of hemoglobin to methemoglobin across the tested concentration range. The study by Jarosiewicz et al. (2017) [19] was conducted under comparable experimental conditions; however, the erythrocytes were incubated in Ringer’s solution. Despite the use of a slightly lower TBBPA concentration in the present study than in the comparable experiment by Jarosiewicz et al. (2017) [19] (20 vs. 25 µg/mL), hemolysis in our PBS-based system reached a similar level (25.5 ± 9.5% vs. 22.2 ± 3.5%). In contrast, methemoglobin levels were consistently higher in all of our experiments, including the control erythrocytes (5.2 ± 1.2% vs. 2.6 ± 0.4%). These findings suggest that a 24-hour incubation of erythrocytes in a glucose-free medium leads to an increase in methemoglobin levels, while exposure to TBBPs further potentiates this effect. Impaired glycolysis and the associated depletion of intracellular NADH pools may reduce the efficiency of methemoglobin reduction catalyzed by NADH-cytochrome b₅ reductase. As this enzyme utilizes NADH as an electron donor, its activity in erythrocytes is indirectly dependent on glucose availability and glycolytic function [20]. The absence of a concomitant increase in hemolysis despite elevated methemoglobin levels under glucose-deprived conditions suggests that oxidative changes in hemoglobin do not necessarily translate directly into erythrocyte membrane damage. This observation may indicate the presence of effective protective mechanisms that preserve membrane integrity despite disturbances in the redox balance of hemoglobin. The erythrocyte membrane has a two-dimensional structure consisting of a lipid bilayer and membrane proteins. The membrane is elastic and allows blood cells to pass through narrow blood vessels, while the lipid content maintains its fluidity and integrity [21]. While normal erythrocytes do not contain lipid peroxidation products, the lipids contained in the membrane may undergo oxidation, resulting in hemolysis. Jarosiewicz et al. (2021) [22] determined the degree of lipid peroxidation using the TBARS (Thiobarbituric Acid Reactive Substances) method. The results indicate that TBBPA in concentrations of 1-25 µg/mL did not cause a statistically significant increase in lipid peroxidation in erythrocytes after 48 hours of incubation, while for TBBPS a significant increase in the degree of lipid peroxidation was observed at concentrations of 50, 100, and 250 µg/mL [22]. The study also examined whether TBBPA causes lipid peroxidation in red blood cells directly. The analysis was performed using the BODIPY™ 581/591 fluorescent lipid marker, which incorporates into membranes and changes their emission properties under the influence of oxidation. This is a sensitive method that allows real-time monitoring of lipid peroxidation in living cells; however, no lipid peroxidation was observed in cells exposed to either TBBPA or TBBPS. Hence, the increased hemolysis observed in the exposed samples is not related to membrane lipid oxidation. Another key element responsible for the proper functioning of erythrocytes is the nature of their membrane and cytoskeletal proteins. Two main multiprotein complexes are responsible for connecting the cytoskeleton to the membrane: the ankyrin-associated complex and the complex connecting actin and protein 4.1. The main components of the ankyrin complex are band 3, protein 4.2, ankyrin, and the Rh subcomplex. This complex connects the cytoskeleton to the membrane via the cytoplasmic domain of band 3. The connecting complex consists of protein 4.1, actin, and β-spectrin [23]. Defects or damage to cytoskeletal components such as spectrin, ankyrin, protein 4.1, and band 3 result in various disorders of the erythrocyte cell membrane, which can lead to their breakdown [24]. To confirm whether protein damage is responsible for red blood cell breakdown, the membrane proteins isolated from erythrocytes exposed to TBBPA or TBBPS were subjected to electrophoresis. Qualitative analysis of the gels showed that at a concentration of 50 µg/mL TBBPA, band 3, bands 4.1 and 4.2 and the actin band were absent; the spectrin α and β bands were significantly faded, and appeared as single, narrower bands with altered intensity. No differences were noted between samples treated with DTT, a reducing agent, and those which were not, indicating that the proteins were damaged by covalent non-disulfide bonds rather than disulfide bridges. Exposure to TBBPS did not result in any changes in the appearance of the bands compared to the control. Surprising results were observed with regard to the level of protein oxidation (Fig. 5). It has previously been demonstrated that TBBPA alters erythrocyte membrane proteins and thiol groups rather than inducing extensive irreversible protein oxidation [22]. In the present study, exposure did not increase protein carbonyl formation in blood cells. However, interestingly, at a concentration of 20 µg/mL, a trend toward decreased carbonyl levels was observed, suggesting the activation of compensatory antioxidant responses or a hormetic effect induced by moderate oxidative stress. According to the hormesis concept, low- to moderate-level exposure to toxic agents can induce adaptive cellular responses, resulting in increased resistance to oxidative stress [25]. Therefore, the decreased protein carbonyl levels observed after TBBPA exposure may reflect the activation of endogenous defense mechanisms rather than a lack of biological effect. This observation should be interpreted cautiously, as alterations in membrane organization may affect RBH accessibility and fluorescence independently of total protein carbonyl content. However, the present measurements were performed in isolated erythrocyte membranes after removal of unbound TBBPA. Therefore, the non-monotonic changes in RBH-hydrazone fluorescence most likely reflect persistent, concentration-dependent alterations of membrane structure induced during erythrocyte incubation. Due to its high lipophilicity, TBBPA can strongly associate with erythrocyte membranes and modify lipid organization and protein microenvironment in a non-linear manner. At the intermediate tested concentration (20 µg/mL), partial membrane reorganization may reduce the accessibility or fluorescent efficiency of RBH-hydrazone; in contrast, at the higher concentration (30 µg/mL), further membrane restructuring or saturation effects may occur, which restore a microenvironment more favorable for fluorescence detection. Consequently, the observed U-shaped response likely arises from membrane-mediated effects rather than from changes in the total amount of protein carbonyls. An alternative, non-exclusive explanation is that the decreased carbonyl signal reflects reduced accessibility of carbonylated residues to the RBH probe rather than a true reduction in protein oxidation. Carbonylation is known to promote protein compaction and aggregation, and a substantial fraction of the carbonylated proteome can become sequestered within dense, poorly accessible aggregates that are underrepresented by carbonyl assays reliant on probe binding to soluble or membrane-exposed protein [26]. This interpretation is consistent with our SDS-PAGE findings (Fig. 4), which demonstrate TBBPA-induced covalent aggregation of band 3, protein 4.1/4.2 and actin, together with a diffuse high-molecular-weight aggregate band above spectrin. The antioxidant system in erythrocytes is very well developed. This can be attributed to the fact that red blood cells have no nucleus or mitochondria, yet must constantly cope with high exposure to ROS, mainly due to the presence of hemoglobin and oxygen transport. The antioxidant system of erythrocytes comprises an integrated network of enzymes (superoxide dismutase, catalase, glutathione peroxidase, glutathione reductase, peroxiredoxin) and low-molecular-weight compounds supported by the pentose phosphate pathway as a source of NADPH. Its task is to neutralize ROS and protect hemoglobin and the erythrocyte membrane from oxidative damage. The most important non-enzymatic intracellular antioxidant is glutathione (GSH), which maintains the -SH groups of proteins in a reduced state [27]. Jarosiewicz et al. (2019) [28] report that 48-hour exposure to TBBPA results in a significant decrease in the level of reduced glutathione in erythrocytes, even at a concentration of 15 µg/mL; in the case of TBBPS, a significant decrease was observed only at a concentration of 50 µg/mL [28]. However, in the present study, 24-hour incubation with TBBPA significantly reduced the level of reduced glutathione in erythrocytes, with the level falling below 4% compared to controls when treated with 50 µg/mL TBBPA. In contrast, TBBPS did not cause any changes in reduced glutathione content. The slight difference in our results compared with Jarosiewicz et al. (2019) [28] can be accounted for by our use of a commercial test for the determination of glutathione. The test is based on the DTNB reaction combined with glutathione reductase (GR) activity. DTNB reacts with GSH to form a colored product (TNB), while GR reduces GSSG to GSH, allowing for “recycling” and signal amplification. In contrast, Jarosiewicz et al. [28] used the classic Ellman method, which measures all free -SH groups in solution: GSH is one of these sulfhydryl donors, but the method does not distinguish GSH from other thiols (protein and low molecular weight). Nevertheless, both sets of results indicate that TBBPA significantly affects the level of reduced GSH in erythrocytes, which disrupts their antioxidant system and leads to permanent cell damage. Such depletion of intracellular GSH may represent an early event preceding erythrocyte death. Recent reviews indicate that oxidative stress-associated loss of GSH, together with metabolic exhaustion and membrane alterations, are key mechanisms driving eryptosis and subsequent erythrocyte elimination [29]. This is consistent with recent findings by Jarosiewicz and Bukowska (2026), who linked BFR-induced alterations in erythrocyte acetylcholinesterase activity to membrane damage and the initiation of eryptosis, providing direct experimental support for this mechanistic link in the context of brominated flame retardant exposure [30]. The study also examined the activity of ion-dependent ATPases in the erythrocyte membrane. Its findings indicate that the main protein responsible for maintaining the electrochemical potential gradient, i.e., Na⁺,K⁺-ATPase, is inactivated by TBBPA at concentrations of 15 µg/mL and 20 µg/mL, with its activity reduced by approximately 35% compared with the untreated control at both concentrations. In contrast, TBBPS has no statistically significant effect on this parameter. However, a statistically significant decrease of approximately 43% in total ATPase activity is observed only at a TBBPA concentration of 20 µg/mL. These findings indicate that TBBPA significantly affects ion-dependent ATPases, with Na⁺,K⁺-ATPase being particularly sensitive to its effects. Similarly, Jarosiewicz and Bukowska (2026) demonstrated that both TBBPA and TBBPS significantly altered the activity of acetylcholinesterase, another membrane-bound erythrocyte enzyme, at concentrations of 10 µg/mL and 50 µg/mL, respectively, further supporting the notion that BFR exposure disrupts membrane-associated enzymatic systems in red blood cells [30]. Changes in the activity of these proteins alter the structure and function of the plasma membrane [31]. A decrease in ATP reduces the deformability of erythrocytes by stabilizing cytoskeleton-membrane bonds and reducing membrane fluctuation. Any alterations in membrane organization and oxidative stress have a considerable influence on erythrocyte ATPases [32]. Jarosiewicz et al. (2021) [22] report a concentration-dependent decrease in ATP level following exposure to TBBPA or TBBPS, despite glucose being readily available in the incubation medium. Hence, such exposure induces a range of structural changes in plasma membrane components, resulting in various functional changes in, among other things, ATP-ion transport; the erythrocyte metabolism is thus altered through a metabolic process based solely on glucose [22]. Similar changes in erythrocyte hemolysis were noted in the present study, where no glucose supplementation was used; this indicates that the changes initiated by TBBPs prevail over those resulting from erythrocyte starvation. Studies based on HSA fluorescence quenching have found exposure to TBBPs to have a direct effect on protein structure, and have identified a strong interaction between human serum albumin (HSA) and tetrabromobisphenol A (TBBPA) [33, 34]. In the present study, HSA was excited at a wavelength of 280 nm, allowing changes in fluorescence arising from both Trp-214 and the 18 Tyr residues to be assessed. Furthermore, analysis of changes in fluorescence lifetimes upon exposure to TBBPs indicated that dynamic quenching contributes to the overall fluorescence quenching by TBBPs, although static quenching appears to be the predominant mechanism. Interestingly, under the experimental conditions applied in this study, TBBPA and TBBPS exhibited similar effects on HSA fluorescence. The Stern–Volmer plots exhibited good linearity up to 5 µM of TBBPs. Above this concentration, the fluorescence lifetimes no longer depended on the TBBPs concentration, resulting in a plateau in the Stern–Volmer plots based on fluorescence lifetime data. Stern–Volmer analysis indicated that both ligands predominantly followed a static quenching mechanism, consistent with the formation of ground-state complexes at higher TBBPs concentrations. These results are consistent with our previous CD spectroscopy findings, which showed that neither TBBPA nor TBBPS caused significant changes in the secondary structure of HSA up to a concentration of 10 μg/mL, corresponding to 18.4 μM and 17.7 μM for TBBPA and TBBPS, respectively [34]. Other studies have reported that TBBPA binds strongly to HSA, with binding constants on the order of 10⁴–10⁵ L·mol⁻¹ [33, 35]. Thermodynamic analysis and molecular docking studies indicated that hydrophobic interactions are the main driving force for the formation of the TBBPA-HSA complex and localized the TBBPA binding site to Sudlow site I, in the vicinity of Trp-214 [33]. In contrast, molecular dynamics (MD) simulations of the interactions of TBBPA and TBBPS with trypsin revealed that van der Waals interactions and hydrogen bonding are dominant for TBBPA, whereas electrostatic interactions are critical for TBBPS [36]. The localization of TBBPA in the vicinity of Trp-214 is consistent with the efficient fluorescence quenching observed upon excitation of HSA at 295 nm [34]. Collectively, these results indicate that TBBPA binds strongly to HSA without inducing significant global conformational changes in the protein structure at concentrations below the range associated with the threshold-like hemolytic response (10–12.5 µg/mL, corresponding to approximately 18–23 μM) used in the erythrocyte experiments. The lower apparent binding affinity of TBBPS may be attributed, at least in part, to the presence of the sulfonyl group, which increases molecular polarity and may weaken hydrophobic interactions within the largely nonpolar binding pocket of Sudlow site I. These findings suggest that structural differences between TBBPA and TBBPS may play an important role in determining their interactions with HSA and potentially with other proteins, with possible consequences for their transport, distribution, and bioavailability in the circulatory system. Moreover, Zhang et al. (2024) [37] demonstrated that the binding affinity of other halogenated flame retardants for HSA was associated with their cytotoxicity. Compounds exhibiting stronger binding to HSA showed lower cytotoxicity, suggesting that HSA binding may modulate the biological activity and toxicity of these compounds.
Conclusion
The present study demonstrates distinct toxicological effects of TBBPA and TBBPS on human erythrocytes. TBBPA induced a pronounced threshold-like hemolytic response associated with alterations in erythrocyte membrane proteins, disruption of antioxidant defenses, depletion of glutathione, and changes in membrane ATPase activity, but not with detectable lipid peroxidation. In contrast, TBBPS produced substantially weaker effects on erythrocyte membrane integrity and did not induce significant hemolysis within the tested concentration range. Fluorescence studies demonstrated that both TBBPs interact with HSA, with predominantly static quenching accompanied by a contribution from dynamic quenching. Despite their structural similarity, the two compounds exhibited distinct effects on erythrocytes, suggesting that differences in their chemical structure influence their interactions with proteins and may contribute to their different biological effects. Overall, the findings support a model in which the structural differences between TBBPA and TBBPS influence their interactions with proteins and contribute to differences in their biological effects, while the threshold-like response to TBBPA may reflect a critical transition from reversible molecular alterations to loss of erythrocyte membrane integrity. A graphical summary of this proposed mechanism, together with a comparison of the biological effects of TBBPA and TBBPS, is presented in Fig. 9.
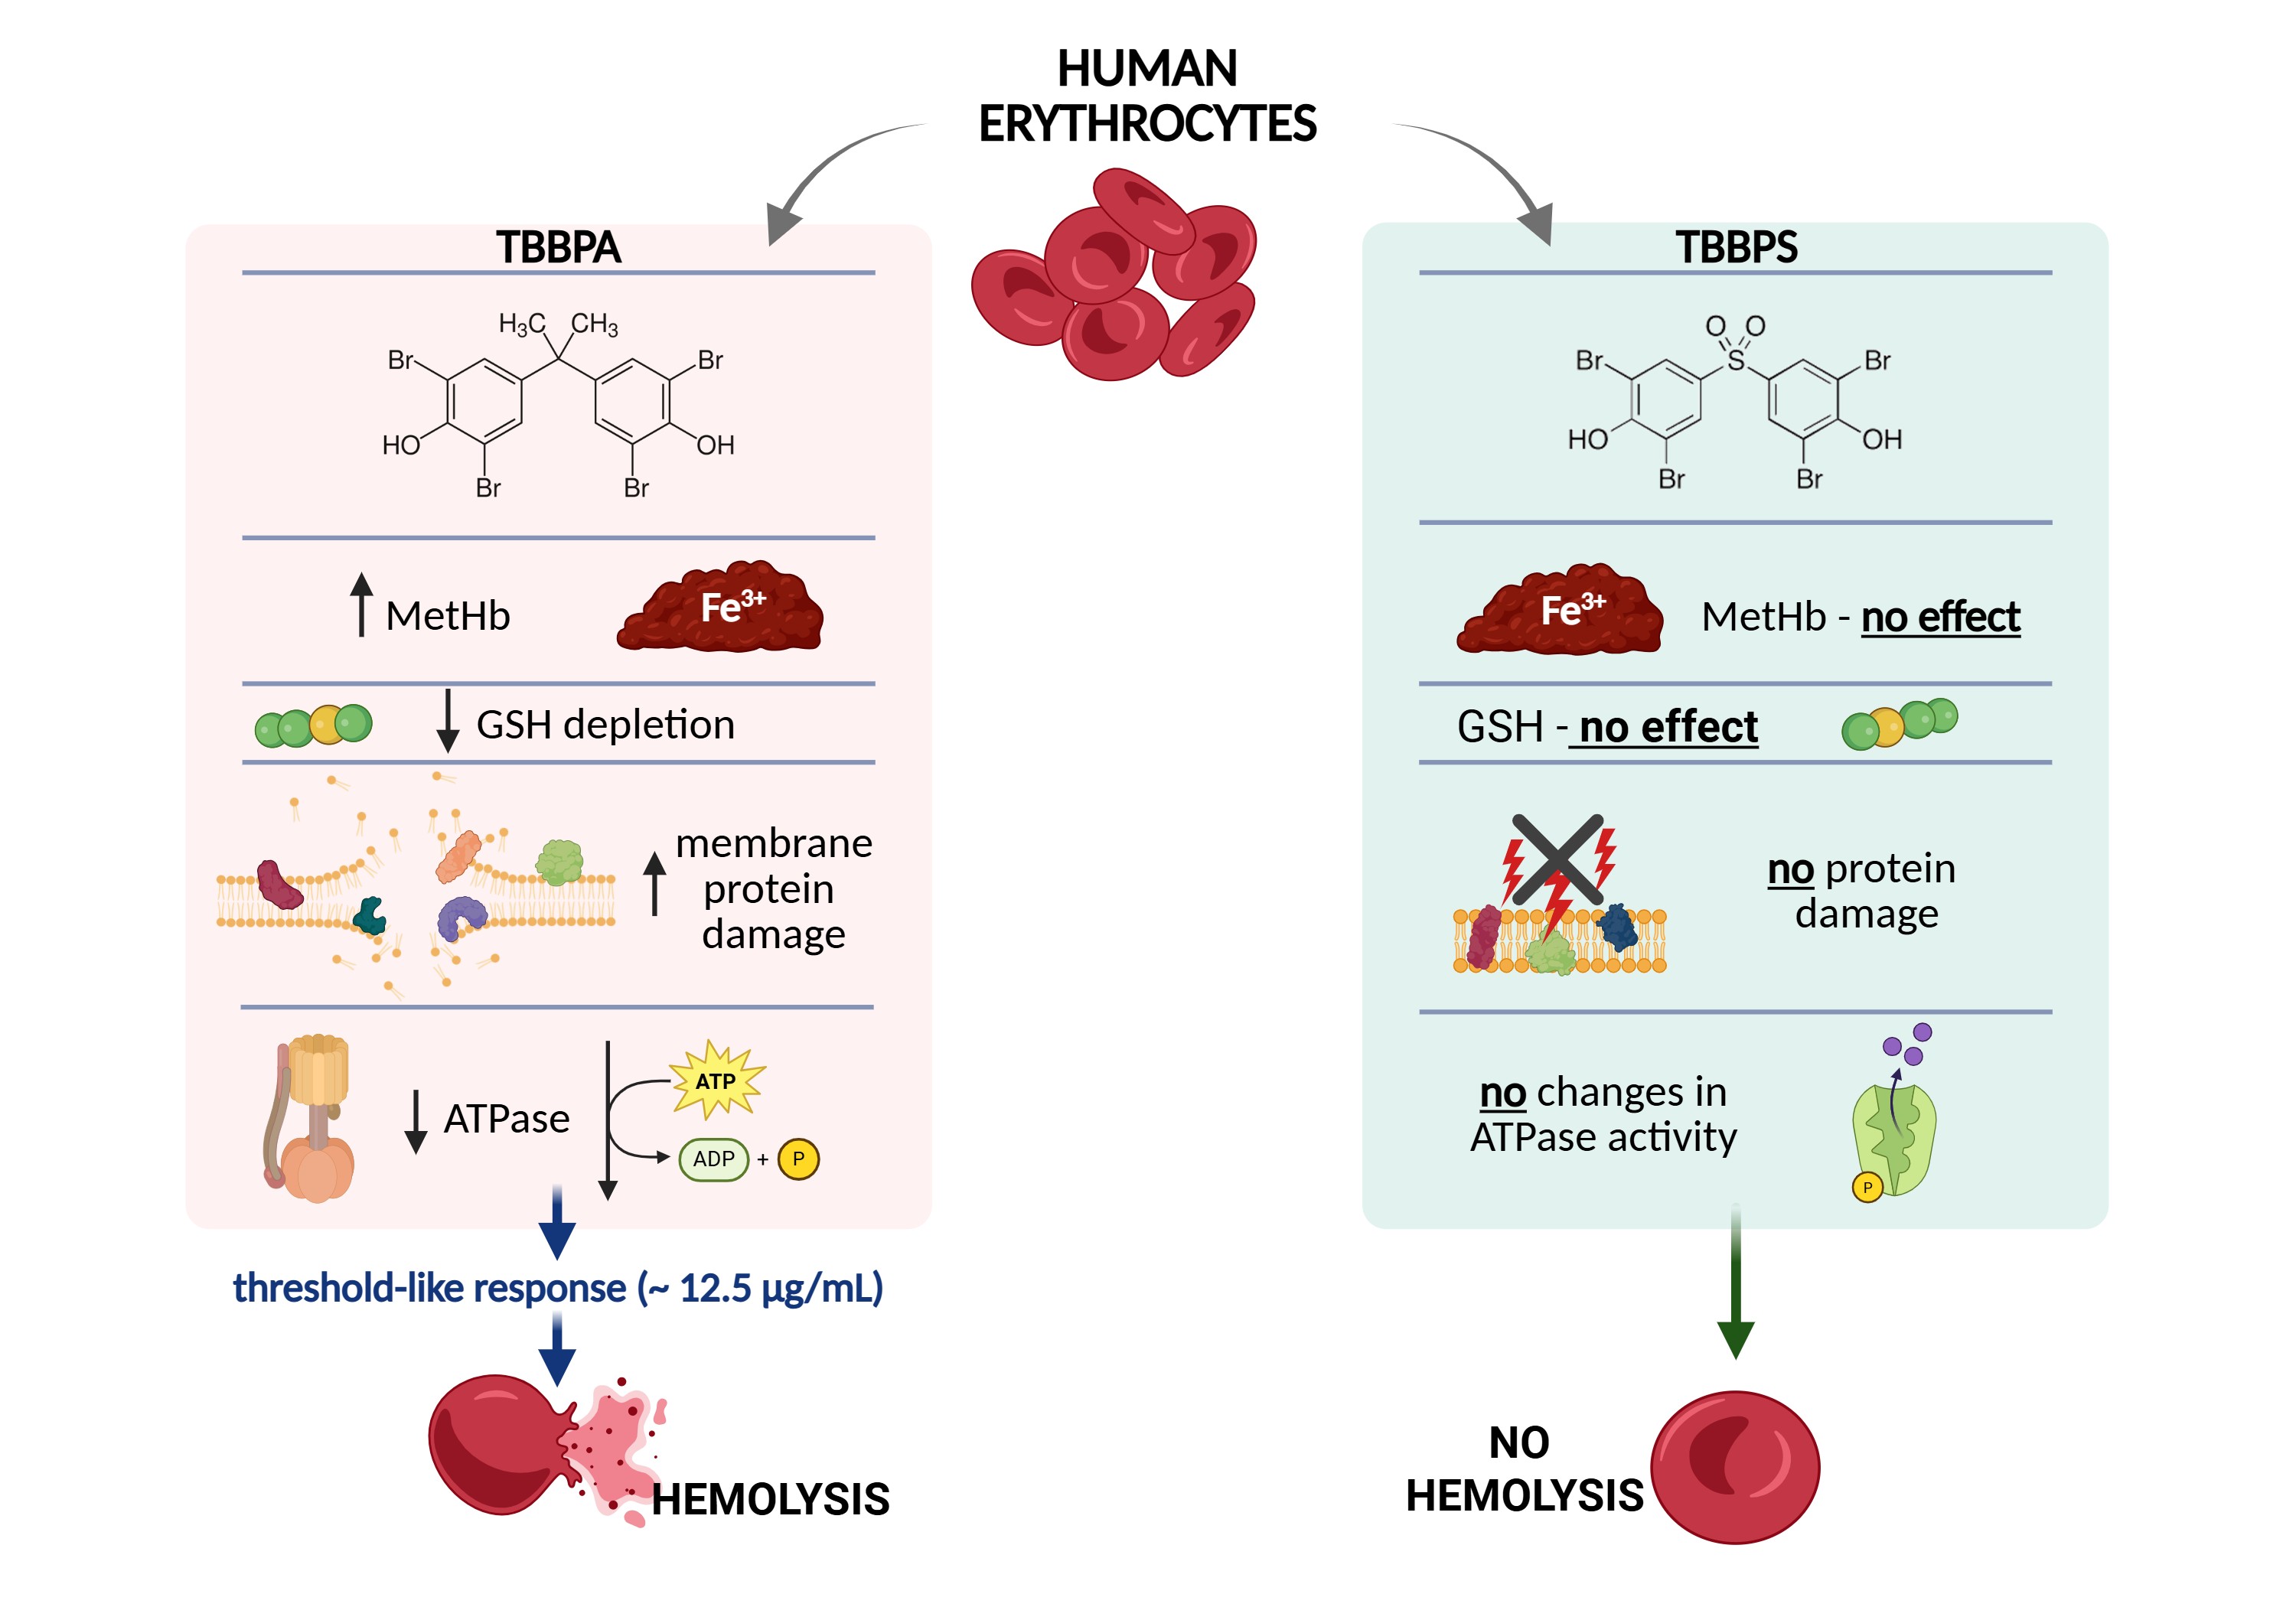
Fig. 9: Proposed mechanism of TBBPA-induced threshold-like erythrocyte hemolysis and comparison of the biological effects of TBBPA and TBBPS. Created using BioRender.com.
Acknowledgements
Author Contributions
APB: Conceptualization, Investigation, Methodology, Experimental work and Analytical determinations, Data interpretation, Statistical analysis, Data visualization and Graphical preparation, Manuscript preparation and Writing. MS: Experimental work, Data interpretation, Data Visualization, Writing. AK: Conceptualization, Project administration, Data interpretation, Writing–Review and Editing, Supervision.
Funding Sources
This manuscript was supported by research funding granted to the Department of Biophysics of Environmental Pollution, Faculty of Biology and Environmental Protection, University of Lodz, Poland (grant no. B2511000000191.01), as well as by the UniLodz IDUB (grant no. B2311009000165.07).
Statement of Ethics
The use of human blood components from buffy coats was approved by Bioethics Committee for Scientific Investigation, University of Lodz (agreement no. 15/II/2020-21).
Disclosure Statement
The authors have no conflicts of interest to declare.
References
- Feiteiro J, Mariana M, Cairrão E. Health toxicity effects of brominated flame retardants: From environmental to human exposure. Environmental Pollution. 2021 Sep;285:117475. https://doi.org/10.1016/j.envpol.2021.117475
- Jarosiewicz M, Bukowska B. Tetrabromobisphenol A - Toxicity, environmental and occupational exposures. Med Pr. 2017 Feb;68(1):121-34. https://doi.org/10.13075/mp.5893.00491
- Lgaz H, Lee H, Boukhlifi F, Messali M. Tetrabromobisphenol A (TBBPA) remediation: State-of-the-art mechanistic insights, innovative technologies, and sustainable management approaches. Sep Purif Technol. 2026 Feb;382:135905. https://doi.org/10.1016/j.seppur.2025.135905
- Miao B, Yakubu S, Zhu Q, Issaka E, Zhang Y, Adams M. A Review on Tetrabromobisphenol A: Human Biomonitoring, Toxicity, Detection and Treatment in the Environment. Molecules. 2023 Mar;28(6):2505. https://doi.org/10.3390/molecules28062505
- Market Publishers. Gen Consulting Company, 2020. Global Tetrabromobisphenol A (TBBPA, CAS 79-94-7) Market, 2020-2026 [Internet]
- Zhang L, Kong D, Zhao X, Meng Y, Li J, Wang Z, et al. Tetrabromobisphenol S (TBBPS) exposure causes gastric cell senescence and inflammation by inducing iron overload. Toxicology. 2024 Aug;506:153866. https://doi.org/10.1016/j.tox.2024.153866
- Xu X, Zhang Y, Huang H, Chen J, Shi T. Distribution, transformation, and toxic effects of the flame retardant tetrabromobisphenol S and its derivatives in the environment: A review. Science of The Total Environment. 2024 Oct;948:174799. https://doi.org/10.1016/j.scitotenv.2024.174799
- Barańska A, Bukowska B, Michałowicz J. Determination of Apoptotic Mechanism of Action of Tetrabromobisphenol A and Tetrabromobisphenol S in Human Peripheral Blood Mononuclear Cells: A Comparative Study. Molecules. 2022 Sep;27(18):6052. https://doi.org/10.3390/molecules27186052
- Hu C, Xu Y, Wang M, Cui S, Zhang H, Lu L. Bisphenol analogues induce thyroid dysfunction via the disruption of the thyroid hormone synthesis pathway. Science of The Total Environment. 2023 Nov;900:165711. https://doi.org/10.1016/j.scitotenv.2023.165711
- Waldvogel Abramowski S. Hemolysis: Mechanism and clinico-biological consequences. Transfusion Clinique et Biologique. 2021 Nov;28(4):364-6. https://doi.org/10.1016/j.tracli.2021.08.352
- Cluitmans JCA, Gevi F, Siciliano A, Matte A, Leal JKF, De Franceschi L, et al. Red Blood Cell Homeostasis: Pharmacological Interventions to Explore Biochemical, Morphological and Mechanical Properties. Front Mol Biosci. 2016 Mar;3. DOI: 10.3389/fmolb.2016.00010 https://doi.org/10.3389/fmolb.2016.00010
- Obeagu EI, Igwe MC, Obeagu GU. Oxidative stress's impact on red blood cells: Unveiling implications for health and disease. Medicine. 2024 Mar;103(9):e37360. https://doi.org/10.1097/MD.0000000000037360
- Orrico F, Laurance S, Lopez AC, Lefevre SD, Thomson L, Möller MN, et al. Oxidative Stress in Healthy and Pathological Red Blood Cells. Biomolecules. 2023 Aug;13(8):1262. https://doi.org/10.3390/biom13081262
- D'Alessandro A, Anastasiadi AT, Tzounakas VL, Nemkov T, Reisz JA, Kriebardis AG, et al. Red Blood Cell Metabolism In vivo and In vitro. Metabolites. 2023 Jun;13(7):793. https://doi.org/10.3390/metabo13070793
- Thompson JK, Triglia T, Reed MB, Cowman AF. A novel ligand from Plasmodium falciparum that binds to a sialic acid‐containing receptor on the surface of human erythrocytes. Mol Microbiol. 2001 Jul;41(1):47-58. https://doi.org/10.1046/j.1365-2958.2001.02484.x
- Lowry OH, Rosebrough NJ, Farr AL, Randall RJ. Protein measurement with the Folin phenol reagent. Journal of Biological Chemistry. 1951 Nov;193(1):265-75. https://doi.org/10.1016/S0021-9258(19)52451-6
- Marciniak B. Does Cu(acac)2 quench benzene fluorescence?: A physical chemistry experiment. J Chem Educ. 1986 Nov;63(11):998. https://doi.org/10.1021/ed063p998
- Zhao Z, Li H, Yao J, Lan J, Bao Y, Zhao L, et al. Binding of Tetrabromobisphenol A and S to Human Serum Albumin Is Weakened by Coexisting Nanoplastics and Environmental Kosmotropes. Environ Sci Technol. 2023 Mar;57(11):4464-70. https://doi.org/10.1021/acs.est.2c09090
- Jarosiewicz M, Duchnowicz P, Włuka A, Bukowska B. Evaluation of the effect of brominated flame retardants on hemoglobin oxidation and hemolysis in human erythrocytes. Food and Chemical Toxicology. 2017 Nov;109:264-71. https://doi.org/10.1016/j.fct.2017.09.016
- Spinelli S, Marino A, Morabito R, Remigante A. Interplay Between Metabolic Pathways and Increased Oxidative Stress in Human Red Blood Cells. Cells. 2024 Dec;13(23):2026. https://doi.org/10.3390/cells13232026
- Li H, Lykotrafitis G. Erythrocyte Membrane Model with Explicit Description of the Lipid Bilayer and the Spectrin Network. Biophys J. 2014 Aug;107(3):642-53. https://doi.org/10.1016/j.bpj.2014.06.031
- Jarosiewicz M, Duchnowicz P, Jarosiewicz P, Huras B, Bukowska B. An In vitro Comparative Study of the Effects of Tetrabromobisphenol A and Tetrabromobisphenol S on Human Erythrocyte Membranes-Changes in ATP Level, Perturbations in Membrane Fluidity, Alterations in Conformational State and Damage to Proteins. Int J Mol Sci. 2021 Aug;22(17):9443. https://doi.org/10.3390/ijms22179443
- Mankelow TJ, Satchwell TJ, Burton NM. Refined views of multi-protein complexes in the erythrocyte membrane. Blood Cells Mol Dis. 2012 Jun;49(1):1-10. https://doi.org/10.1016/j.bcmd.2012.03.001
- Li N, Chen S, Xu K, He M-T, Dong M-Q, Zhang QC, et al. Structural basis of membrane skeleton organization in red blood cells. Cell. 2023 Apr;186(9):1912-1929.e18. https://doi.org/10.1016/j.cell.2023.03.017
- Calabrese EJ, Mattson MP. Hormesis provides a generalized quantitative estimate of biological plasticity. J Cell Commun Signal. 2011 Mar;5(1):25-38.https://doi.org/10.1007/s12079-011-0119-1
- Tanase M, Urbanska AM, Zolla V, Clement CC, Huang L, Morozova K, et al. Role of Carbonyl Modifications on Aging-Associated Protein Aggregation. Sci Rep. 2016 Jan;6(1):19311. https://doi.org/10.1038/srep19311
- Sadowska-Bartosz I, Bartosz G. Peroxiredoxin 2: An Important Element of the Antioxidant Defense of the Erythrocyte. Antioxidants. 2023 Apr;12(5):1012. https://doi.org/10.3390/antiox12051012
- Jarosiewicz M, Krokosz A, Marczak A, Bukowska B. Changes in the activities of antioxidant enzymes and reduced glutathione level in human erythrocytes exposed to selected brominated flame retardants. Chemosphere. 2019 Jul;227:93-9. https://doi.org/10.1016/j.chemosphere.2019.04.008
- Alghareeb SA, Alfhili MA, Fatima S. Molecular Mechanisms and Pathophysiological Significance of Eryptosis. Int J Mol Sci. 2023 Mar;24(6):5079. https://doi.org/10.3390/ijms24065079
- Jarosiewicz M, Bukowska B. Acetylcholinesterase Activity in Erythrocytes: a Functional Sensor of Environmental Toxicity from Brominated Flame Retardants. Cellular Physiology and Biochemistry. 2026 Apr;60(2):213-22. https://doi.org/10.33594/000000863
- Yamaguchi T, Fukuzaki S. ATP effects on response of human erythrocyte membrane to high pressure. Biophys Physicobiol. 2019;16(0):158-66. https://doi.org/10.2142/biophysico.16.0_158
- Radosinska J, Vrbjar N. Erythrocyte Deformability and Na,K-ATPase Activity in Various Pathophysiological Situations and Their Protection by Selected Nutritional Antioxidants in Humans. Int J Mol Sci. 2021 Nov;22(21):11924. https://doi.org/10.3390/ijms222111924
- Zhang H, Cai R, Chen C, Gao L, Ding P, Dai L, et al. Impacts of Halogen Substitutions on Bisphenol A Compounds Interaction with Human Serum Albumin: Exploring from Spectroscopic Techniques and Computer Simulations. Int J Mol Sci. 2023 Aug;24(17):13281. https://doi.org/10.3390/ijms241713281
- Jarosiewicz M, Miłowska K, Krokosz A, Bukowska B. Evaluation of the Effect of Selected Brominated Flame Retardants on Human Serum Albumin and Human Erythrocyte Membrane Proteins. Int J Mol Sci. 2020 May;21(11):3926. https://doi.org/10.3390/ijms21113926
- Wang Y-Q, Zhang H-M, Cao J. Exploring the interactions of decabrominateddiphenyl ether and tetrabromobisphenol A with human serum albumin. Environ Toxicol Pharmacol. 2014 Sep;38(2):595-606. https://doi.org/10.1016/j.etap.2014.08.009
- Ding K, Zhang H, Wang H, Lv X, Pan L, Zhang W, et al. Atomic-scale investigation of the interactions between tetrabromobisphenol A, tetrabromobisphenol S and bovine trypsin by spectroscopies and molecular dynamics simulations. J Hazard Mater. 2015 Dec;299:486-94. https://doi.org/10.1016/j.jhazmat.2015.07.050
- Zhang Z, Dai L, Yang K, Luo J, Zhang Y, Ding P, et al. Molecular insight on the binding of halogenated organic phosphate esters to human serum albumin and its effect on cytotoxicity of halogenated organic phosphate esters. Int J Biol Macromol. 2024 Jun;270:132383. https://doi.org/10.1016/j.ijbiomac.2024.132383