A High Dose of Calcitriol Inhibits Glycolysis and M2 Macrophage Polarization in the Tumor Microenvironment by Repressing mTOR Activation: in vitro and Molecular Docking Studies
bObesity and Cancer Biology Lab, Natural and Medical Sciences Research Center, University of Nizwa, Nizwa, Sultanate of Oman,
cTexas Tech University Health Sciences Center, Lubbock, TX, USA,
dDepartment of Pharmacy, Abdul Wali Khan University Mardan, Mardan, Khyber, Pakhtunkhwa, Pakistan,
eBiology Program, Department of Biological and Environmental Sciences, College of Arts and Sciences, Qatar University, Doha, Qatar,
fMechanical Engineering, Texas Tech University, Lubbock, TX , USA,
gBiological Sciences, Texas Tech University, Lubbock, TX, USA
Keywords
Abstract
Background/Aims:
Macrophages interact with tumor cells within the tumor microenvironment (TME), which plays a crucial role in tumor progression. Cancer cells also can instruct macrophages to facilitate the spread of cancer and the growth of tumors. Thus, modulating macrophages-cancer cells interaction in the TME may be therapeutically beneficial. Although calcitriol (an active form of vitamin D) has anticancer properties, its role in TME is unclear. This study examined the role of calcitriol in the regulation of macrophages and cancer cells in the TME and its influence on the proliferation of breast cancer cells.Methods:
We modeled the TME, in vitro , by collecting conditioned medium from cancer cells (CCM) and macrophages (MCM) and culturing each cell type separately with and without (control) a high-dose (0.5 µM) calcitriol (an active form of vitamin D). An MTT assay was used to examine cell viability. Apoptosis was detected using FITC (fluorescein isothiocyanate) annexin V apoptosis detection kit. Western blotting was used to separate and identify proteins. Quantitative real-time PCR was used to analyze gene expression. Molecular docking studies were performed to evaluate the binding type and interactions of calcitriol to the GLUT1 and mTORC1 ligand-binding sites.Results:
Calcitriol treatment suppressed the expression of genes and proteins implicated in glycolysis (GLUT1, HKII, LDHA), promoted cancer cell apoptosis, and reduced viability and Cyclin D1gene expression in MCM-induced breast cancer cells. Additionally, calcitriol treatment suppressed mTOR activation in MCM-induced breast cancer cells. Molecular docking studies further showed efficient binding of calcitriol with GLUT1 and mTORC1. Calcitriol also inhibited CCM-mediated induction of CD206 and increased TNFα gene expression in THP1-derived macrophages.Conclusion:
The results suggest that calcitriol may impact breast cancer progression by inhibiting glycolysis and M2 macrophage polarization via regulating mTOR activation in the TME and warrants further investigation in vivo.Introduction
Substantial evidence supports macrophages as the dominant immune cells in the tumor microenvironment (TME), constituting up to 50% of the tumor mass [1]. These macrophages in the TME are known as tumor-associated macrophages (TAMs) and are derived from circulating monocytes. Traditionally, macrophages have two phenotypes, M1 and M2, based on their functions. The M1 phenotype with pro-inflammatory responses and antitumor functions [1, 2]. M2 macrophages, on the other hand, promote wound healing and angiogenesis [3]. The monocytes recruited to the tumor site are reprogrammed into TAMs, similar to M2 macrophages [2, 4]. M2 macrophages acquire protumoral function and facilitate tumor growth, promote angiogenesis, cause tumor invasion and metastasis [4]. TAMs also suppress T-cells that trigger the antitumor response [5, 6]. TAM infiltration in tumors, including breast tumors, may result in poor outcomes and resistance to treatment [3, 7, 8]. As well, cancer cells can instruct macrophages to facilitate metastasis and tumor growth [9]. Several studies have investigated the relationship between breast cancer and macrophages, and cancer therapies that target both breast cancer cells and macrophages have considerable clinical potential [10, 11].
Most of the previous studies investigating TAMs, targeted blocking macrophage recruitment to the primary tumor and TAM differentiation, inhibition of TAM polarization, and miRNA-mediated regulation of TAM functions towards preventing breast tumor progression [12-18]. However, the role of macrophages in the TME in promoting breast cancer cell glycolysis and progression is unclear.
Aberrant glucose metabolism is intimately associated with cancer progression, including breast cancer [19, 20]. Cancer cells metabolize glucose through aerobic glycolysis rather than oxidative phosphorylation, which is more energy efficient, even when oxygen is present [19, 21]. Growing evidence suggests that epigenetics and oncogenic mutations can alter tumor cell metabolic reprogramming. Nevertheless, little is known about how tumor environmental factors contribute to breast cancer metabolism and progression [22, 23].
The mammalian target of rapamycin (mTOR) is a serine/threonine kinase, which is crucial in controlling cell growth, survival, metabolism, and immunity [24]. mTOR promotes aerobic glycolysis by altering glycolytic enzyme expression [4], whereas blocking mTOR inhibits glycolysis [25]. The mTOR signaling pathway also can influence the macrophage differentiation process, leading to tumor cell survival, proliferation, migration, and angiogenesis [26, 27]. Additionally, the mTOR pathway modulates tumor immunity and angiogenesis through its effects on stroma-tumor interactions [28]. The data suggest that mTOR modulation can be a very effective therapeutic target for inhibiting tumor progression via macrophage response in the TME.
Vitamin D is essential for phosphate and calcium metabolism as well as for bone physiology. Humans can obtain vitamin D from two primary sources: diet and sunlight exposure. There are a few natural foods that contain vitamin D in significant amounts. These include fatty fish, eggs, and sun-dried mushrooms. However, the majority (90 to 95%) of the required vitamin D is produced by the skin when exposed to sunlight (ultraviolet B radiation) [5]. Accumulating biological and epidemiological data suggest that calcitriol (an active form of Vitamin D) plays a crucial role in the modulation of cancer cell metabolism, invasion, and metastasis [29-32]. Previously, we found that calcitriol decreased glycolysis and invasiveness of breast cancer cells and increased their stiffness [33]. However, the participation of calcitriol in regulating macrophage-mediated breast cancer cell progression, and its underlying mechanisms remains elusive.
The present study evaluated the role of calcitriol on glycolysis in the TME. MCF-7 and MDA-MB-231 breast cancer cells were cultured/induced with THP1-derived macrophage cell-conditioned media (MCM), to model the physiological tumor environment in which macrophages infiltrate tumor tissue, and their effect on breast cancer cells was investigated [34, 35]. In addition, the study assesses the role of calcitriol on mTOR activation (P-mTOR) in the TME. Calcitriol decreased glycolytic genes and protein expression both in low metastatic potential MCF-7 breast cancer cells and high metastatic MDA-MB-231 breast cancer cells induced with THP-1 monocyte-derived macrophage media (MCM). Interestingly, calcitriol treatment increased apoptosis, reduced viability, and cell cycle-related gene expression, and suppressed P-mTOR levels in breast cancer cells induced with MCM. To assess the impact of cancer cells on TAM polarization in the TME, we cultured THP1-derived macrophages with cancer cell conditioned medium (CCM) and CCM+ Calcitriol. We found that calcitriol treatment inhibited CD206, which is involved in M2 polarization and increased TNFα, an M1 polarization marker, in THP-1 monocyte-derived macrophages stimulated with MCF-7 and MDA-MB-231 cells conditioned media (CM). The docking studies also reveal that calcitriol binds to GLUT1 and mTORC1.
Materials and Methods
Cell culture and treatment
MCF-7 and MDA-MB-231 breast cancer cells were obtained from American Type Culture Collection and grown in Dulbecco’s modified eagle medium (DMEM) (11965-118, Life Technologies) containing 10% fetal bovine serum (FBS, 10437-028, Gibco) and 1% penicillin-streptomycin, in a 5% CO2 incubator at 37°C. The human leukemia monocyte cell line, THP-1, was obtained from American Type Culture Collection and grown in Roswell Park Memorial Institute (RPMI) 1640 medium (11875-093, Gibco by Life Technologies) containing 10% fetal bovine serum (FBS, 10437-028, Gibco), 1% penicillin-streptomycin and 0.05mM 2-Mercaptoethanol (21985-023, Life Technologies), in a 5% CO2 incubator at 37°C. Phorbol myristate acetate (PMA, Sigma) was used to differentiate THP-1 cells into macrophages. Cells were cultured in RPMI 1640 complete medium with PMA (100 ng/ml) for 72 hours, followed by an additional 24 hours of calcitriol (0.5 µM) treatment [32].
THP-1 differentiation, macrophage-conditioned medium preparation, and treatment
THP-1 cells Were cultured as described above for 72 hours. Following that, the cells were cultured in reduced serum media (31985- 088, Gibco by Life Technologies) without (control) and with a high dose of calcitriol (0.5 µm) for 24 hours. The cells were then rinsed and again reduced serum medium was added. After another 24 hours, supernatants were collected as MCM and MCM+Calcitriol following the removal of cell debris by centrifugation [35, 36]. These conditioned media were used to culture/induce MCF-7 and MDA-MB-231 cells. There were total of three groups; a. Control (MCF-7 and MDA-MB-231 cells induced with DMEM medium), b. MCM (cancer cells cultured/induced with DMEM and MCM, 1:1). C. MCM+Calcitriol (cancer cells cultured/induced with DMEM and MCM+Calcitriol, 1:1).
Collection of cancer cell conditioned medium and treatment of THP1-derived macrophages
MCF-7 and MDA-MB-231 breast cancer cells were cultured as described above and after calcitriol treatment, cells incubated in a reduced serum medium for 24 h. Subsequently, culture supernatants were collected as conditioned medium (MCF-7-CM, MDA-MB-231-CM, MCF-7-CM+Calcitriol, MDA-MB-231-CM+Calcitriol) following centrifugation and removal of cell debris [37]. For macrophage polarization experiments, THP-1- derived macrophages were divided into three groups: A. Control (macrophages cultured/induced with1640 medium, B. CCM (macrophages were cultured/induced with MCF-7-CM and MDA-MB-231-CM+1640 medium, 1:1), C. CCM+Calcitriol (macrophages were cultured/induced with MCF-7-CM+Calcitriol and MDA-MB-231-CM+Calcitriol and 1640 medium, 1:1).
Preparation of cytosolic fractions
Cytosolic fractions were prepared as described previously [29]. Protein concentration was measured by Bradford assay (Bio-Rad) using bovine serum albumin (BSA) as standard according to the manufacturer’s protocol.
Gene expression by quantitative real-time polymerase chain reaction (qRT-PCR)
Total RNA was isolated using RNAeasy Plus kit (Qiagen). IScript cDNA synthesis kit (Bio-Rad) was used for reverse transcription of total RNA. qPCR was performed using primer sets (Sigma-Aldrich, St. Louis, MO, USA) for genes of interest and reference gene and iQ SYBR Supermix (Bio-Rad) following manufacturer’s protocol. Since beta actin exhibited constant expression between treatments, it was selected as an endogenous control. After normalizing to beta actin, each sample’s relative expression (RNA) was calculated using the ΔΔCt method.
The primer sequences used are:
| Human GLUT-1: | F-TGCGGGAGAAGAAGGTCA, |
| R-CAGCGT TGATGCCAGACA. | |
| Human TNFa: | F-AGCAAGGACAGCAGAGGA. |
| R-GGTCAGTATGTGAGAGGAAGAGA. | |
| Human CD206: | F-AATGCTACCACAGTTATGCCTAC, |
| R-TTCGTGCCTCTTGCCAATT | |
| Human HKII: | F-AAGCCCTTTCTCCATCTCCT, |
| R-CTTCTTCACGGAGCTCAACC. | |
| Human LDHA: | F-CAGCCCGAACTGCAAGTTGCTTAT, |
| R-TCAGGTAACGGAATCGGGCTGAAT. | |
| Human β-Actin: | F-TGCTATCCAGGCTGTGCTATCC, |
| R-GCCAGGTCCAGACGCAGG. | |
| Human Cyclin A1: | F-AATTGTGCCTTGCCTGAGTGA |
| R-AAGAACTGCAGGTGGCTC CAT | |
| Human Cyclin D1: | F-CCCTCGGTGTCCTACTTCAA |
| R- GTGTTCAATGAAATCGTGCG |
Western blots
Proteins (50-70µg) were separated by electrophoresis in 12% sodium dodecyl sulfate-polyacrylamide gel electrophoresis gels and transferred to polyvinylidene difluoride and nitrocellulose membranes. Membranes were blocked with protein-free Tween 20 blocking buffer (37571, ThermoFisher) for 1 h and probed using primary antibodies. Membranes were incubated with primary antibodies (1:500 dilution) HK II (2867S, Cell Signaling Technology), LDHA (2012S, Cell Signaling Technology), mammalian target of rapamycin (mTOR) (2972S, Cell Signaling Technology), phosphorylated mammalian target of rapamycin (P-mTOR- Ser-2448) (5536S, Cell Signaling Technology), and β-actin (8457S, Cell Signaling Technology) overnight at 4°C. Membranes were also incubated with primary antibodies for vimentin (DSHB, dilution 1:300) and E-cadherin (701134, ThermoFisher, dilution 1:200) for 1 hour. After washing three times in Tris-buffered saline (TBS) (Bio-Rad), membranes were incubated with HRP-conjugated secondary antibodies (anti-rabbit 0711-625-152, or anti-mouse 115-625-146, 1:5000 dilution, Jackson ImmunoResearch Laboratories, Inc.) for 1 hour at room temperature and 37°C for vimentin and E-cadherin. Using the Odyssey infrared imaging system (LiCor) membranes were scanned, and bands quantified for HKII, LDHA, and P-mTOR. Vimentin and E- cadherin membranes were visualized using the Image Analyzer (Bio-Rad ChemiDoc MP Gel Imaging System) and quantified using ImageJ. Results presented are compared to mTOR (for p-mTOR), and β-actin loading controls.
Annexin apoptosis assay
MCF-7 and MDA-MB-231 cells were cultured until sub-confluent and then treated with MCM with and without calcitriol (control) for 24 hours. Control cells were grown in a DMEM culture medium. After 24 hours, the medium was removed from the wells, and 100μl of annexin V binding buffer was added (V13245, Invitrogen by Thermo Fisher Scientific) along with annexin V Alexa fluor 488 (V13245, Invitrogen by Thermo Fisher Scientific, 5μl in 100μl buffer) which indicates apoptosis. Cells were incubated for 15 minutes at room temperature. After removing the stain, 100μl of annexin V binding buffer was added. Images were acquired with a Nikon Eclipse motorized microscope (Nikon Instruments Inc.) using a GFP filter (488nm) at magnification 20x.
MTT assay
Cell viability / proliferation was measured using the 3-(4, 5-dimethy lthiazol-2- yl)-2, 5-diphenyl tetrazolium bromide (MTT) assay kit (Bio Vision k299-1000). The assay detects live cells’ signal by reducing the tetrazolium compound, which depends on the level of metabolic activation of the cells [11]. Cells were seeded at 2×10⁴ cells/well in 96-well plates and grown for 24 h in standard culture media. The cells were then treated with MCM alone (control), and MCM+Calcitriol for 24 h. After treatment, the medium was discarded, and cell viability was measured using the kit following the manufacturer’s instructions. The absorbance of the dye was measured at a wavelength of 590 nm using a microplate reader as previously described [38].
Molecular docking
The three-dimensional (3D-) structural coordinates of GLUT1, in complex with inhibitor [(2~[39])-3-(2-bromophenyl)-2-[2-(4-methoxyphenyl) ethanoyl amino]-~{N}-[(1~[39])-1-phenylethyl] propenamide] (PDB code: 5EQH) [40], and the 3D-structure of mTORC1 in complex with rapamycin (PDB code: 5FLC) [41], were taken from the RCSB protein databank. For docking, Molecular Operating Environment (MOE version 2020.0901) [42] was used. Initially protein files were prepared by Quick Prep module of MOE that complete the atomic valency of residues by adding protons and calculates partial charges according to a defined forcefield (Amber10: EHT force field). The structure of calcitriol was taken from PubChem (Compound ID: 5280453) in SDF format and imported into the MOE database where partial charges were added onto the structure, and it was minimized with an RMS gradient of 0.1RMS kcal/mol/Å. After the preparation of protein and ligand files, the docking performance was tested using a re-docking protocol by applying a Triangle Matcher docking algorithm and London dG scoring function. Following re-docking, calcitriol docking was carried out with the parameters outlined above. Later, the best docked pose was selected according to its docking score and protein-ligand interaction.
Statistical analysis
In this study, Student’s t-tests and one-way ANOVAs were used to make statistical comparisons between the groups. All values are reported as mean ± SEM. P values less than 0.05 were considered significant in all comparisons.
Results
Calcitriol reduced glycolytic protein and gene expression in breast cancer cells that were induced with macrophage conditioned medium (MCM)
Cancer cells rely on increased glucose utilization for survival and proliferation [20, 43]. However, metabolic shifting in the TME is not fully understood. We, therefore, evaluated the effects of calcitriol on glucose uptake and glycolysis in the TME. To model the in vivo TME, we stimulated breast cancer cells (MCF-7 and MDA-MB-231) with a control medium, macrophage-conditioned medium (MCM), and MCM+Calcitriol. We assessed whether calcitriol regulates macrophage-mediated glucose metabolism in breast cancer cells by analyzing the expression of proteins and genes implicated in glucose uptake (GLUT1) and glycolysis (HKII and LDHA) by Western blot and qRT-PCR. The MCM group of MCF-7 cells showed a trend of increasing GLUT1 protein expression compared to the control group (Fig. 1A). Interestingly, GLUT1 protein expression was significantly lower in the MCM+Calcitriol group as compared to the MCM (P<0.5, Fig. 1A) and control groups (P<0.5, Fig. 1A).
Similarly, GLUT1 protein expression was significantly higher in the MCM group compared to the control group of MDA-MB-231 cells (P<0.01, Fig.1B), while its expression was markedly suppressed in MCM+Calcitriol group in comparison to the MCM (P<0.01, Fig.1B) and control groups (P<0.05, Fig. 1B). The results suggest that the interaction between macrophages and cancer cells in the TME may be vital for GLUT1-mediated glucose transport to cancer cells.
Aberrant expression of GLUT1 not only promotes glucose transport but also enhances glycolysis which is critical for cancer cell growth and proliferation [44]. Next, we assessed whether calcitriol -mediated suppression of GLUT1 expression has any impact on glycolysis. We measured the expression of major glycolytic proteins, HKII and LDHA, by Western blot in breast cancer cells induced with both MCM and MCM+Calcitriol. We found that HKII and LDHA protein expressions were significantly higher (P>0.01, Fig. 1C) in the MCM group of MCF-7 cells compared to the control group. However, HKII and LDHA protein expression were significantly lower in the MCM+Calcitriol group when compared to the MCM group (P<0.01 and P<0.05, respectively; Fig. 1C). Similarly, we found significantly higher expression of both HKII and LDHA proteins in the MCM group than the control group of MDA-MB-231 cells (P<0.01 and P<0.05, respectively, Fig. 1D). As expected, HKII and LDHA protein expression were significantly lower in MCM+ Calcitriol group compared to MCM group (P<0.01 and P<0.05, respectively, Fig. 1D).
We also determined the impact of calcitriol treatment on glycolytic gene expression in breast cancer cells induced with MCM and MCM+Calcitriol. Similar to the glycolytic protein expression, HKII and LDHA gene expression was significantly higher in the MCM group of MCF-7 cells than the control group (P<0.05, Fig. 1E), while the GLUT1 gene expression tended to be higher in the MCM group compared to the control (Fig. 1E). Importantly, GLUT1, HKII, and LDHA gene expression were all significantly lower in the MCM+Calcitriol group compared to the MCM group of MCF-7 cells (P<0.05, P<0.05, and P<0.01, respectively, Fig. 1E).
GLUT1, HKII, and LDHA gene expression were also significantly higher in the MCM group compared to the control group of MDA-MB-231 cells (P<0.05, Fig. 1F). The expression of the HKII gene tended to be lower in the MCM+Calcitriol group than in the MCM group of MDA-MB-231 cells but was not statistically significant. Contrarily, GLUT1 and LDHA gene expression was significantly reduced in the MCM+Calcitriol group compared to the MCM group of MDA-MB-231 cells (P<0.5, Fig. 1F). These results indicate that calcitriol attenuates MCM-mediated induction of glycolysis in breast cancer cells by regulating the expressions of glycolytic proteins and genes.
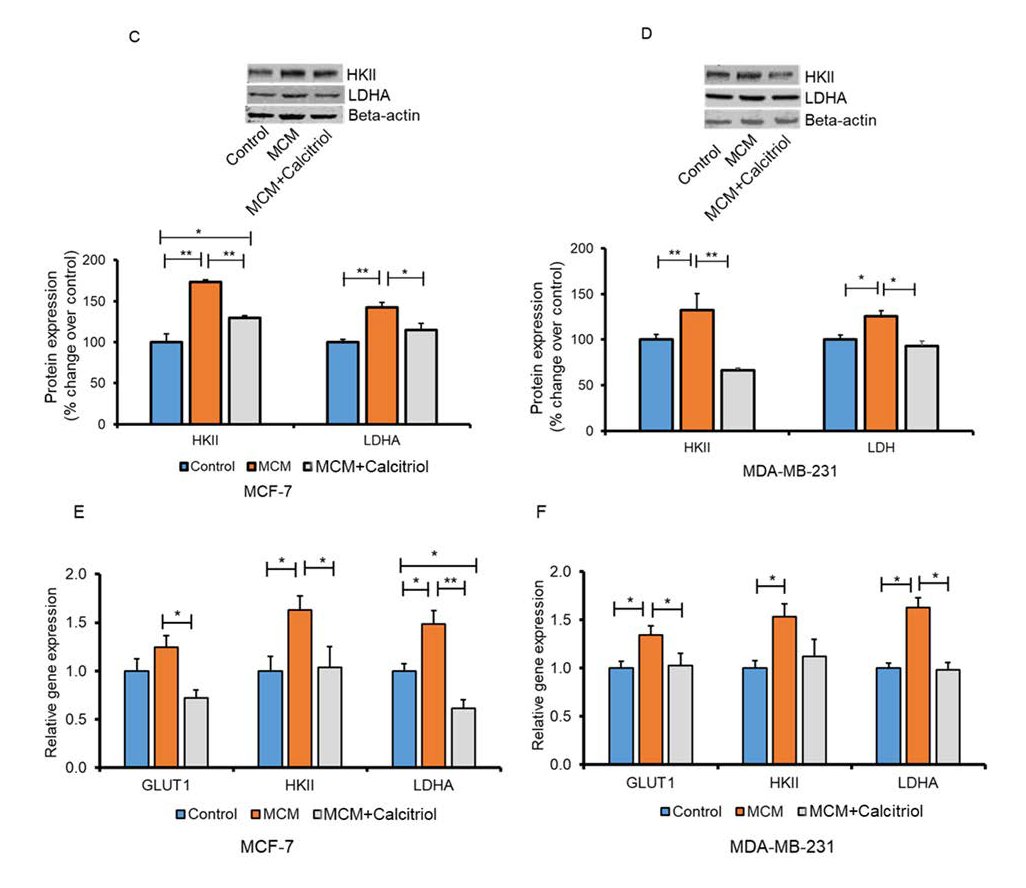
Fig. 1: Effects of calcitriol on GLUT1 protein expression in MCM induced MCF-7 (A) and MDA-MB-231 (B) Breast cancer cells. MCF-7 and MDA-MB231 breast cancer cells were induced with control medium, MCM and MCM+Calcitriol (0.5 µM) and the expression of GLUT1 protein was assessed by Western blot. Representative blots are shown. Data are mean ± SEM and expressed as percent change over control. N=3. *P<0.05 and **P<0.01 as tested by one-way ANOVA followed by Tukey's post hoc test. P values less than 0.05 were considered significant in all comparisons. (C-F). Effects of calcitriol on glycolytic protein and gene expression in MCM induced breast cancer cells. Immunoblots and densitometric values for glycolytic proteins in (C) MCF-7 and (D) MDA-MB-231 cells. Representative blots are shown. Data are mean ± SEM and expressed as percent change over control. N=3. *P<0.05 and **P<0.01 as tested by one-way ANOVA followed by Tukey's post hoc test. All comparisons were considered significant when P<0.05. Relative glycolytic gene expression in (E) MCF-7 and (F) MDA-MB-231 cells analyzed by qRT-PCR. N=3. *P<0.05 and **P<0.01 as tested by one-way ANOVA followed by Tukey's post hoc test. P values less than 0.05 were considered significant in all comparisons.
Calcitriol treatment decreased cell viability and Cyclin D1 gene expression in MCM-induced breast cancer cells
Studies showed that the co-culture of tumor cells with macrophages, can cause the proliferation of certain types of tumor cells [14, 15]. We checked the effects of calcitriol treatment on cell viability and the genes implicated in cell cycle progression in MCM-induced breast cancer cells. We found that breast cancer cells (MCF-7 and MDA-MB-231) in the MCM group demonstrated greater viability compared to the control group (Fig. 2A and 2B). However, these changes were only significant in MDA-MB-231 cells (P<0.05, Fig. 2B). Interestingly, viability was significantly reduced in MCM+Calcitriol within 48h of treatment compared to the MCM group of MCF-7 and MDA-MB-231 cells (P<0.01 and P<0.05, respectively, Fig. 2A and 2B).
Surprisingly, viability was also significantly lower in the MCM+Calcitriol group compared to the control of both MCF-7 and MDA-MB-231 cells (P>0.01, Fig. 2A and 2B).
Cyclin A1 and D1 are essential cell cycle regulators and can influence breast cancer proliferation and apoptosis [45, 46]. To assess whether the inhibitory effect of calcitriol on MCF-7 and MDA-MB-231 cell proliferation was attributed to cell-cycle arrest, we checked Cyclin A1 and Cyclin D1 gene expression in both MCM-induced MCF-7 and MDA-MB-231 cells. Cyclin D1 gene expression was significantly higher in the MCM group of MCF-7 (P>0.05, Fig. 2C) and MDA-MB-231(P>0.05, Fig. 2D) cells than in the control group. The Cyclin D1 gene expression was significantly lower in the MCM+Calcitriol group than in the MCM group of both MCF-7 (P<0.05, Fig. 2C) and MDA-MB-231 cells (P<0.05, Fig. 2D). Contrarily, Cyclin A1 gene expression was comparable among the groups in both cell lines and was not statistically significant (Fig. 2C and 2D). These results indicate that calcitriol-mediated suppression of Cyclin D1 may be responsible for reduced viability in both MCF-7 and MDA-MB-231 breast cancer cells.
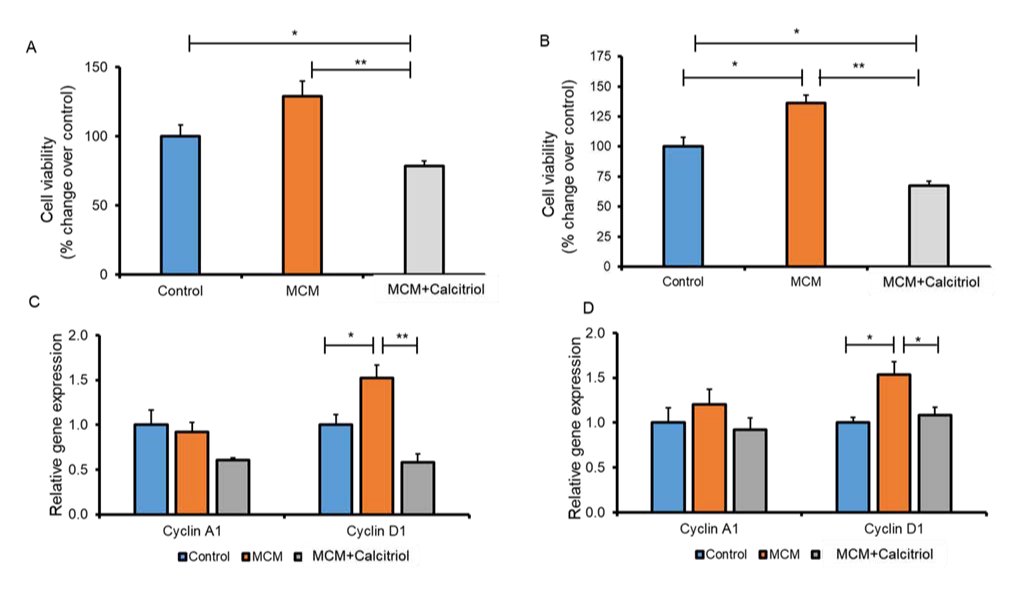
Fig. 2: Effect of calcitriol on cancer cell viability and cell regulatory gene expression. Viability in MCF-7 (A) and MDA-MB-231 (B) breast cancer cells. MCF-7 and MDA-MB-231 breast cancer cells were induced with a control medium, MCM, and MCM+Calcitriol (0.5 µM). Cell viability/proliferation were measured using the MTT (3-(4,5-dimethylthiazol-2-yl)-2,5-diphenyl tetrazolium bromide) assay kit (BioVision k299-1000). Data are mean ± SEM. N=3. * P<0.05 and **P<0.01 as tested by one-way ANOVA followed by Tukey's post hoc test. All comparisons were considered significant when P<0.05. C. Cell regulatory gene expression in C. MCF-7 and D. MDA-MB-231 cells analyzed by qRT-PCR. N=3. *P<0.05 and **P<0.01 as tested by one-way ANOVA followed by Tukey's post hoc test. P values less than 0.05 were considered significant in all comparisons.
Calcitriol treatment increased apoptosis in MCM-stimulated breast cancer cells
The presence of macrophages in the TME increases the potential for metastasis by promoting apoptosis in an aggressive tumor [16]. Also, TAM polarization in the TME correlated with increased proliferation, angiogenesis, and decreased apoptosis [17]. Here, to understand the role of calcitriol in macrophage-mediated breast cancer apoptosis, we performed the Annexin V assay on MCF-7 and MDA-MB-231 cells. We induced these breast cancer cells with MCM and MCM+Calcitriol. We found that the apoptosis rate was comparable between control and MCM groups in both MCF-7 and MDA-MB-231 cells (Fig. 3A and 3B). However, MCF-7 and MDA-MB-231 cells in the MCM+Calcitriol group underwent higher levels of apoptosis than those in the MCM group (P<0.05, Fig. 3A and 3B). More importantly, the apoptosis rate was even significantly higher in the MCM+Calcitriol group than in control of both breast cancer cell lines (*P<0.05, Fig. 3A and 3B).
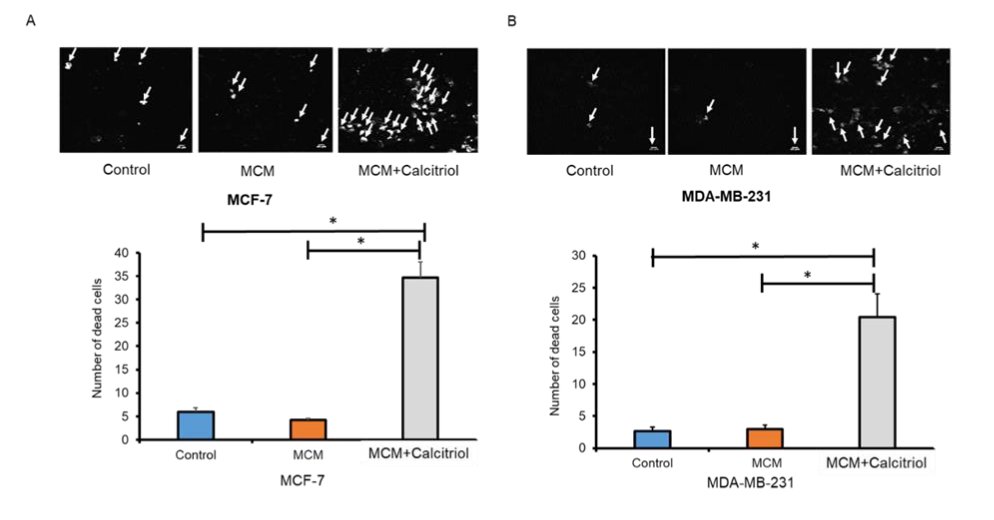
Fig. 3: Effects of calcitriol on apoptosis in MCM-induced breast cancer cells. Apoptosis was measured by FITC Annexin V Apoptosis Detection Kit I (BD Biosciences) in (A) MCF-7, and (B) MDA-MB-231 cells. Representative images are shown. White arrows indicate Annexin V positive cells (dead cells) by the presence of phosphatidylserine at the outer cell membrane. Data are mean ± SEM and expressed as percent change over control. N=3. *P < 0.05 and **P < 0.01 as tested by one-way ANOVA followed by Tukey's post hoc test. P values less than 0.05 were considered significant in all comparisons.
Calcitriol mitigated MCM-mediated activation of mTOR in breast cancer cells
In addition to controlling macrophage differentiation, mTOR plays an essential role in regulating the metabolism and proliferation of cancer cells [27, 47]. To assess mTOR activation in the TME, MCF-7 and MDA-MB-231 breast cancer cells were induced with MCM and MCM+Calcitriol and evaluated the expression of P-mTOR-Ser-2448 protein by Western blot. P-mTOR protein expression was significantly higher in the MCM group compared to the control group of both MCF-7 and MDA-MB-231 cells (*P>0.01 Fig. 4A and 4B). Importantly, P-mTOR protein expression was significantly lower in the MCM+Calcitriol group than in the MCM groups of MCF-7 and MDA-MB-231 cells (P>0.01, Fig. 4A and 4B). These results support the notion that calcitriol may regulate macrophage-mediated breast cancer progression by inhibiting mTOR activation.
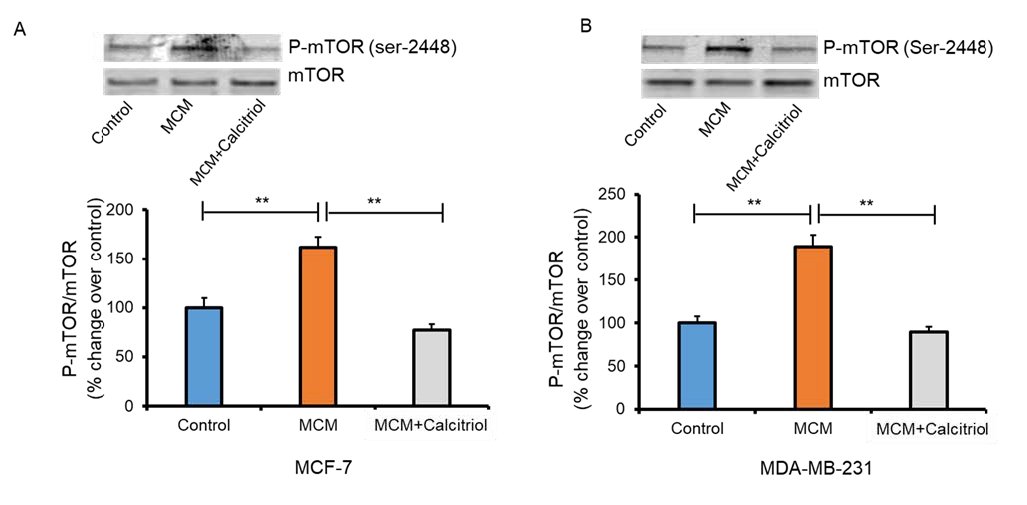
Fig. 4: Effects of calcitriol on mTOR activation in MCM-induced breast cancer cells. Immunoblots and densitometric values for P-mTOR (Ser 2448) in (A) MCF-7 and (B) MDA-MB-231 cells. Representative blots are shown. Data are mean ± SEM and expressed as percent change over control. N=3. *P < 0.05 and **P < 0.01 as tested by one-way ANOVA followed by Tukey's post hoc test. All comparisons were considered significant when P < 0.05.
Molecular docking results
The present study found calcitriol-mediated suppression of GLUT1, which is involved in glucose import into the cytoplasm, in MCM-induced cancer cells. We then conducted docking studies to assess the binding type and interactions of calcitriol to the ligand-binding site of GLUT1. Initially, re-docking of the co-crystallized ligand was performed, which showed RMSD of 1.81Å between the best-docked orientation and the X-ray conformation of the native ligand (Fig. S1, supporting information) with a docking score of -8.39kcal/mol. Then the ligand (calcitriol) was docked at the GLUT1 binding site, which is composed of Phe26, Thr30, Ser80, Val83, Gly134, Thr137, Pro141, His160, Gln161, Ile164, Val165, Gln279, Gln282, Gln283, Ile287, Asn288, Phe379, Glu380, Gly384, Pro385, Trp380, Ala392, Ile404, Ala405, Ala407, Gly408, Asn411, and Trp412. During docking, calcitriol produced good binding interaction with the surrounding residues, including Ser80, Thr137, and Glu380. The ring substituted -OH groups mediated H-bonds with the backbone carbonyl oxygen of Ser80 and Thr137 at 2.12Å and 1.83Å, respectively. Whereas it’s terminal -OH group formed H-bond with the then side chain of Glu380 at 1.70Å. The docking score of the compound is -8.60kcal/mol. The docked view of the compound is shown in Fig. 5A.
We also conducted docking analysis to evaluate the interaction between calcitriol and mTORC1. Evidence suggests that mTOR phosphorylation at ser-2448 is necessary for proper function of mTORC1 [48]. At first, rapamycin was re-docked at its binding site in the 3D-structure of mTOR, which showed good results with RMSD 1.81Å (Fig. S2) between docked and native conformation with a docking score of -8.06kcal/mol. Thus, calcitriol was docked at rapamycin binding site. When docked at the ligand binding site of mTOR, the calcitriol molecule formed H-bonds with Arg2102 and Asp2102. The side chain of Arg2042 mediated a H-bond with the terminal -OH of compound at 2.17Å, whereas one of the -OH substituted at ring of calcitriol formed a H-bond with the side chain of Asp2102 at 2.11Å. The docking score of calcitriol at mTOR binding site (i.e., -6.79kcal/mol) is slightly lower than its docking score at GLUT1 binding site. However, the binding interactions suggest that calcitriol can efficiently bind with the binding sites of both targets. The docked orientation of calcitriol at mTOR binding site is depicted in Fig. 5B.
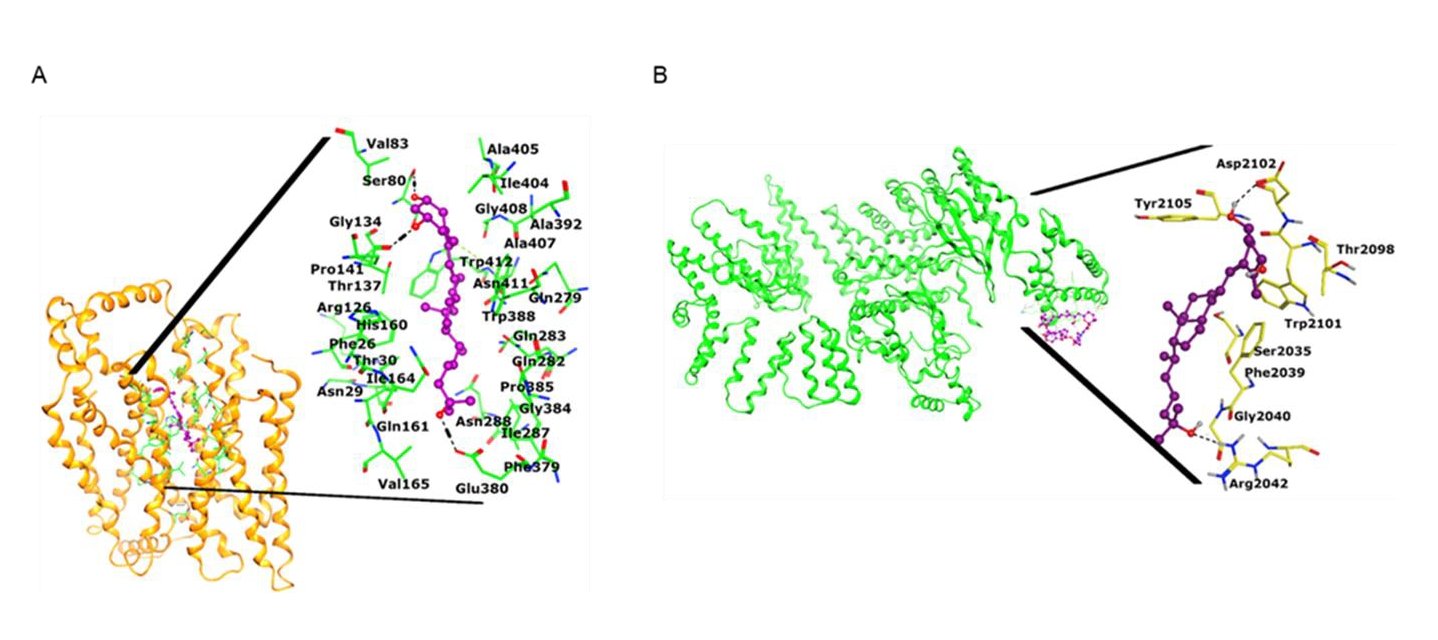
Fig. 5: Docking analysis to evaluate the interaction between calcitriol and mTORC1. a) The docked view of calcitriol is shown in the ligand binding site of GLUT1 (shown in gold ribbon). The binding mode of compound is highlighted. The interacting residues are presented in green sticks, ligand is depicted in magenta ball and stick model, H-bonds are displayed in black dotted lines, hydrophobic interaction is shown in green dotted lines. b) The 3D-structure of mTOR (presented in green ribbon) is shown in complex with rapamycin (magenta is shown. The docked view of calcitriol is highlighted, where ligand is displayed in purple ball and stick model, active site residues are shown in yellow stick model, and H-bonds are depicted in black dotted lines.
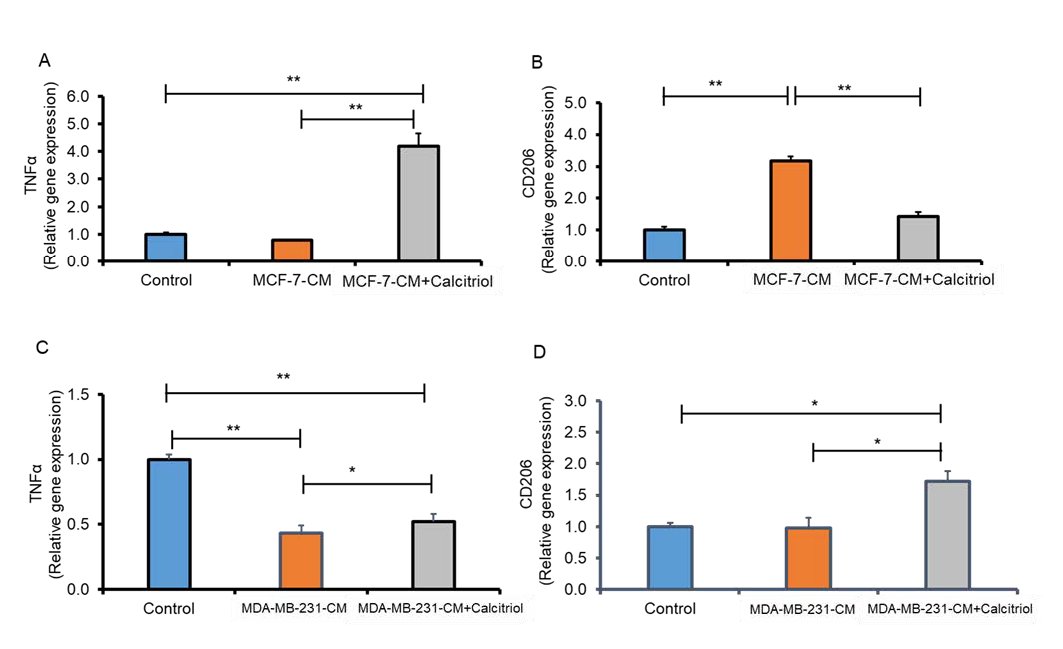
Fig. 6: Calcitriol reduced CCM-mediated M2 polarization of macrophages. Relative gene expression of TNF alpha and CD206 in MCF-7 (A-B) and (C-D) MDA-MB-231 cells analyzed by qRT-PCR. N=3. *P < 0.05 and **P < 0.01 as tested by one-way ANOVA followed by Tukey's post hoc test. P values less than 0.05 were considered significant in all comparisons.
Cancer cell conditioned medium (CCM)-mediated M2 polarization of macrophages was reduced by calcitriol
There was evidence that cancer cell conditioned medium (CCM) induced polarization of M2 macrophages [49]. Moreover, cancer cells can also influence macrophage polarization in the TME by releasing metabolites like lactate [50]. THP-1-derived macrophages were induced with CCM, collected from MCF-7 and MDA-MB-231 cells and with calcitriol. We assessed whether calcitriol alters macrophage phenotype by analyzing M1 (TNFα) and M2 (CD206) signature genes in these macrophages by qRT-PCR. We found lower expression of the M1 marker, TNFα expression (Fig. 6A), and significantly higher M2 marker CD206 expression (P<0.05, Fig. 6B) in the MCF-7-CM group compared to the control group. However, calcitriol treatment significantly increased M1 marker TNFα (P<0.05, Fig. 6A) expression and decreased M2 marker CD206 (P<0.05, Fig. 6B) in THP-1 monocyte-derived macrophages induced with MCF-7-CM. Similarly, macrophages induced with MDA-MB-231 conditioned media (MDA-MB-231-CM) showed significantly lower TNFα expression (P<0.05, Fig. 6C) and exhibited higher CD206 expression compared to control (Fig. 6D). However, calcitriol treatment significantly increased TNFα expression (P<0.05. Fig. 6C) and decreased CD206 expression significantly (P<0.05, Fig. 6D) in macrophages induced with MDA-MB-231-CM. Based on these findings, calcitriol may play a critical role in inhibiting breast cancer progression by reducing M2 macrophage polarization in the tumor microenvironment.
Discussion
Using conditioned medium from breast cancer cells (CCMs) and macrophages (MCMs), the tumor microenvironment was simulated in vitro by cultivating macrophages and cancer cells separately in these media. The results revealed that calcitriol reduces the expression of proteins and genes implicated in glycolysis in both low metastatic potential MCF-7 breast cancer cells and highly metastatic MDA-MB-231 breast cancer cells, induced with THP-1 monocyte-derived macrophage conditioned medium (MCM). We also found that calcitriol suppressed cell viability and Cyclin D1 gene expression, increased apoptosis, and was concurrent with a reduction of mTOR activation (P-mTOR levels) in MCM induced breast cancer cells. Importantly, molecular docking studies further demonstrated that calcitriol significantly docks with both GLUT1 and mTORC1. In addition, calcitriol suppressed cancer cell conditioned medium, mediated induction of M2 polarization by decreasing the M2 marker CD206 and increased M1 polarization marker TNF1α in THP1-derived macrophages. To our knowledge, this is the first study to demonstrate that calcitriol inhibits macrophage-mediated breast cancer progression by regulating glycolysis and mTOR activation in vitro.
An altered energy metabolism is one of the hallmarks of cancer. The Warburg effect (aerobic glycolysis) occurs even though cancer cells have sufficient oxygen [19, 51]. This aerobic glycolysis not only supports the growth of tumors but also maintains a TME with low pH, helping the cancer cells to proliferate [20, 52]. Substantial evidence supports that TAMs can alter the metabolic pattern of cancer cells in the TME. Generally, TAMs promote aerobic glycolysis [22, 53, 54]. Lin et al. reported that lactate-activated macrophages increased glycolysis and promoted EMT in breast cancer [52]. Based on our present results, calcitriol attenuated macrophage-conditioned medium mediated induction of glycolysis in breast cancer cells by significantly reducing glycolysis-associated proteins and genes. Importantly, calcitriol reduced GLUT1 expression in MCM-induced breast cancer cells. Evidence suggests that GLUT1 causes cancer cells to proliferate, migrate, invade, and metastasize [55, 56]. A study has shown that GLUT1 antibodies inhibit cancer cell proliferation [57]. Cancer cell growth is also reduced by other GLUT inhibitors and glucose transport inhibitors, such as fasentin [58] and phloretin [59]. The findings that calcitriol inhibits glycolysis in MCM-stimulated breast cancer cells by suppressing gene and protein expression of GLUT1, as well as the docking result showing that calcitriol binds effectively with GLUT1, are significant. This calcitriol-mediated suppression of GLUT1 may decrease glucose uptake and cause glucose deprivation, resulting in cancer cell growth inhibition and death [60, 61].
TAM polarization in the TME has been found to correlate with increased proliferation, angiogenesis, and decreased apoptosis of cancer cells [17, 62]. TAMs that are the M2 type protect cancer cells from apoptosis compared to TAMs that are the M1 type [23, 63]. In vitro , chloroquine (CQ) induces apoptosis in mouse breast cancer and prolongs the animals’ survival in vivo by down-regulating TAMs in the TME [64]. Kaler et al. showed that calcitriol sensitizes tumor cells to TRAIL-induced apoptosis when cultured with macrophages [65]. We previously showed that calcitriol reduced mTOR activation and cell viability in breast cancer cells via induction of apoptosis [32]. We have found here that calcitriol reversed cancer cell-mediated induction of M2 polarization by decreasing CD206 gene expression, a M2 marker, and increasing TNF1α gene expression, a M1 marker. Furthermore, calcitriol mitigated MCM-mediated induction of breast cancer apoptosis and proliferation on MCF-7 and MDA-MB-231 cells. The suppression of M2 macrophage polarization by calcitriol and subsequent increase in M1 polarization may promote apoptosis and inhibit breast cancer progression.
To better understand how calcitriol inhibits macrophage-mediated glycolysis by promoting apoptosis and reverses cancer cell-mediated macrophage polarization, mTOR activation was analyzed and P-mTOR levels were measured. In cancer cells, mTOR signaling controls growth and metabolism [66]. Emerging evidence suggests that mTOR is also critical in macrophage differentiation and activation in the tumor microenvironment [67, 68]. Several studies have shown that mTOR plays a crucial role in the TAM-mediated proliferation of cancer cells. Wang et al. reported that Methionine enkephalin (MENK) inhibits human gastric cancer proliferation by regulating TAMs and inducing apoptosis via inhibiting PI3K/AKT/mTOR signaling pathway [69, 70]. TAMs promoted endocrine resistance in breast cancer by activating the mTOR pathway [71]. Our present results of calcitriol-mediated suppression of mTOR activation in MCM-induced MCF-7 and MDA-MB-231 cancer cells, subsequent promotion of apoptosis, decreased cell viability, and reduction of glycolytic gene and protein expression are significant. It is possible that by suppressing mTOR activation in the TME, calcitriol may reverse/reduce glycolysis and promote apoptosis in cancer cells. Additionally, calcitriol-mediated changes in macrophage polarization in the TME may have an association with the reduction of mTOR activation. However, the tumor environment contains other immune cells, including T-cells, Tregs, dendritic cells. Thus, it is possible that mTOR may have modulated these immune cell functions differently. The role of mTOR in the TME and its impact on breast tumor progression requires more research. Further, in vivo studies are warranted to obtain a more comprehensive understanding of the tumor microenvironment.
We found that calcitriol suppressed glucose transporter GLUT1 and glycolytic proteins and genes and inhibited mTOR activation in MCM-induced cancer cells. Additionally, calcitriol reduced CD206 and increased TNFα gene expression in cancer cell conditioned medium-induced macrophages. How calcitriol regulates these genes in the TME is unclear. Calcitriol may exert its genomic effects by binding to the vitamin D receptor (VDR) and then regulating the transcription of genes which are implicated in various cellular process [72-74]. Also, calcitriol can potentiate its effects via non-genomic mechanisms by affecting various signaling pathways, including NFκB, STAT, and wingless (WNT), as well as regulation of protein disulfide-isomerase A3 (PDIA3) [74]. The present study didn’t analyze VDR protein or gene expression. Thus, it is unclear whether calcitriol-mediated regulation of GLUT1 and mTOR protein expression was mediated via a genomic or non-genomic pathway. Our molecular docking results showed a direct binding of the calcitriol to the active sites of GLUT1 and mTORC1. More importantly, studies on serum vitamin D level, VDR expression, and breast cancer progression and survival have produced mixed results [75, 76]. To maintain bone health, serum 25(OH)D3 concentrations of 20 ng/mL are considered adequate. In contrast, vitamin D at higher concentrations (40-50 ng/mL) may have extraskeletal benefits, including anticancer activity [77]. The affinity of 1, 25(OH)2D3 for VDR was found to be 0.1 nmol/L and for PDIA3 to be 1 nmol/L [78]. Hence, it might be conceivable that higher doses of vitamin D supplementation and higher serum concentrations of 25(OH)D3 (at least 30 ng/mL) are necessary for effective induction of nongenomic pathways. It is also unknown what is the effective vitamin D doses for regulating macrophages’ detrimental effects on breast cancer in tumor microenvironment. The present study uses a high dose of calcitriol (0.5 µM). It is thus reasonable to assume that the observed effects may be caused by non-genomic pathways. For clarification, however, there is a need for more preclinical and clinical studies.
The present study showed the role of calcitriol as a potential anti-cancer agent, but it has some limitations. A TME was mimicked in vitro using the conditioned medium collected from breast cancer cells (CCM) and macrophages (MCM), which were then used to grow macrophages and cancer cells individually. Co-culturing MCF-7 and MDA-MB-231 cells with THP-1-derived macrophages, may have more closely mimicked the TME interactions. While evaluating expressions of M1 and M2 markers on THP-1 monocyte-derived macrophages induced with CCM, we analyzed one gene each for M1 and M2 polarization. To get a more accurate picture of macrophage polarization in TME, analysis of more than two genes may be necessary. As a result, future studies must examine more genes associated with M1 and M2 polarization to clarify this issue.
Conclusion
Calcitriol reduced the expression of glycolytic genes and proteins, genes implicated in cell cycle regulation, and promoted apoptosis in MCM-induced low metastatic MCF-7 and high metastatic MDA-MB-231 breast cancer cells. Calcitriol also reversed cancer cell-mediated induction of M2 polarization and increased M1 polarization in THP1-derived macrophages. More importantly, calcitriol reduced mTOR activation in MCM-induced cancer cells [Fig. 7]. Our molecular docking studies revealed efficient binding of calcitriol to GLUT1 and mTORC1. According to these findings, calcitriol may inhibit the activation of mTOR, glycolysis, and macrophages within the TME, which are known to contribute to breast cancer progression. In vivo studies are needed to confirm these findings.
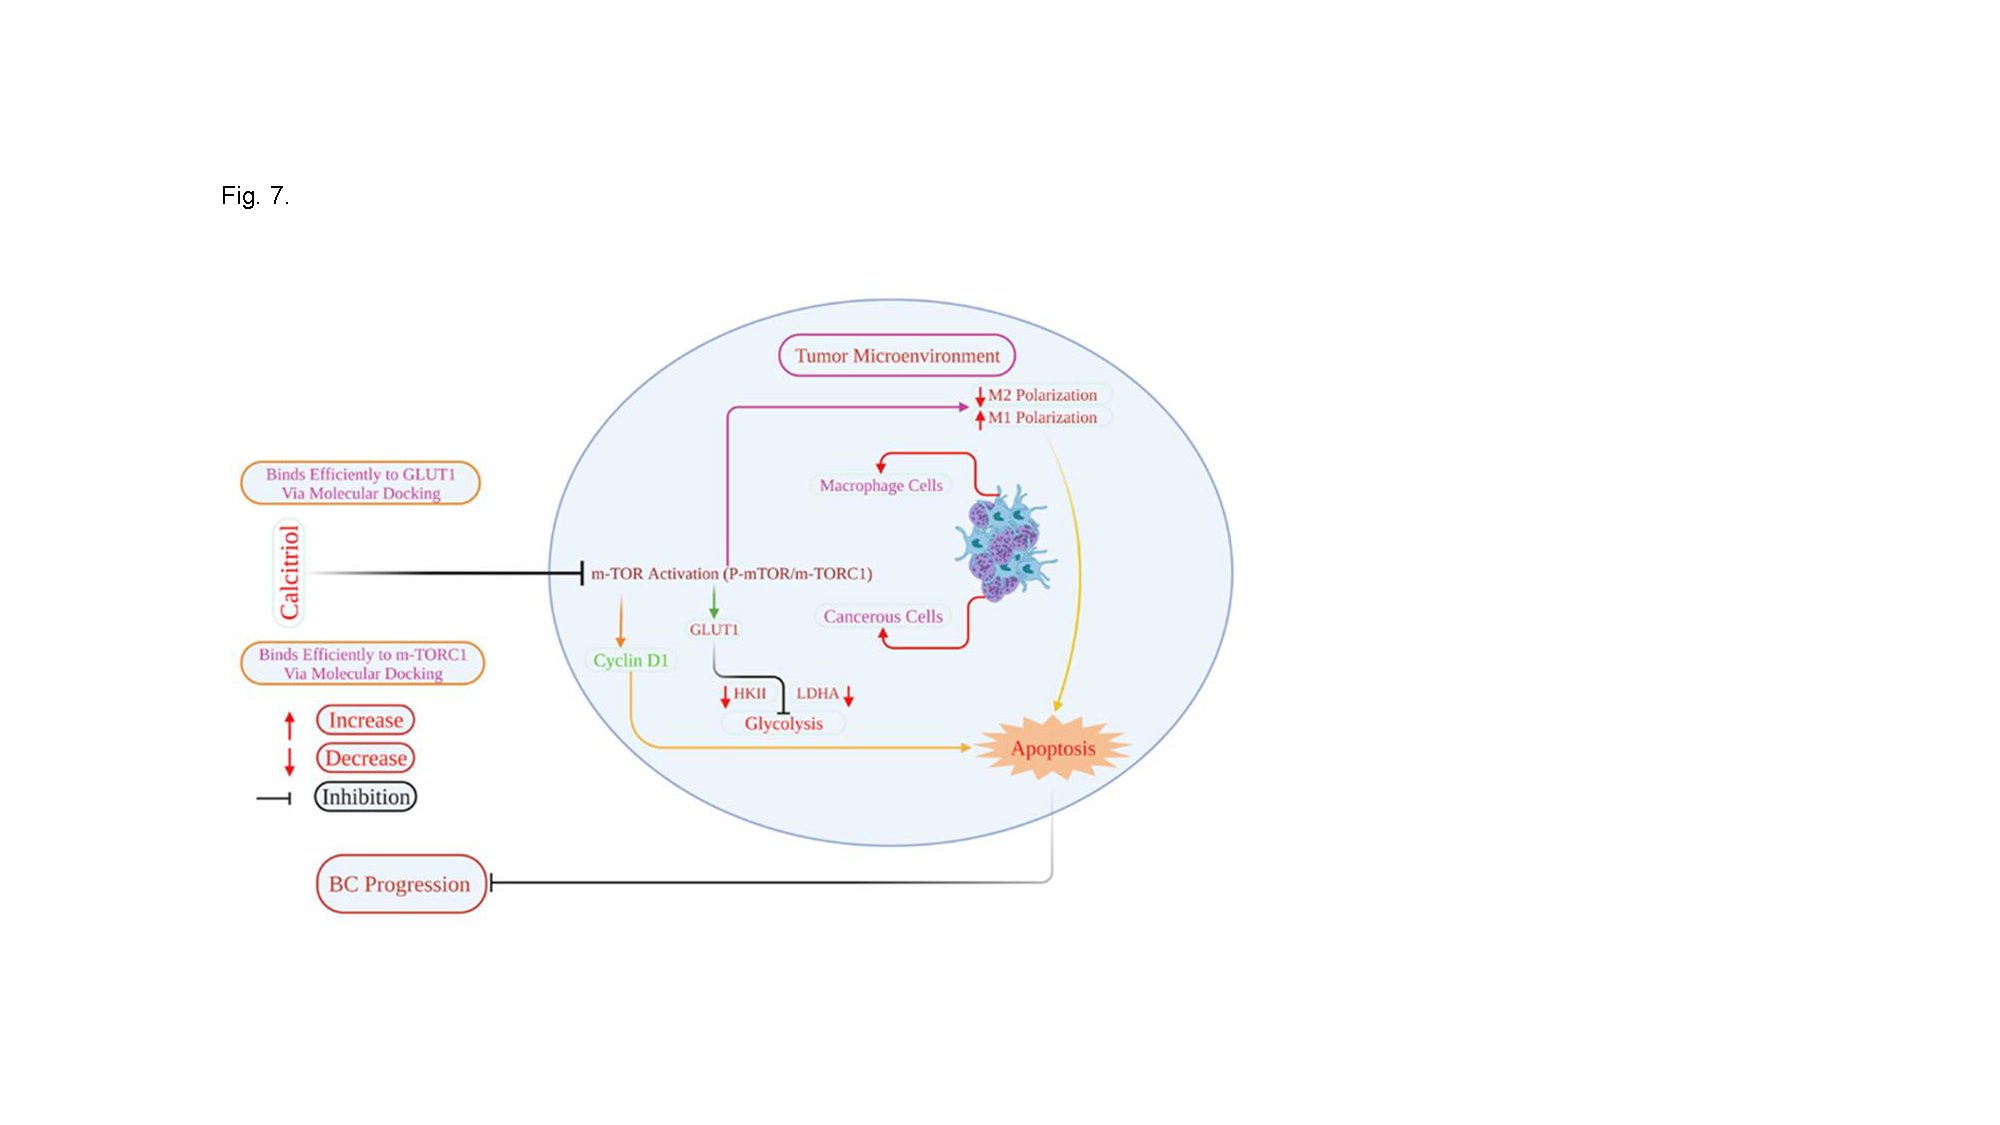
Fig. 7: Schematic presentation of how calcitriol regulates breast cancer cell and macrophage function in the tumor microenvironment. Calcitriol by suppressing mTOR activation may attenuate MCM-mediated induction of glycolysis and enhanced apoptosis and may inhibit BC progression. Additionally, calcitriol may regulate macrophage M2 macrophage polarization in the TME.
Abbrevations
TME; tumor (microenvironment, TAMs; tumor-associated macrophages, MCM; CCM; cancer cell conditioned medium, MCM; macrophage conditioned medium, GLUT1; glucose transporter 1, HKII; hexokinase II, LDHA; lactate Dehydrogenase A, mTOR; The mammalian target of rapamycin).
Acknowledgements
We would like to thank Zeina Khan for her excellent technical support.
Author Contributions
Maliha Tabassum Munir: Performed the experiments, Statistical analysis, Writing- Original draft preparation, read and approved the final manuscript. Julianna Maria Santos : Performed the experiments, Methodology, Data curation, read and approved the final manuscript. Sobia Ahsan Halim: Performed the experiments, Methodology, Data curation, Writing - review & editing, read and approved the final manuscript. Faizullah Khan: Methodology, Statistical analysis, read and approved the final manuscript. Md Mizanur Rahman: Methodology, Statistical analysis, read and approved the final manuscript. Ajmal Khan: Methodology, Writing - review & editing, read and approved the final manuscript. Ahmed Al-Harrasi: Conceptualization, Writing - review & editing, read and approved the final manuscript. Fazle Hussain: Writing - review & editing, read and approved the final manuscript. Lauren S. Gollahon: Writing - review & editing, read and approved the final manuscript. Shaikh Mizanoor Rahman: Conceptualization, Methodology, Statistical analysis, Writing- Original draft preparation, Writing - review & editing, Supervision, read and approved the final manuscript.
Funding Sources
This study was partially supported by a grant from the University of Nizwa (A/2021-2022-UoN/2/ NMSRC/IF), Sultanate of Oman.
Statement of Ethics
Not applicable.
Disclosure Statement
The authors don’t have any conflict of interest.
References
| 1 | Solinas G, Germano G, Mantovani A, Allavena P: Tumor-associated macrophages (TAM) as major players of the cancer-related inflammation. J Leukoc Biol 2009;86:1065-1073.
https://doi.org/10.1189/jlb.0609385 |
| 2 | Liu Y, Cao X: The origin and function of tumor-associated macrophages. Cell Mol Immunol 2015;12:1-4.
https://doi.org/10.1038/cmi.2014.83 |
| 3 | Guo Q, Jin Z, Yuan Y, Liu R, Xu T, Wei H, Xu X, He S, Chen S, Shi Z: New mechanisms of tumor-associated macrophages on promoting tumor progression: recent research advances and potential targets for tumor immunotherapy. J Immunol Res 2016;2016:9720912
https://doi.org/10.1155/2016/9720912 |
| 4 | Mantovani A, Sozzani S, Locati M., Allavena P, Sica A: Macrophage polarization: tumor-associated macrophages as a paradigm for polarized M2 mononuclear phagocytes. Trends Immunol 2002;23:549-555.
https://doi.org/10.1016/S1471-4906(02)02302-5 |
| 5 | Munir MT, Kay MK, Kang MH, Rahman MM, Al-Harrasi A, Choudhury M, Moustaid-Moussa N, Hussain F, Rahman SM: Tumor-associated macrophages as multifaceted regulators of breast tumor growth. Int J Mol Sci 2021;22:6526.
https://doi.org/10.3390/ijms22126526 |
| 6 | Chanmee T, Ontong P, Konno K, Itano N: Tumor-associated macrophages as major players in the tumor microenvironment. Cancers 2014;6:1670-1690.
https://doi.org/10.3390/cancers6031670 |
| 7 | Komohara Y, Fujiwara Y, Ohnishi K, Takeya M: Tumor-associated macrophages: Potential therapeutic targets for anti-cancer therapy. Adv Drug Deliv Rev 2016;99:180-185.
https://doi.org/10.1016/j.addr.2015.11.009 |
| 8 | Zhang Q-w, Liu L, Gong C-y, Shi H-s, Zeng Y-h, Wang X-z, Zhao Y-w, Wei Y-q: Prognostic significance of tumor-associated macrophages in solid tumor: a meta-analysis of the literature. PloS one 2012;7:e50946.
https://doi.org/10.1371/journal.pone.0050946 |
| 9 | Joyce JA, Pollard JW: Microenvironmental regulation of metastasis. Nat Rev Cancer 2009;9:239-252.
https://doi.org/10.1038/nrc2618 |
| 10 | Li H, Yang P, Wang J, Zhang J, Ma Q, Jiang Y, Wu Y, Han T, Xiang D: HLF regulates ferroptosis, development and chemoresistance of triple-negative breast cancer by activating tumor cell-macrophage crosstalk. J Hematol Oncol 2022;15:1-6.
https://doi.org/10.1186/s13045-021-01223-x |
| 11 | Mehta AK, Cheney EM, Hartl CA, Pantelidou C, Oliwa M, Castrillon JA, Lin J-R, Hurst KE, de Oliveira Taveira M, Johnson NT: Targeting immunosuppressive macrophages overcomes PARP inhibitor resistance in BRCA1-associated triple-negative breast cancer. Nat Cancer 2021;2:66-82.
https://doi.org/10.1038/s43018-020-00148-7 |
| 12 | Kitamura T, Qian B-Z, Soong D, Cassetta L, Noy R, Sugano G, Kato Y, Li J, Pollard JW: CCL2-induced chemokine cascade promotes breast cancer metastasis by enhancing retention of metastasis-associated macrophages. J Exp Med 2015;212:1043-1059.
https://doi.org/10.1084/jem.20141836 |
| 13 | Xu Y, Chen L, Jiang Y-X, Yang Y, Zhang D-D: Regulatory effect and relevant mechanisms of fraction from heat-clearing and detoxifying herb couplet on macrophage M1/M2 phenotypes. Zhongguo Zhong yao za zhi= Zhongguo Zhongyao Zazhi= China Journal of Chinese Materia Medica 2018;43:3722-3728. |
| 14 | Ball MS, Bhandari R, Torres GM, Martyanov V, ElTanbouly MA, Archambault K, Whitfield ML, Liby KT, Pioli PA: CDDO-Me alters the tumor microenvironment in estrogen receptor negative breast cancer. Sci Rep 2020;10:1-10.
https://doi.org/10.1038/s41598-020-63482-x |
| 15 | Essandoh K, Li Y, Huo J, Fan G-C: MiRNA-mediated macrophage polarization and its potential role in the regulation of inflammatory response. Shock (Augusta, Ga) 2016;46:122.
https://doi.org/10.1097/SHK.0000000000000604 |
| 16 | Zheng Y, Wang N, Wang S, Yang B, Situ H, Zhong L, Lin Y, Wang Z: XIAOPI formula inhibits the pre-metastatic niche formation in breast cancer via suppressing TAMs/CXCL1 signaling. Cell Commun Signal 2020;18:1-17.
https://doi.org/10.1186/s12964-020-0520-6 |
| 17 | Wang N, Zheng Y, Gu J, Cai Y, Wang S, Zhang F, Chen J, Situ H, Lin Y, Wang Z: Network-pharmacology-based validation of TAMS/CXCL-1 as key mediator of XIAOPI formula preventing breast cancer development and metastasis. Sci Rep 2017;7:1-15.
https://doi.org/10.1038/s41598-017-15030-3 |
| 18 | Wang W, Liu Y, Guo J, He H, Mi X, Chen C, Xie J, Wang S, Wu P, Cao F: miR-100 maintains phenotype of tumor-associated macrophages by targeting mTOR to promote tumor metastasis via Stat5a/IL-1ra pathway in mouse breast cancer. Oncogenesis 2018;7:1-17.
https://doi.org/10.1038/s41389-018-0106-y |
| 19 | Otto W: On the origin of cancer cells. Science 1956;123:309-314.
https://doi.org/10.1126/science.123.3191.309 |
| 20 | Wu Z, Wu J, Zhao Q, Fu S, Jin J: Emerging roles of aerobic glycolysis in breast cancer. Clinical and Translational Oncology 2020;22:631-646.
https://doi.org/10.1007/s12094-019-02187-8 |
| 21 | Kroemer G, Pouyssegur J: Tumor cell metabolism: cancer's Achilles' heel. Cancer cell 2008;13:472-482.
https://doi.org/10.1016/j.ccr.2008.05.005 |
| 22 | Guillaumond F, Leca J, Olivares O, Lavaut M-N, Vidal N, Berthezène P, Dusetti NJ, Loncle C, Calvo E, Turrini O: Strengthened glycolysis under hypoxia supports tumor symbiosis and hexosamine biosynthesis in pancreatic adenocarcinoma. PNAS 2013;110:3919-3924.
https://doi.org/10.1073/pnas.1219555110 |
| 23 | Liang C, Qin Y, Zhang B, Ji S, Shi S, Xu W, Liu J, Xiang J, Liang D, Hu Q: ARF6, induced by mutant Kras, promotes proliferation and Warburg effect in pancreatic cancer. Cancer Lett 2017;388:303-311.
https://doi.org/10.1016/j.canlet.2016.12.014 |
| 24 | Hua H, Kong Q, Zhang H, Wang J, Luo T, Jiang Y: Targeting mTOR for cancer therapy. J Hematol Oncol2019;12:1-19.
https://doi.org/10.1186/s13045-019-0754-1 |
| 25 | Su S, Liu Q, Chen J, Chen J, Chen F, He C, Huang D, Wu W, Lin L, Huang W: A positive feedback loop between mesenchymal-like cancer cells and macrophages is essential to breast cancer metastasis. Cancer Cell 2014;25:605-620.
https://doi.org/10.1016/j.ccr.2014.03.021 |
| 26 | Chen W, Ma T, Shen X-n, Xia X-f, Xu G-d, Bai X-l, Liang T-b: Macrophage-Induced Tumor Angiogenesis Is Regulated by the TSC2-mTOR PathwayTSC2-mTOR Regulates Macrophage-Induced Tumor Angiogenesis. Cancer Res 2012;72:1363-1372.
https://doi.org/10.1158/0008-5472.CAN-11-2684 |
| 27 | Pópulo H, Lopes JM, Soares P: The mTOR signalling pathway in human cancer. Int J Mol Sci 2012;13:1886-1918.
https://doi.org/10.3390/ijms13021886 |
| 28 | Conciatori F, Bazzichetto C, Falcone I, Pilotto S, Bria E, Cognetti F, Milella M, Ciuffreda L: Role of mTOR signaling in tumor microenvironment: an overview. Int J Mol Sci 2018;19:2453.
https://doi.org/10.3390/ijms19082453 |
| 29 | Estébanez N, Gómez-Acebo I, Palazuelos C, Llorca J, Dierssen-Sotos T: Vitamin D exposure and Risk of Breast Cancer: a meta-analysis. Sci Rep 2018;8:1-13.
https://doi.org/10.1038/s41598-018-27297-1 |
| 30 | Krishnan AV, Trump DL, Johnson CS, Feldman D: The role of vitamin D in cancer prevention and treatment. Endocrinol Metab Clin North Am 2010;39:401-418
https://doi.org/10.1016/j.ecl.2010.02.011 |
| 31 | Mawer EB, Walls J, Howell A, Davies M, Ratcliffe WA, Bundred NJ: Serum 1, 25-dihydroxyvitamin D may be related inversely to disease activity in breast cancer patients with bone metastases. J Clin Endocrinol Metab 1997;82:118-122.
https://doi.org/10.1210/jc.82.1.118 |
| 32 | Santos JM, Khan ZS, Munir MT, Tarafdar K, Rahman SM, Hussain F: Vitamin D3 decreases glycolysis and invasiveness, and increases cellular stiffness in breast cancer cells. J Nutr Biochem 2018;53:111-120.
https://doi.org/10.1016/j.jnutbio.2017.10.013 |
| 33 | Varin A, Gordon S: Alternative activation of macrophages: immune function and cellular biology. Immunobiology 2009;214:630-641.
https://doi.org/10.1016/j.imbio.2008.11.009 |
| 34 | Singh R, Shankar BS, Sainis KB: TGF-β1-ROS-ATM-CREB signaling axis in macrophage mediated migration of human breast cancer MCF7 cells. Cell Signal 2014;26:1604-1615.
https://doi.org/10.1016/j.cellsig.2014.03.028 |
| 35 | Hsieh C-C, Wang C-H: Aspirin disrupts the crosstalk of angiogenic and inflammatory cytokines between 4T1 breast cancer cells and macrophages. Mediators Inflamm 2018;2018:6380643.
https://doi.org/10.1155/2018/6380643 |
| 36 | Allen SG, Chen Y-C, Madden JM, Fournier CL, Altemus MA, Hiziroglu AB, Cheng Y-H, Wu ZF, Bao L, Yates JA: Macrophages enhance migration in inflammatory breast cancer cells via RhoC GTPase signaling. Sci Rep 2016;6:1-11.
https://doi.org/10.1038/srep39190 |
| 37 | Camerlingo R, Miceli R, Marra L, Rea G, D'Agnano I, Nardella M, Montella R, Morabito A, Normanno N, Tirino V: Conditioned medium of primary lung cancer cells induces EMT in A549 lung cancer cell line by TGF-ß1 and miRNA21 cooperation. PloS one 2019;14:e0219597.
https://doi.org/10.1371/journal.pone.0219597 |
| 38 | Sufian HB, Santos JM, Khan ZS, Halim SA, Khan A, Munir MT, Zahid MK, Al-Harrasi A, Gollahon LS, Hussain F: Parthenolide reverses the epithelial to mesenchymal transition process in breast cancer by targeting TGFbeta1: In vitro and in silico studies. Life Sci 2022;301:120610.
https://doi.org/10.1016/j.lfs.2022.120610 |
| 39 | Solinas G, Germano G, Mantovani A, Allavena P: Tumor-associated macrophages (TAM) as major players of the cancer-related inflammation. J Leukoc Biol 2009;86:1065-1073.
https://doi.org/10.1189/jlb.0609385 |
| 40 | Kapoor K, Finer-Moore JS, Pedersen BP, Caboni L, Waight A, Hillig RC, Bringmann P, Heisler I, Müller T, Siebeneicher H: Mechanism of inhibition of human glucose transporter GLUT1 is conserved between cytochalasin B and phenylalanine amides. PNAS 2016;113:4711-4716.
https://doi.org/10.1073/pnas.1603735113 |
| 41 | Aylett CH, Sauer E, Imseng S, Boehringer D, Hall MN, Ban N, Maier T: Architecture of human mTOR complex 1. Science 2016;351:48-52.
https://doi.org/10.1126/science.aaa3870 |
| 42 | Gill MR, Jarman PJ, Hearnden V, Fairbanks SD, Bassetto M, Maib H, Palmer J, Ayscough KR, Thomas JA, Smythe C: A Ruthenium (II) Polypyridyl Complex Disrupts Actin Cytoskeleton Assembly and Blocks Cytokinesis. Angew Chem Int Ed Engl 2022;61:e202117449.
https://doi.org/10.1002/anie.202117449 |
| 43 | Warburg O: On the origin of cancer cells. Science 1956;123:309-314.
https://doi.org/10.1126/science.123.3191.309 |
| 44 | Pliszka M, Szablewski L: Glucose transporters as a target for anticancer therapy. Cancers 2021;13:4184.
https://doi.org/10.3390/cancers13164184 |
| 45 | Ray RB, Raychoudhuri A, Steele R, Nerurkar P: Bitter melon (Momordica charantia) extract inhibits breast cancer cell proliferation by modulating cell cycle regulatory genes and promotes apoptosis. Cancer Res 2010;70:1925-1931.
https://doi.org/10.1158/0008-5472.CAN-09-3438 |
| 46 | Ding L, Cao J, Lin W, Chen H, Xiong X, Ao H, Yu M, Lin J, Cui Q: The roles of cyclin-dependent kinases in cell-cycle progression and therapeutic strategies in human breast cancer. Int J Mol Sci 2020;21:1960.
https://doi.org/10.3390/ijms21061960 |
| 47 | Sun Q, Chen X, Ma J, Peng H, Wang F, Zha X, Wang Y, Jing Y, Yang H, Chen R: Mammalian target of rapamycin up-regulation of pyruvate kinase isoenzyme type M2 is critical for aerobic glycolysis and tumor growth. Proc Natl Acad Sci U S A 2011;108:4129-4134.
https://doi.org/10.1073/pnas.1014769108 |
| 48 | Charafe-Jauffret E, Ginestier C, Bertucci F, Cabaud O, Wicinski J, Finetti P, Josselin E, Adelaide J, Nguyen T-T, Monville F: ALDH1-Positive Cancer Stem Cells Predict Engraftment of Primary Breast Tumors and Are Governed by a Common Stem Cell ProgramClinical Relevance of Breast CSCs from PDXs. Cancer Res 2013;73:7290-7300.
https://doi.org/10.1158/0008-5472.CAN-12-4704 |
| 49 | Martínez VG, Rubio C, Martínez-Fernández M, Segovia C, López-Calderón F, Garín MI, Teijeira A, Munera-Maravilla E, Varas A, Sacedón R: BBMP4 Induces M2 Macrophage Polarization and Favors Tumor Progression in Bladder Cancer. Clin Cancer Res 2017;23:7388-7399.
https://doi.org/10.1158/1078-0432.CCR-17-1004 |
| 50 | Zhang L, Li S: Lactic acid promotes macrophage polarization through MCT-HIF1α signaling in gastric cancer. Exp Cell Res 2020;388:111846.
https://doi.org/10.1016/j.yexcr.2020.111846 |
| 51 | Vander Heiden M, Cantley L, Thompson C: Understanding the warburg effect: the metabolic requirements of cell proliferation NIH public access. Science 2009;324:1029-1033.
https://doi.org/10.1126/science.1160809 |
| 52 | Lin S, Sun L, Lyu X, Ai X, Du D, Su N, Li H, Zhang L, Yu J, Yuan S: Lactate-activated macrophages induced aerobic glycolysis and epithelial-mesenchymal transition in breast cancer by regulation of CCL5-CCR5 axis: a positive metabolic feedback loop. Oncotarget 2017;8:110426-110443.
https://doi.org/10.18632/oncotarget.22786 |
| 53 | Liu D, Chang C, Lu N, Wang X, Lu Q, Ren X, Ren P, Zhao D, Wang L, Zhu Y: Comprehensive proteomics analysis reveals metabolic reprogramming of tumor-associated macrophages stimulated by the tumor microenvironment. J Proteome Res 2017;16:288-297.
https://doi.org/10.1021/acs.jproteome.6b00604 |
| 54 | Penny HL, Sieow JL, Adriani G, Yeap WH, See Chi Ee P, San Luis B, Lee B, Lee T, Mak SY, Ho YS: Warburg metabolism in tumor-conditioned macrophages promotes metastasis in human pancreatic ductal adenocarcinoma. Oncoimmunology 2016;5:e1191731.
https://doi.org/10.1080/2162402X.2016.1191731 |
| 55 | Cho RJ, Kim Y-S, Kim J-Y, Oh Y-M: Human adipose-derived mesenchymal stem cell spheroids improve recovery in a mouse model of elastase-induced emphysema. BMB Rep 2017;50:79-84.
https://doi.org/10.5483/BMBRep.2017.50.2.101 |
| 56 | Zhao H, Sun J, Shao J, Zou Z, Qiu X, Wang E, Wu G: Glucose transporter 1 promotes the malignant phenotype of non-small cell lung cancer through integrin β1/Src/FAK signaling. J Cancer 2019;10:4989-4997.
https://doi.org/10.7150/jca.30772 |
| 57 | Rastogi S, Banerjee S, Chellappan S, Simon GR: Glut-1 antibodies induce growth arrest and apoptosis in human cancer cell lines. Cancer Lett 2007;257:244-251.
https://doi.org/10.1016/j.canlet.2007.07.021 |
| 58 | Wood TE, Dalili S, Simpson CD, Hurren R, Mao X, Saiz FS, Gronda M, Eberhard Y, Minden MD, Bilan PJ: A novel inhibitor of glucose uptake sensitizes cells to FAS-induced cell death. Mol Cancer Ther 2008;7:3546-3555.
https://doi.org/10.1158/1535-7163.MCT-08-0569 |
| 59 | Kim MS, Kwon JY, Kang NJ, Lee KW, Lee HJ: Phloretin induces apoptosis in H-Ras MCF10A human breast tumor cells through the activation of p53 via JNK and p38 mitogen-activated protein kinase signaling. Ann N Y Acad Sc 2009;1171:479-483.
https://doi.org/10.1111/j.1749-6632.2009.04692.x |
| 60 | Aykin-Burns N, Ahmad IM, Zhu Y, Oberley LW, Spitz DR: Increased levels of superoxide and H2O2 mediate the differential susceptibility of cancer cells versus normal cells to glucose deprivation. Biochem J 2009;418:29-37.
https://doi.org/10.1042/BJ20081258 |
| 61 | Zhao Y, Coloff JL, Ferguson EC, Jacobs SR, Cui K, Rathmell JC: Glucose metabolism attenuates p53 and Puma-dependent cell death upon growth factor deprivation. J Biol Chem 2008;283:36344-36353.
https://doi.org/10.1074/jbc.M803580200 |
| 62 | Soave DF, Miguel MP, Tomé FD, de Menezes LB, Nagib PRA, Celes MRN: The fate of the tumor in the hands of microenvironment: role of TAMs and mTOR pathway. Mediators Inflamm 2016;2016:8910520.
https://doi.org/10.1155/2016/8910520 |
| 63 | Genin M, Clement F, Fattaccioli A, Raes M, Michiels C: M1 and M2 macrophages derived from THP-1 cells differentially modulate the response of cancer cells to etoposide. BMC Cancer 2015;15:577.
https://doi.org/10.1186/s12885-015-1546-9 |
| 64 | Zong S-y, Pu Y-q, Xu B-l, Zhang T, Wang B: Study on the physicochemical properties and anti-inflammatory effects of paeonol in rats with TNBS-induced ulcerative colitis. Int Immunopharmacol 2017;42:32-38.
https://doi.org/10.1016/j.intimp.2016.11.010 |
| 65 | Kaler P, Galea V, Augenlicht L, Klampfer L: Tumor associated macrophages protect colon cancer cells from TRAIL-induced apoptosis through IL-1β-dependent stabilization of snail in tumor cells. PloS One 2010;5:e11700.
https://doi.org/10.1371/journal.pone.0011700 |
| 66 | Mossmann D, Park S, Hall MN: mTOR signalling and cellular metabolism are mutual determinants in cancer. Nat Rev Cancer 2018;18:744-757.
https://doi.org/10.1038/s41568-018-0074-8 |
| 67 | Byles V, Covarrubias AJ, Ben-Sahra I, Lamming DW, Sabatini DM, Manning BD, Horng T: The TSC-mTOR pathway regulates macrophage polarization. Nat Commun 2013;4:2834.
https://doi.org/10.1038/ncomms3834 |
| 68 | Zhu L, Yang T, Li L, Sun L, Hou Y, Hu X, Zhang L, Tian H, Zhao Q, Peng J: TSC1 controls macrophage polarization to prevent inflammatory disease. Nature Commun 2014;5:4696.
https://doi.org/10.1038/ncomms5696 |
| 69 | Ramanathan A, Schreiber SL: Direct control of mitochondrial function by mTOR. Proc Natl Acad Sci U S A 2009;106:22229-22232.
https://doi.org/10.1073/pnas.0912074106 |
| 70 | Wang X, Jiao X, Meng Y, Chen H, Griffin N, Gao X, Shan F: Methionine enkephalin (MENK) inhibits human gastric cancer through regulating tumor associated macrophages (TAMs) and PI3K/AKT/mTOR signaling pathway inside cancer cells. Int Immunopharmacol 2018;65:312-322.
https://doi.org/10.1016/j.intimp.2018.10.023 |
| 71 | Li D, Ji H, Niu X, Yin L, Wang Y, Gu Y, Wang J, Zhou X, Zhang H, Zhang Q: Tumor-associated macrophages secrete CC-chemokine ligand 2 and induce tamoxifen resistance by activating PI3K/Akt/mTOR in breast cancer. Cancer Sci 2020;111:47-58.
https://doi.org/10.1111/cas.14230 |
| 72 | Zhang R, Naughton DP: Vitamin D in health and disease: current perspectives. Nutr J 2010;9:65.
https://doi.org/10.1186/1475-2891-9-65 |
| 73 | Bouillon R, Carmeliet G, Verlinden L, Van Etten E, Verstuyf A, Luderer HF, Lieben L, Mathieu C, Demay M: Vitamin D and human health: lessons from vitamin D receptor null mice. Endocr Rev 2008;29:726-776.
https://doi.org/10.1210/er.2008-0004 |
| 74 | Donati S, Palmini G, Aurilia C, Falsetti I, Miglietta F, Iantomasi T, Brandi ML: Rapid nontranscriptional effects of calcifediol and calcitriol. Nutrients 2022;14:1291.
https://doi.org/10.3390/nu14061291 |
| 75 | Vanhevel J, Verlinden L, Doms S, Wildiers H, Verstuyf A: The role of vitamin D in breast cancer risk and progression. EEndocr Relat Cancer 2022;29:R33-R55.
https://doi.org/10.1530/ERC-21-0182 |
| 76 | Huss L, Butt ST, Borgquist S, Elebro K, Sandsveden M, Manjer J, Rosendahl A: Levels of vitamin D and expression of the vitamin D receptor in relation to breast cancer risk and survival. Nutrients 2022;14:3353.
https://doi.org/10.3390/nu14163353 |
| 77 | Grant WB, Al Anouti F, Boucher BJ, Dursun E, Gezen-Ak D, Jude EB, Karonova T, Pludowski P: A narrative review of the evidence for variations in serum 25-hydroxyvitamin D concentration thresholds for optimal health. Nutrients 2022;14:639.
https://doi.org/10.3390/nu14030639 |
| 78 | Zmijewski MA, Carlberg C: Vitamin D receptor (s): In the nucleus but also at membranes? Exp Dermatol 2020;29:876-884.
https://doi.org/10.1111/exd.14147 |