×
![]()
Corresponding Author: Felix Kliewe
Institut für Anatomie und Zellbiologie, Universitätsmedizin Greifswald
Friedrich-Loeffler-Str. 23c, 17489 Greifswald (Germany
Tel. +49 (0)3834 86-5324 , E-Mail felix.kliewe@uni-greifswald.de
Studies on the Role of the Transcription Factor Tcf21 in the Transdifferentiation of Parietal Epithelial Cells into Podocyte-Like Cells
Felix Kliewea Andreas W. Kussb Florian Siegerista Sindy Schrödera Sandra Schordana Nadine Artelta Frances Kindta Kerstin Amannc Maja T. Lindenmeyerd Karlhans Endlicha Nicole Endlicha
aDepartment of Anatomy and Cell Biology, University Medicine Greifswald, Greifswald, Germany, bHuman Molecular Genetics Group, Department of Functional Genomics, University Medicine Greifswald, Greifswald, Germany, cDepartment of Nephropathology, University Medicine Erlangen, Erlangen, Germany, dDepartment of Medicine, University Medical Center Hamburg-Eppendorf, Hamburg, Germany
Introduction
Over the last years, many studies have demonstrated that the de-differentiation and loss of podocytes are the major cause of chronic kidney disease (CKD) [1–3]. It would be therefore worthwhile to find a strategy to replace lost and damaged podocytes as it is already described for the transdifferentiation of fibroblasts into several different cell types, e.g. neurons. This transdifferentiation was induced by the expression of a small number of specific transcription factors. Whether there are progenitor cells which are able to differentiate into podocytes is still an ongoing and controversial debate. One hypothesis is that parietal epithelial cells (PECs) are able to transdifferentiate into podocytes to some extent and under specific circumstances [4–12]. Since in the literature it is described that several transcription factors are crucial for podocyte differentiation like Wt1, Lmx1b, Foxc2, and MafB [13–16], we focused our attention on a transcription factor of the basic-loop-helix family, Tcf21 which was already shown to be essential for the proper development of glomeruli [17, 18].
Tcf21, also known as Pod1, capsulin, or epicardin, is not only crucial for the differentiation of immature podocytes but also for a number of different cell types during embryogenesis of the heart, lung, kidney and spleen [17–22]. By the generation of Tcf21 null mutant mice that die at the perinatal period by major cardiopulmonary defects, it was nicely demonstrated that Tcf21 is essential for development [18]. Additionally, it was shown that the kidneys of the Tcf21 knockout mice were severely hypoplastic due to a delay of nephrogenesis and abnormal branching of the ureteric bud. The few glomeruli found in kidneys of Tcf21 knockout mice appeared to arrest at the capillary loop stage of development [18]. Moreover, podocyte-specific Tcf21 knockout mice developed massive proteinuria at 3-5 weeks of age with prominent glomerular lesions which is similar to human FSGS [23].
Because Tcf21 is so important for proper kidney development and function, we studied the influence of Tcf21 for the differentiation of PECs into podocytes in vitro and looked for target genes by Chromatin ImmunoPrecipitation followed by DNA-Sequencing (ChIP-Seq).
Materials and Methods
Cell culture
PECs were cultivated in EBM medium (Lonza, Basel, Switzerland) supplemented with EGM-MV singlequots T75 (Lonza) as reported [24]. PECs were passaged every 3-4 days. Transfection of PECs was done with 1 µg/ml GFP- and the Tcf21-GFP plasmids (OriGene Technologies, Rockville, MD, USA) by Lipofectamine® 2000 transfection (Invitrogen, Carlsbad, CA, USA) in serum-free RPMI medium (Lonza) according to the manufacturer’s instructions. Cells were used 48 hours after transfection for immuncytochemistry, for protein- and RNA-isolation.
In Situ Cell Death Detection (TUNEL assay)
The In Situ Cell Death Detection Kit, TMR red (Sigma-Aldrich, St. Louis, MO, USA) is based on the detection of single- and double-stranded DNA breaks that occur at the early stages of apoptosis. Apoptotic cells were fixed and permeabilized. Subsequently, the cells are incubated with the TUNEL reaction. After washing, the label incorporated at the damaged sites of the DNA is visualized by fluorescence microscopy.
BrdU Labeling and Detection
Cell proliferation was measured with the thymidine analog BrdU (5-bromo-2’-deoxyuridine) following its incorporation into newly synthesized DNA and its subsequent detection with an anti-BrdU antibody by using “5-Bromo-2′-deoxy-uridine Labeling and Detection Kit I” (Roche, Basel, Switzerland)
Histology
For paraffin sections of mouse kidneys and human biopsies, samples were dehydrated and embedded into paraffin by standard procedures. Paraffin sections (5 µm) were done on a Leica SM 2000R (Leica Microsystems, Wetzlar, Germany). After rehydration, sections were unmasked in citrate buffer (0.1 M, pH 6.0) by heating for 5 min in a pressure cooker. The sections were stained with 1 mg/100 ml Hoechst 33342 (Sigma-Aldrich) for 30 min. For the immunofluorescence double-staining, samples were incubated with an antibody against synaptopodin (1:50; mouse; Progen Biotechnik GmbH, Heidelberg, Germany) and Tcf21 (rabbit; Sigma-Aldrich, HPA013189, 1:100) overnight. Samples were washed with 1x PBS for 3x 5 min and incubated with Cy2- and Cy3-conjugated anti-mouse/-rabbit secondary antibodies (1:250; Jackson ImmunoResearch Laboratories, West Grove, USA) for 1 hour. After additional washing, the samples were mounted in Mowiol (Carl Roth, Karlsruhe, Germany) for fluorescence microscopy. Additionally, paraffin sections were stained using the Vectastain kit (Vector Laboratories, Burlingame, CA, USA) following manufacturer’s instructions. Visualization was performed with DAB substrate kit (SK-4100; Vector Laboratories) followed by nuclear staining with hematoxylin and mounting in Eukitt (Sigma-Aldrich). In controls, 1x PBS was used instead of primary antibody. Photographs were taken on an Olympus BX50 microscope equipped with an Olympus DP10 digital camera (Tokyo, Japan).
Kidney biopsies
Kidney biopsies were archived at the Department of Nephropathology, Institute of Pathology, University Hospital Erlangen, Germany. The use of remnant kidney biopsy material was approved by the Ethics Committee of the Friedrich-Alexander-University of Erlangen-Nürnberg, waiving the need for retrospective consent for the use of archived rest material.
Immunocytochemistry
PECs were fixed with 2% paraformaldehyde (PFA) for 10 min, permeabilized by 0.3% Triton-X (Sigma-Aldrich) for 4 min and blocked for 1 hour with blocking solution (2% FBS, 2% BSA and 0.2% fish gelatin in PBS). Primary antibodies were diluted in blocking solution and incubated for 1 hour on cells. Antibodies used in this study for immunocytochemistry can be viewed in Supplementary Table 1 (for all supplementary material see www.cellphysiolbiochem.com). Secondary antibodies were diluted in blocking solution and incubated with the cells for 30 min: anti-mouse-Cy3 (Jackson ImmunoResearch Laboratories, 1:300) and anti-rabbit-Cy3 (Jackson Immuno Research, 1:300). For the visualization of the actin cytoskeleton, cells were stained with Alexa Fluor 546 phalloidin (1:100; Thermo Fisher Scientific, Waltham, MA, USA) for 30 min. For nuclei staining DAPI (1:150; Sigma-Aldrich) was used for 5 min. All samples were mounted in Mowiol (Carl Roth, Karlsruhe, Germany) and used for laser scanning microscopy (LSM).
Fluorescence mRNA in situ hybridization (FISH). For mRNA FISH, we used the RNAscope 2.5 HD Assay Red (Advanced Cell Diagnostics, Newark, CA, USA). Protocol was applied according to manufacturer’s instructions with following changes: Tissue was digested for 15 instead of 30 min to yield better glomerular morphology. After FastRed detection, slides were collected in 1x PBS, blocked with the aforementioned blocking solution for 1 hour at room temperature. A premixed antibody solution containing a rabbit anti-human podocin antibody (1:150, IBL, Cat No. 29040) and an Alexa Fluor 488-conjugated dual monoclonal alpaka anti-rabbit VHH nanobody (1:1000, ChromoTek GmbH, Planegg-Martinsried, Germany) was incubated at 4°C overnight. After several washes in PBS, cell nuclei were counterstained with 0.1 mg/ml DAPI and sections mounted in Mowiol for microscopy.
Microarrays on human kidney biopsies. Human renal biopsy specimens and Affymetrix microarray expression data were procured within the framework of the European Renal cDNA Bank - Kröner-Fresenius Biopsy Bank [25, 26]. Biopsies were obtained from patients after informed consent and with approval of the local ethics committees. Following renal biopsy, the tissue was transferred to RNase inhibitor and microdissected into glomeruli and tubulointerstitium. Total RNA was isolated from microdissected glomeruli, reverse transcribed, and linearly amplified according to a protocol previously reported [27].
The published microarray expression data used in this study came from individual patients with DN and FSGS. Pre-transplantation kidney biopsies from living donors were used as control renal tissue (GSE99340, GSE32591, GSE37463). Fragmentation, hybridization, staining, and imaging were performed with the Affymetrix HG-U 133plus 2.0 system (Affymetrix, Santa Clara, CA) according to the Affymetrix Expression Analysis Technical Manual. CEL file normalization was performed with the Robust Multichip Average method using RMAExpress (Version 1.0.5) and the human Entrez-Gene custom CDF annotation from Brain Array version 18. The log-transformed dataset was corrected for batch effect using ComBat from the GenePattern pipeline (http://www.broadinstitute.org/cancer/software/genepattern/). To identify differentially expressed genes the SAM (Significance Analysis of Microarrays) method was applied using TiGR (MeV, Version 4.8.1) [28]. A q-value below 0.05 was considered to be statistically significant.
Laser scanning microscopy
Images were captured either with a Leica TCS SP5 confocal microscope (Leica Microsystems, Wetzlar, Germany), 40x/63x oil immersion objectives in the Leica Application Suite software (Leica Microsystems, Version 2.6.0).
RNA extraction, cDNA synthesis, qRT-PCR
Samples from cells/tissues were processed in Tri-Reagent (Sigma-Aldrich, St. Louis, MO, USA) according manufactures instructions. For cDNA synthesis, 1 µg of the isolated total RNA was transcribed using the QuantiTect Reverse Transcription Kit (Qiagen, Hilden, Germany). The quantitative real-time PCR (qRT-PCR) analysis was performed on a LightCycler Nano (Roche Diagnostics GmbH, Mannheim, Germany) by using the iTaq Universal SYBR Green Supermix (Bio-Rad, Hercules, CA, USA) with Actb and Rpl32 as reference genes. Relative quantifications of the mRNA levels were done by the efficiency corrected calculation model by Pfaffl [29] and are shown with standard deviations from three biological replicates. Primers used for mouse samples can be viewed in Supplementary Table 2.
Expression level of mRNA corresponding to Tcf21 (ENSMUSG00000045680) was also determined by RNA sequencing of samples isolated from murine glomeruli. Sequencing was carried out on a SOLiD 5500xl sequencing platform (Life Technologies, Carlsbad CA, USA) as previously described [30]. Sequence analysis was based on GRCm38/mm10. Benjamini-Hochberg adjusted Wald test p-values (padj) were determined to identify significant differences in gene expression between samples.
Western blot analysis
Cells were trypsinized, washed twice in PBS and dissolved in RIPA lysis buffer (Thermo Fisher Scientific). Protein homogenates were quantified using the Pierce BCA protein assay kit (Thermo Fisher Scientific). After addition of SDS-PAGE sample buffer (final concentrations: 32 mM Tris-HCl, 1% SDS, 5% glycerol, 0.05% bromphenol blue, 3.25% 2‑mercaptoethanol, pH 6.8), the cell lysates were heated at 95°C, 5 min and separated on a 4-20% gradient Mini-Protean TGX Gel (Bio-Rad). Furthermore, separated proteins were blotted on nitrocellulose membranes using the Trans-Blot Turbo RTA Transfer Kit (Bio-Rad) and the Trans-Blot Turbo Transfer System (Bio-Rad) at 1.3 A/25 V for 10 min. Blots were washed in 1x TBST (50 mM Tris, 150 mM NaCl, 10 mM CaCl2, 1 mM MgCl2) supplemented with Tween-20 0.1%; AppliChem) and blocked with 5% milk powder for 1 hour at room temperature. Moreover, primary antibodies were diluted in 2.5% milk powder (in 1x TBST) and incubated over night by 4°C. After intensive washing in 1x TBST blots were incubated with secondary antibodies for 60 min, washed again, developed with the Clarity™ Western ECL Substrate (Bio-Rad) and visualized on X-ray films (Fujifilm Super RX, FUJIFILM, Tokyo, Japan). Antibodies used in this study for Western blot can be viewed in Supplementary Table 3. For the relative quantification, developed x-ray films were scanned and analyzed using ImageJ (version 1.49m; NIH, Bethesda, MD, USA).
ChIP-Seq and bioinformatic analysis
PECs were transfected with Tcf21-myc and myc empty vector (control plasmid) for 48 h. Cells were treated with 1% formaldehyde for 10 min at room temperature. Formaldehyde was inactivated by adding glycine (final concentration 0.125M) to the cells, followed by two times washing with cold PBS. Cells were lysed for 10 min on ice (20mM HEPES pH 7.4, 1mM EDTA, 150mM NaCl, 1% SDS, protease inhibitor). Nuclei were collected by centrifugation (1700g for 5min) and resuspended for sonication in shearing buffer (20mM HEPES pH 7.4, 1mM EDTA, 150mM NaCl, 0.4% SDS, protease inhibitor). Crosslinked chromatin was sheared for 10 min (duty cycle 5% by sonication using a Covaris S220 Focused-ultrasonicator (Covaris, Woburn, MA 01801, USA) and pre-cleared with protein A/G agarose (Santa Cruz Biotechnology). ChIP was performed overnight in IP dilution buffer (20 mM Tris pH 8.1, 2 mM EDTA, 150 mM NaCl, 1% Triton X100, 0.01% SDS), using 5 μg anti-TCF21 (H‑75; sc‑32914; Santa Cruz), anti-myc antibody (9E10; sc‑40; Santa Cruz), control IgG or anti-myc (9E10) magnetic beads (OriGene Technologies, Rockville, MD, USA). IP complexes were washed twice with wash buffer 1 (100 mM Tris pH 8.0, 500 mM LiCl, 1% NP-40 and 1% deoxycholate), two times with high salt wash buffer (1X PBS, 1% NP-40, 0.5% sodium deoxycholate, 0.1% SDS) and twice with TE buffer. Bound chromatin was eluted from the protein A/G agarose or beads respectively twice with elution buffer (1% SDS, 0.1 M NaHCO3). After reverse-crosslinking, RNaseA and proteinase K digestion, chromatin was cleaned up and the DNA concentration measured using Qubit 2.0 fluorometric quantitation. The DNA fragments were then prepared for sequencing on a 5500xl SOLiD system (Life Technologies, Carlsbad, CA, USA) using recommended protocols and equipment (Life Technologies, Carlsbad, CA, USA). In short: The DNA fragments were end-polished, size-selected using Ampure XP Beads (Beckman Coulter, Brea, Ca, USA) and subject to A-tailing, adapter ligation and barcoding. The library was purified and the concentration and size distribution was determined using a 2100 Bioanalyzer Instrument (Agilent Technologies, Santa Clara, CA, USA). The DNA library was then diluted and attached to beads during clonal emulsion PCR amplification using an Applied Biosystems SOLiD EZ Bead Amplifier (Life Technologies, Carlsbad, CA, USA). After enrichment and 3’ modification the library was immobilized onto a flowchip and sequenced (75 bases in the forward and 35 bases in the reverse direction) using a 5500xl SOLiD system (Life Technologies, Carlsbad, CA, USA). The Lifescope Genomic Analysis Software (Life Technologies, Carlsbad, CA, USA) was used to call the bases and generate BAM files by alignment of the reads to the mouse genome (GRCm38/mm10). To identify putative Tcf21-myc binding sites the BAM data files were analysed using MACS1.4 or the GENOMATIX software suite.
De novo motif discovery was performed by using MEMESuite [31], more precisely DREME (Discriminative Regular Expression Motif Elicitation) motif comparison [32] was performed against a database of pooled TF motifs (JASPAR database) [33]. Functional annotation of high confidence binding regions was performed using Database for Annotation, Visualization and Integrated Discovery (DAVID) [34]. Gene enrichment analysis was performed by ToppGene Suite [35]. For visual inspection of Tcf21 binding to specific genomic regions, normalized read densities were uploaded to the Integrative Genomics Viewer (IGV) [36]. Identical viewing range for both Tcf21 and control samples set to the maximum peak within the window. To create density distributions (heat maps) around TSSs of Tcf21 peaks/targets, Seqminer v.1.3.3 was used [37].
Statistical analysis
All data are given as means ±SD or ±SEM, analyzed by unpaired t test with repeated measurements (n). Differences were determined significant at a p-value <0.05.
Results
Tcf21 is down-regulated during the de-differentiation of podocytes
As shown in Fig. 1A, Tcf21 is strongly expressed in kidney sections. Co-localization studies using the podocyte-specific protein synaptopodin confirmed that Tcf21 is strongly expressed in the nuclei of mouse and human podocytes (Fig. 1A). In contrast, parietal epithelial cells (PECs) which are still under debate regarding their role as progenitor cells for podocytes, weakly expressed Tcf21 in vivo (Fig. 1A). This was confirmed by single mRNA in situ hybridization (RNAscope®) combined with podocin immunofluorescence of human kidneys (Fig. 1B).
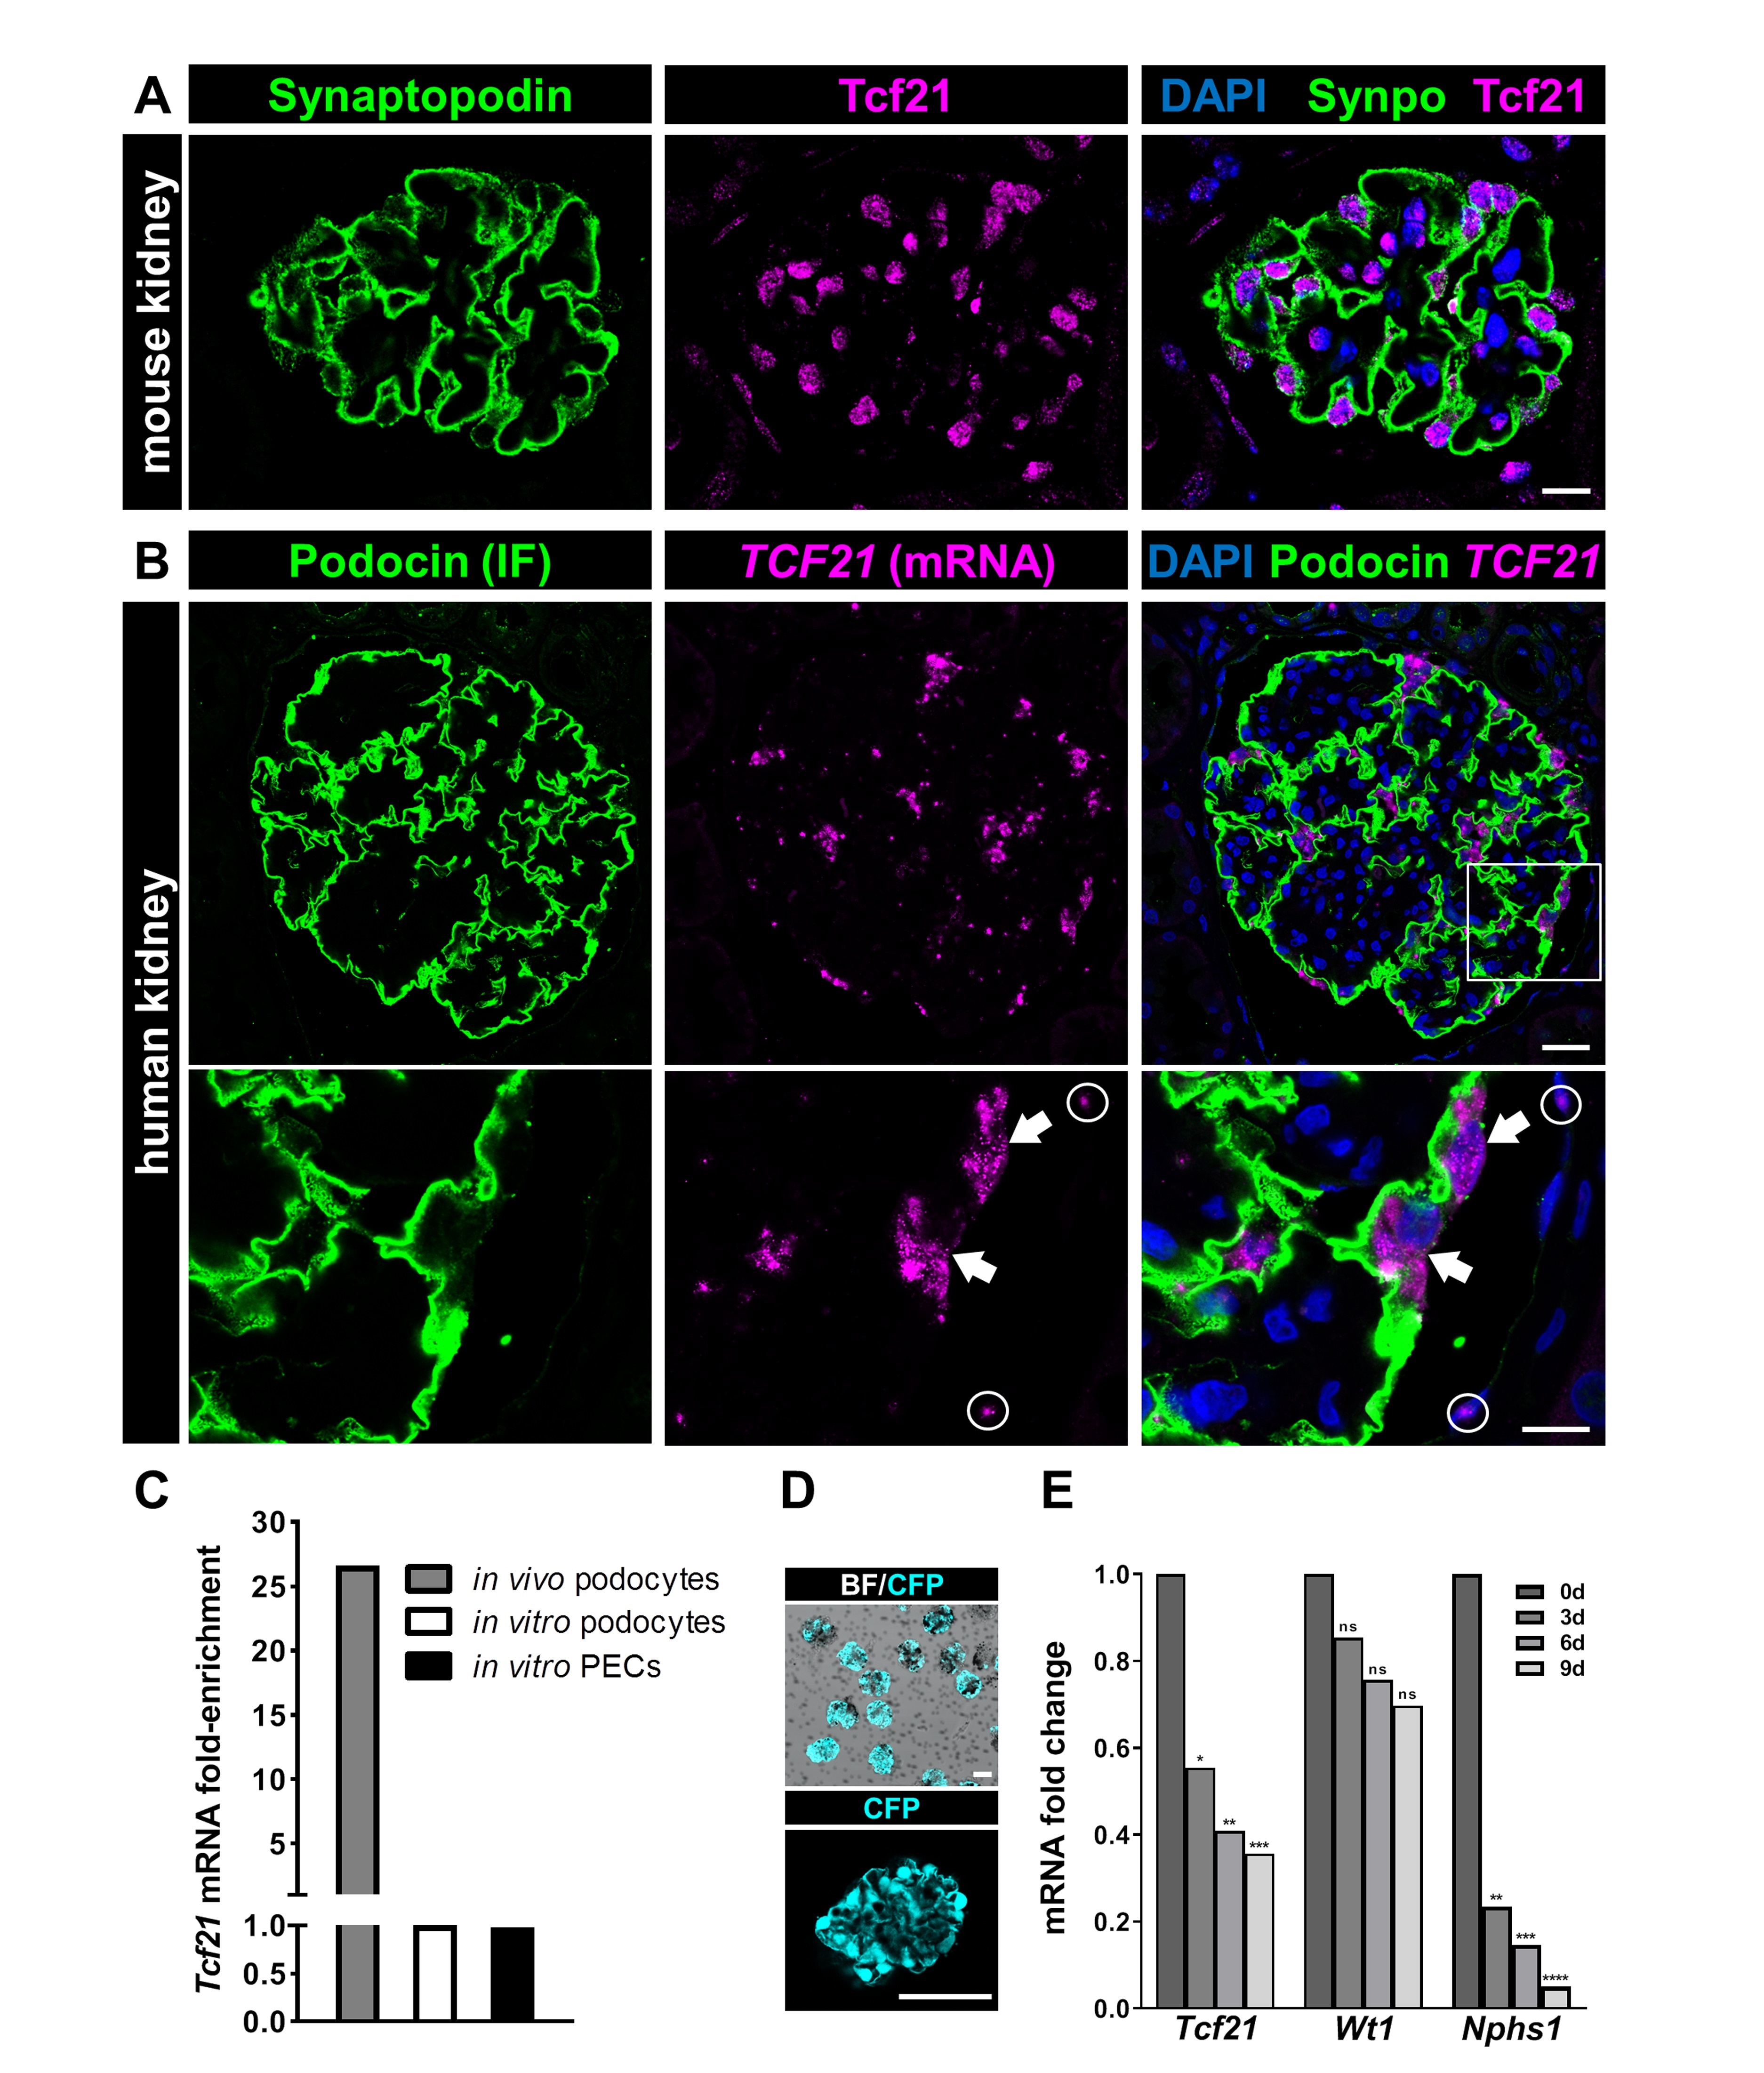
To study the expression of Tcf21 in dependence on the differentiation of podocytes, we performed comparative gene expression analysis of freshly isolated mouse podocytes, cultured primary mouse podocytes as well as cultured primary mouse PECs. We have found that Tcf21 was one of the strongest expressed genes in freshly isolated podocytes (27-fold) compared to podocytes and PECs in vitro (Fig. 1C). Furthermore, to study the expression of Tcf21 during the de-differentiation of podocytes, we used our established GlomAssay [38]. This assay allows us to study podocytes directly in situ. After isolation, glomeruli were cultured under standard conditions and RNA was isolated after 3, 6 and 9 days followed by RNA_Seq analysis [38]. We have found a continuous decrease of Tcf21 mRNA until day 9 (fold change 3d: 0.55; padj=0.025; 6d: 0.41; padj=0.0045; 9d: 0.36; padj=0.0004) (Fig. 1D) indicating a strong downregulation during the de-differentiation of podocytes.
Tcf21 regulates the expression of specific PEC and podocyte markers
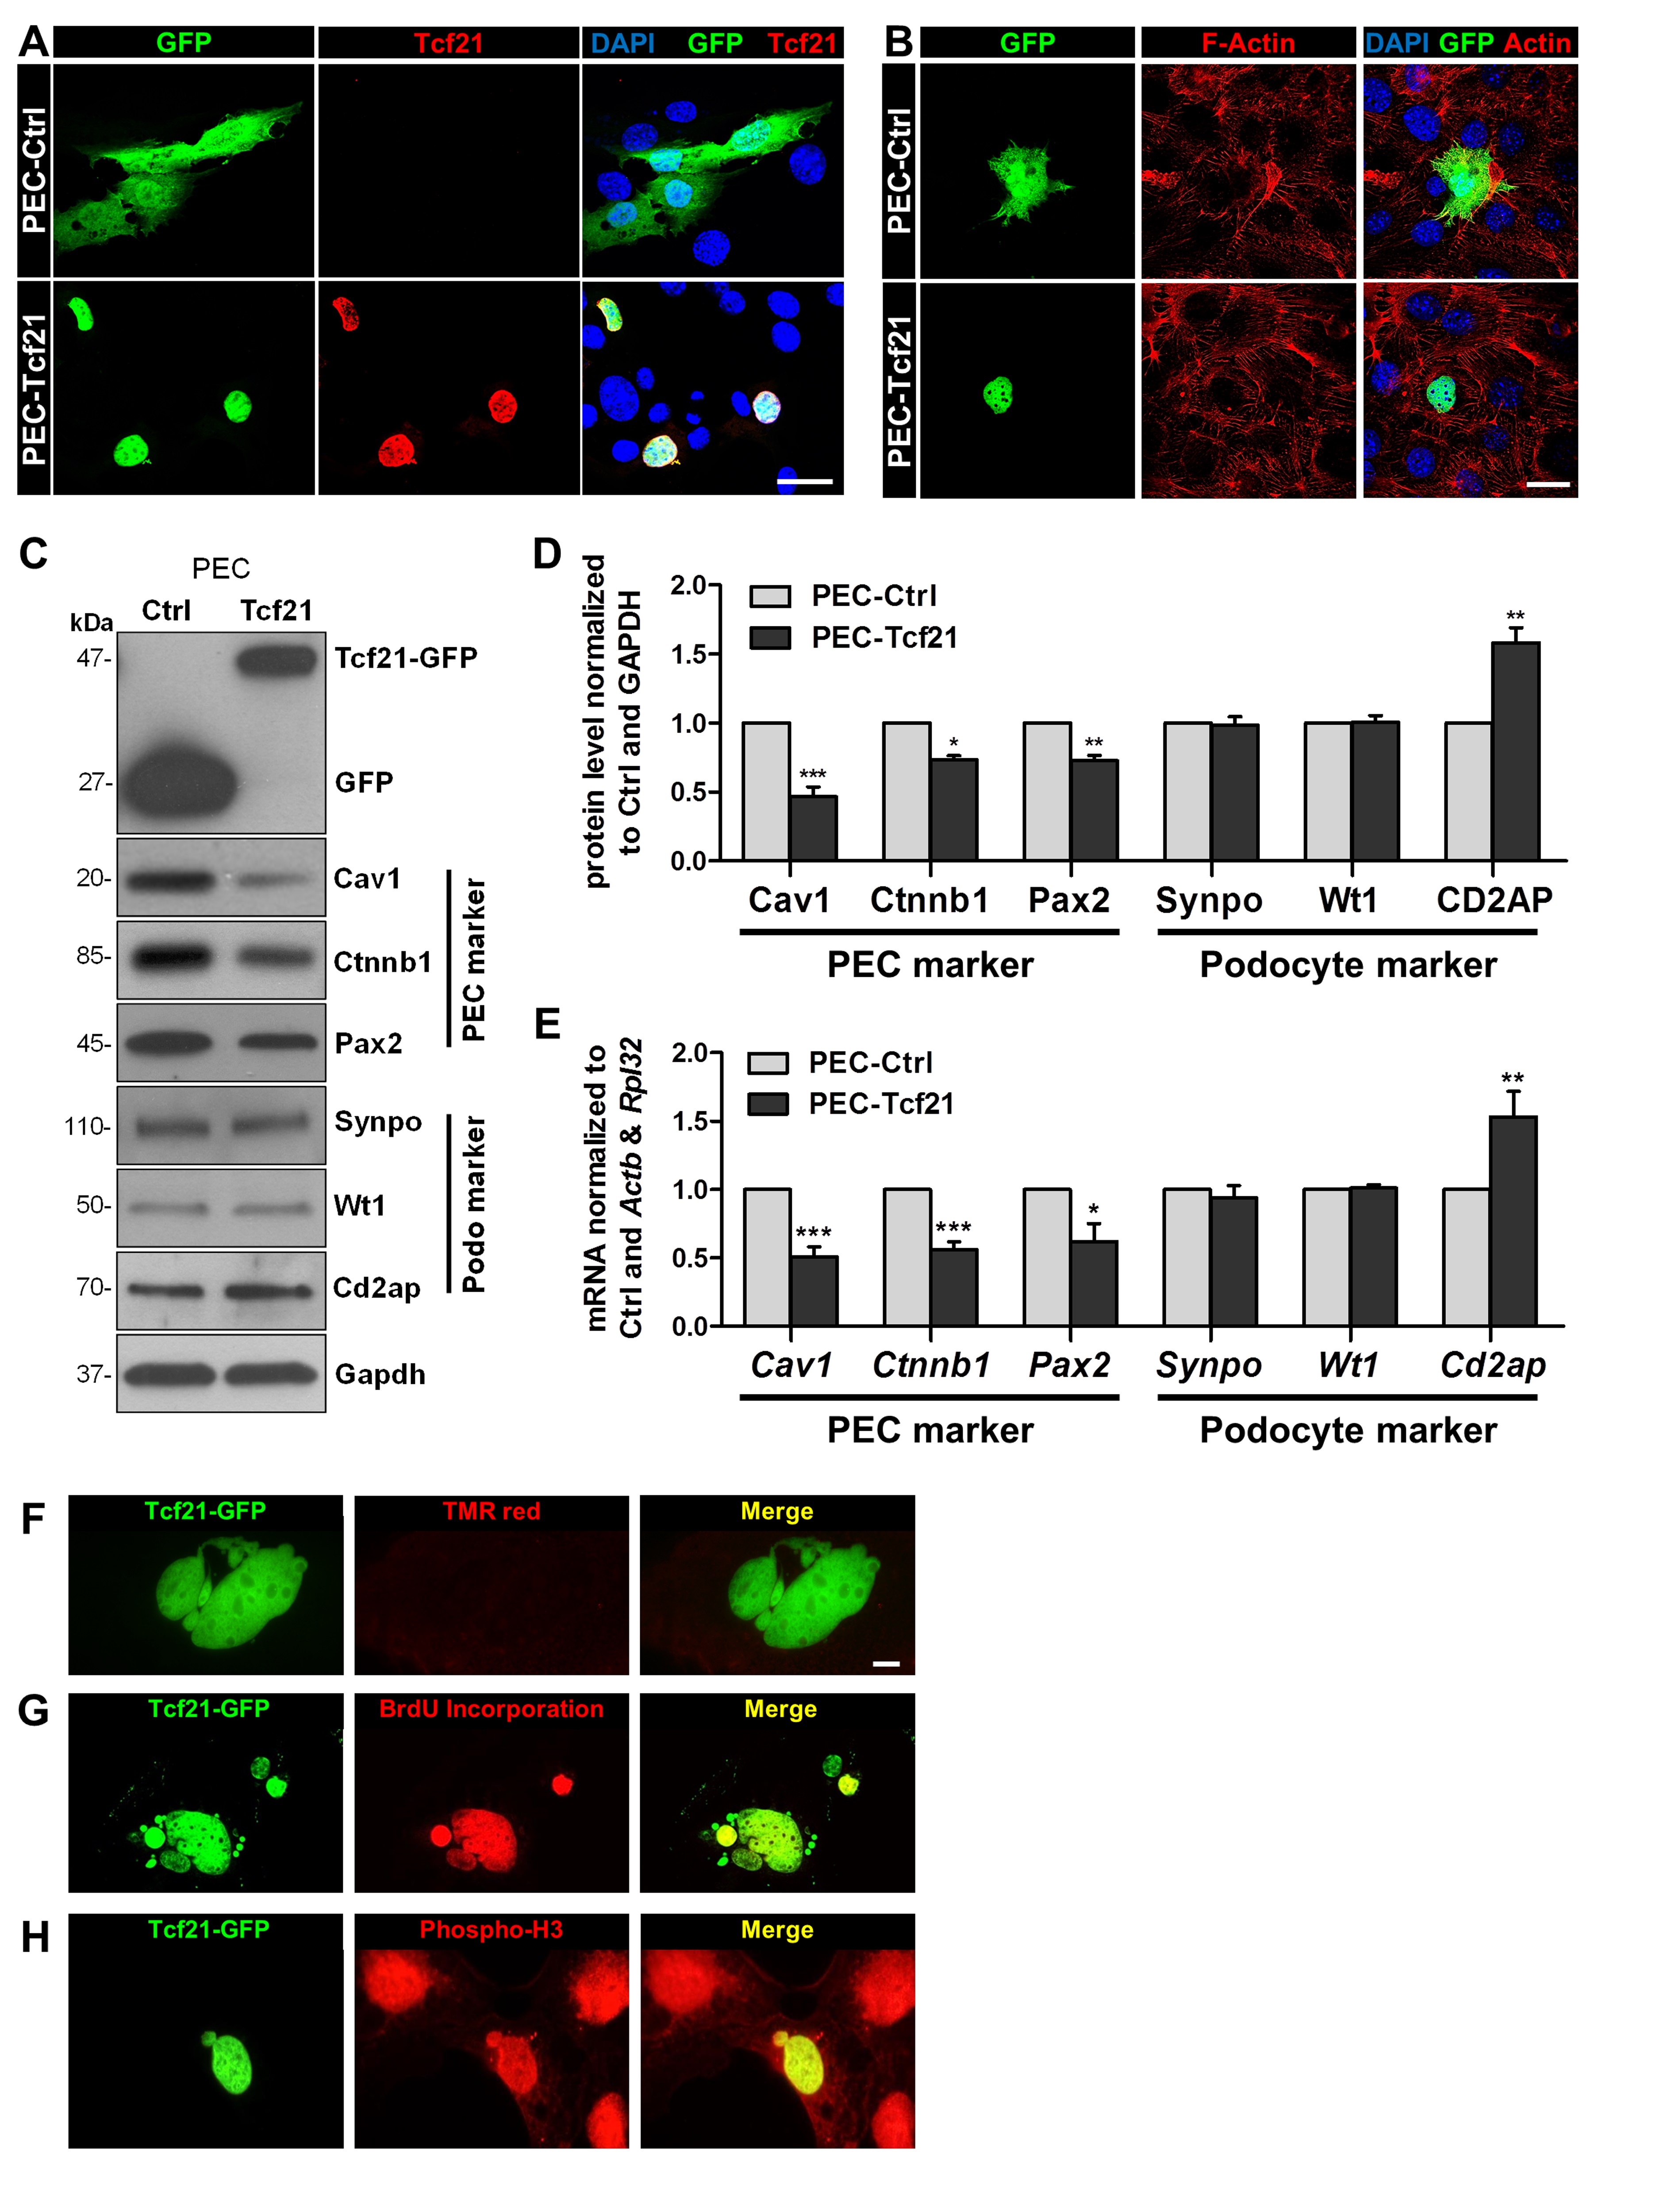
Since it is still under debate that PECs might be a type of progenitor cells that could differentiate into podocytes, we studied the effect of Tcf21 on PECs. Therefore, we transfected PECs with a plasmid encoding for Tcf21 coupled to GFP (PEC-Tcf21). As a control, PECs were transfected with a plasmid encoding for GFP alone (PEC-Ctrl). The expression levels of transfected Tcf21 were quantified by Western blots (Fig. 2C and Supplementary Fig. 1). Using an antibody specific for Tcf21, we verified that PEC-Tcf21 expresses Tcf21-GFP (Fig. 2A). We found that Tcf21-GFP was exclusively localized in the nuclei of PEC-Tcf21 (Fig. 2A). Further, we observed no significant change of the cell morphology and the actin cytoskeleton, respectively, as shown in Fig. 2B.
To find out whether PEC-Tcf21 differentiate into podocyte-like cells, we determined the expression of specific PEC as well as podocytes markers by qRT-PCR and Western blot. Western blot analysis showed that specific PEC markers became regulated by Tcf21: caveolin‑1 (-53±7%), β-catenin (-27±3%) and Pax2 (-27±4%) (Fig. 2C and D). The expression of the podocyte-specific markers synaptopodin (Synpo) and Wt1 did not change due to the transfection of Tcf21, in contrast to the slit membrane protein Cd2ap that was significantly upregulated (58±11%) in PEC‑Tcf21 compared to the control. Similar results were received by qRT-PCR (Cav1: ‑49±7%; Ctnnb1: ‑44±6%; Pax2: ‑38±13%, Cd2ap: 55±17%) (Fig. 2E). Furthermore, the RNA expression of synaptopodin as well as Wt1 was not affected by Tcf21 transfection.
Tcf21 induces multilobulation, budding and micronuclei formation (MBM) in PECs
Interestingly, we observed that the expression of Tcf21 in PECs affected the nuclei of PEC-Tcf21. Three typical characteristics, like multilobulation, budding of nuclei as well as the formation of micronuclei (MBM) were found 48 hours after transfection. To identify whether these changes are caused by an induction of apoptosis in PECs, we performed a TUNEL assay that detects single- and double-stranded DNA breaks as a sign of apoptosis. However, we have not found any indication for apoptosis (Fig. 2F). Surprisingly, we observed DNA synthesis (Fig. 2G and H) verified by BrdU incorporation (Fig. 2G) as well as by the detection of phosphorylated histone H3 (Fig. 2H). These results suggest that Tcf21 induces mitosis in PEC cells.
Tcf21 induced MBM is accompanied by multiple incomplete mitoses
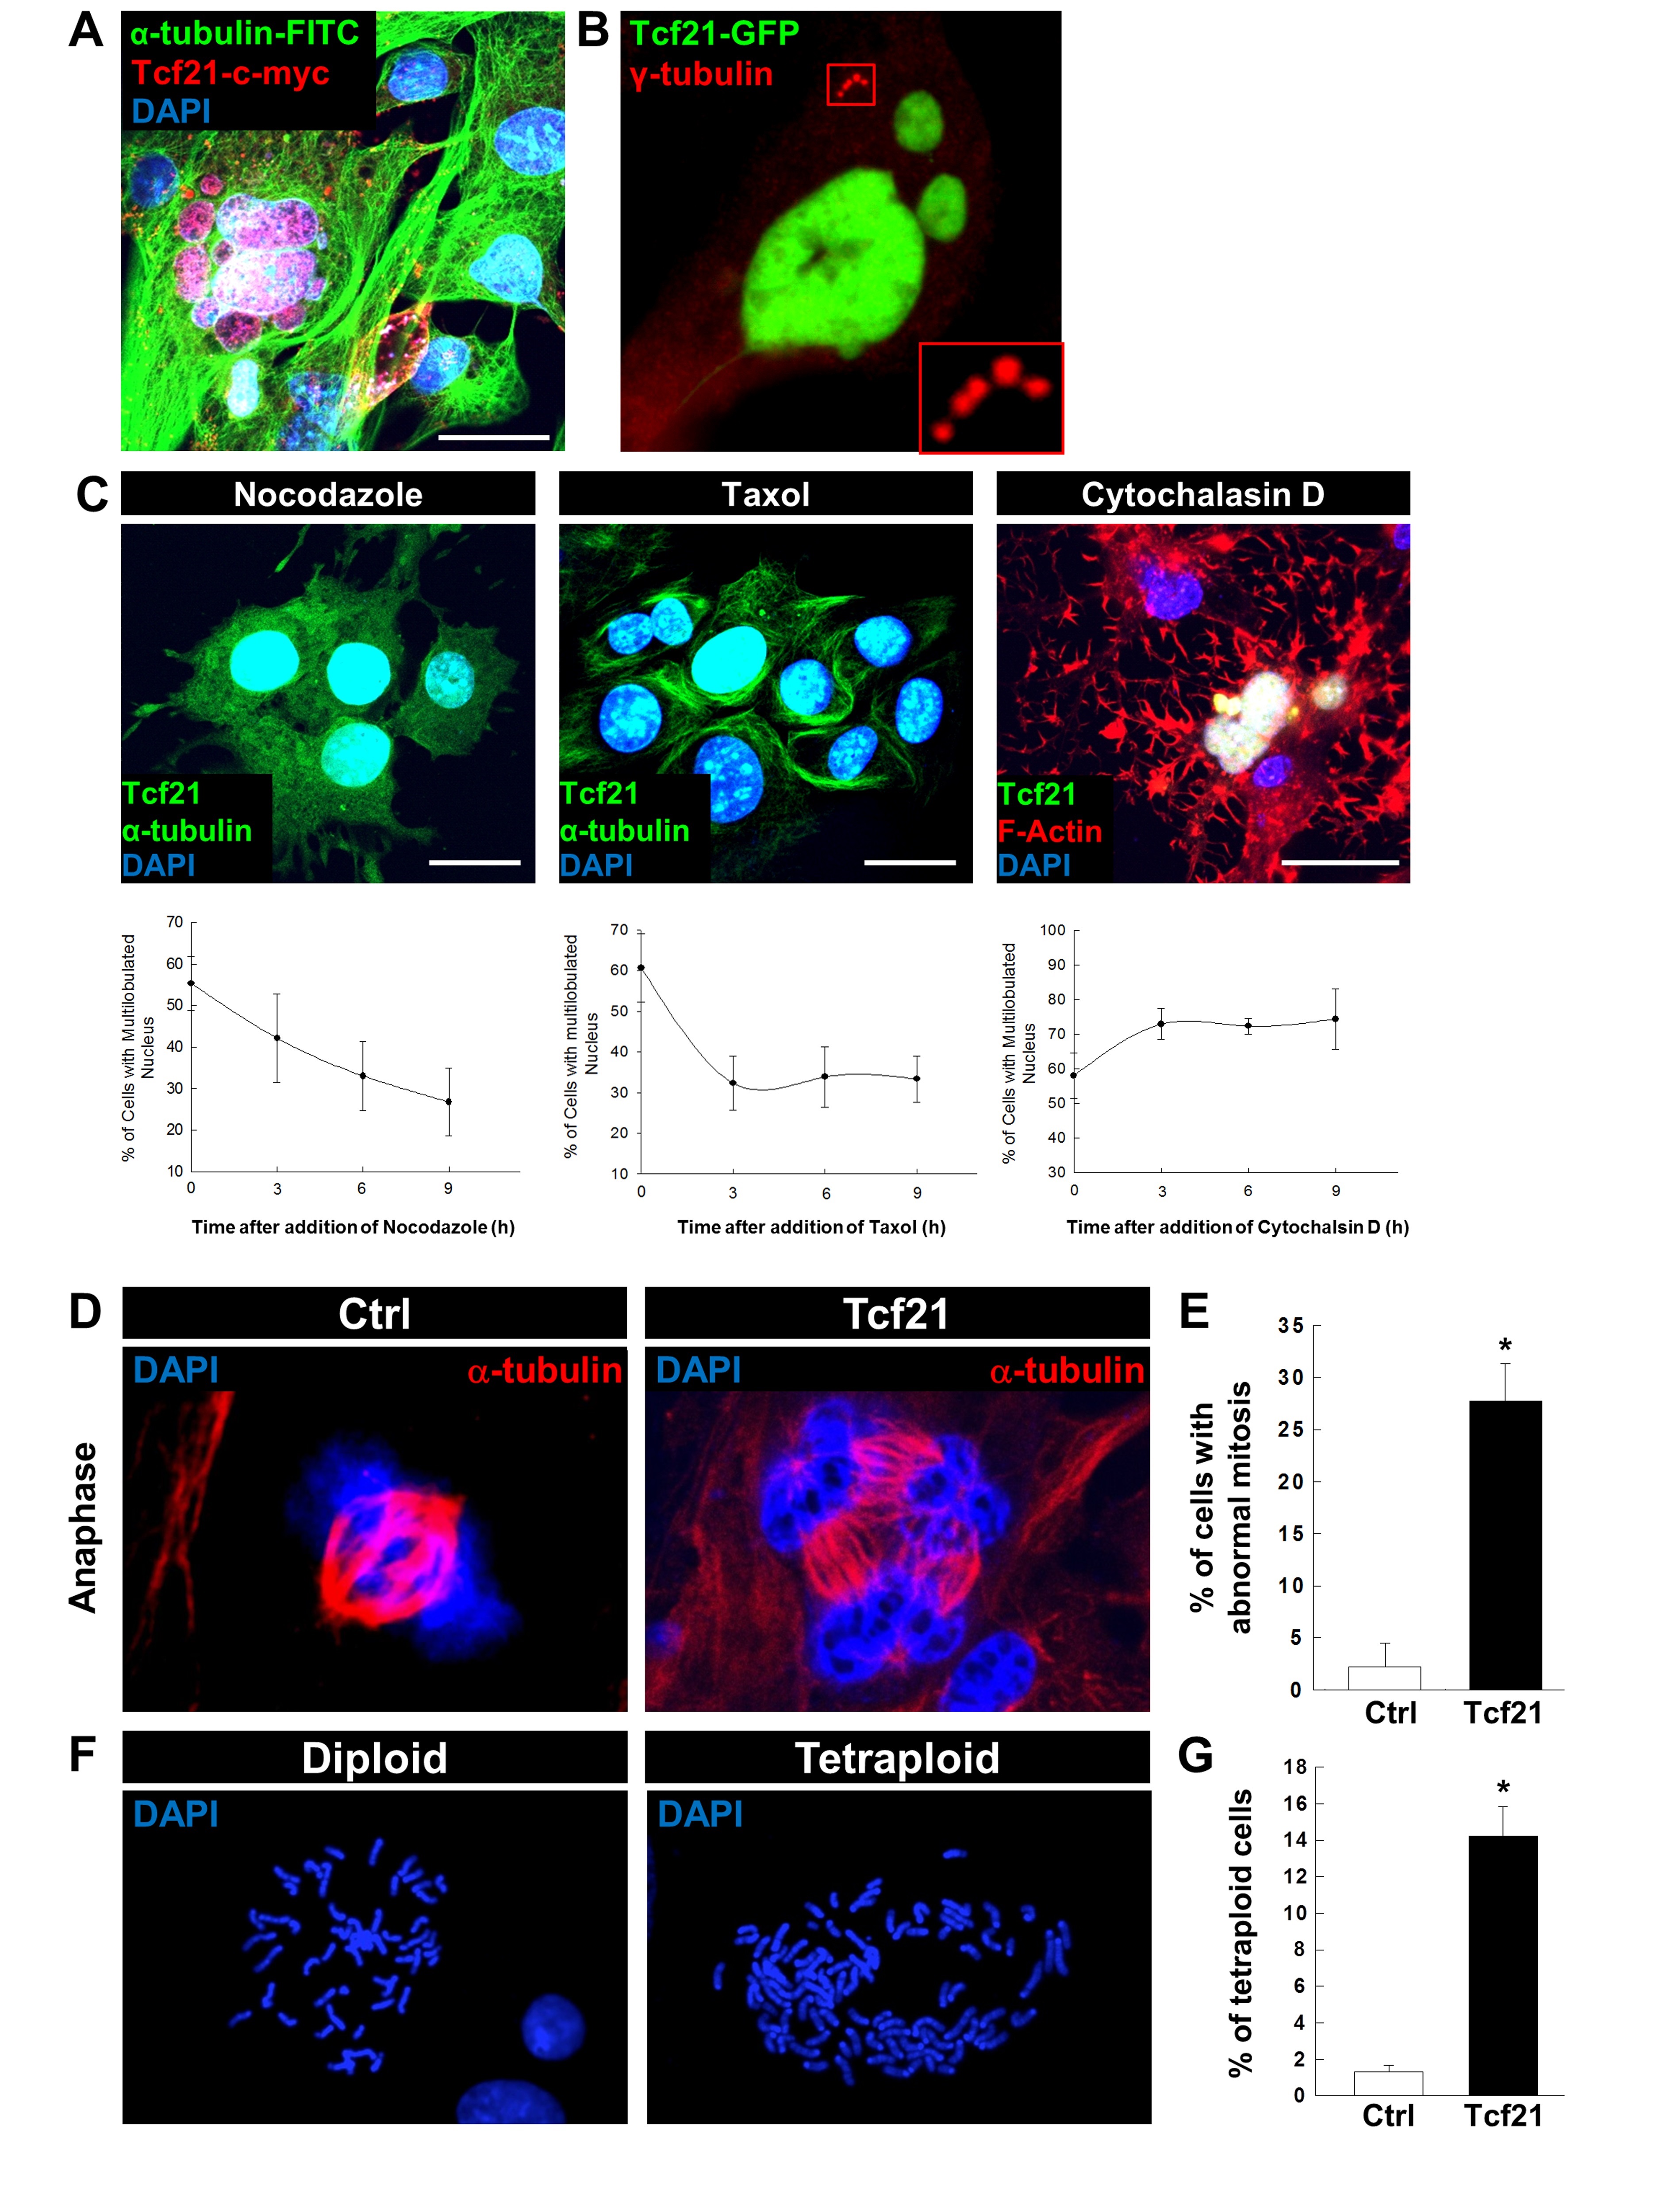
Since we observed DNA synthesis together with MBM in PEC-Tcf21, we studied mitosis by staining for α-tubulin as one monomer of microtubules and γ-tubulin, the major tubulin of centrosomes. In contrast to the control-transfected PEC, we found that MBM (Fig. 3A) was accompanied by a multiplication of centrosomes (Fig. 3B). Furthermore, we have found that this multilobulation was reversible after the addition of the microtubule inhibitors nocodazole as well as taxol (Fig. 3C). Incubation with cytochalasin D, an inhibitor of the polymerization of actin, did not affect the number of cells with multilobulated nuclei (Fig. 3C).
Additionally, we have found that Tcf21-transfected PECs developed 3-4 or sometimes more than 5 centrosomes. By the staining for α-tubulin, we identified that Tcf21-transfected cells developed multiple spindle apparatuses which were arrested in the anaphase (Fig. 3D). The percentage of cells with such a multiple and incomplete mitosis was up to 28±5% compared to the control (2±3%) (Fig. 3E). Moreover, 14±2% of the Tcf21-transfected PECs showed a significant increase of tetraploidy in the metaphase preparation compared to the control (Fig. 3F, G).
ChIP-Seq analysis identifies genome wide Tcf21-binding sites
Since Tcf21 seems to play a central role for the maintenance of the glomerulus in vivo, we wanted to identify important and novel binding partners of TCF21. Therefore, we performed a chromatin immunoprecipitation followed by DNA-Sequencing (ChIP-Seq) of chromatin isolated from Tcf21-transfected PECs. The data were compared to the control cells that were transfected with an empty vector.
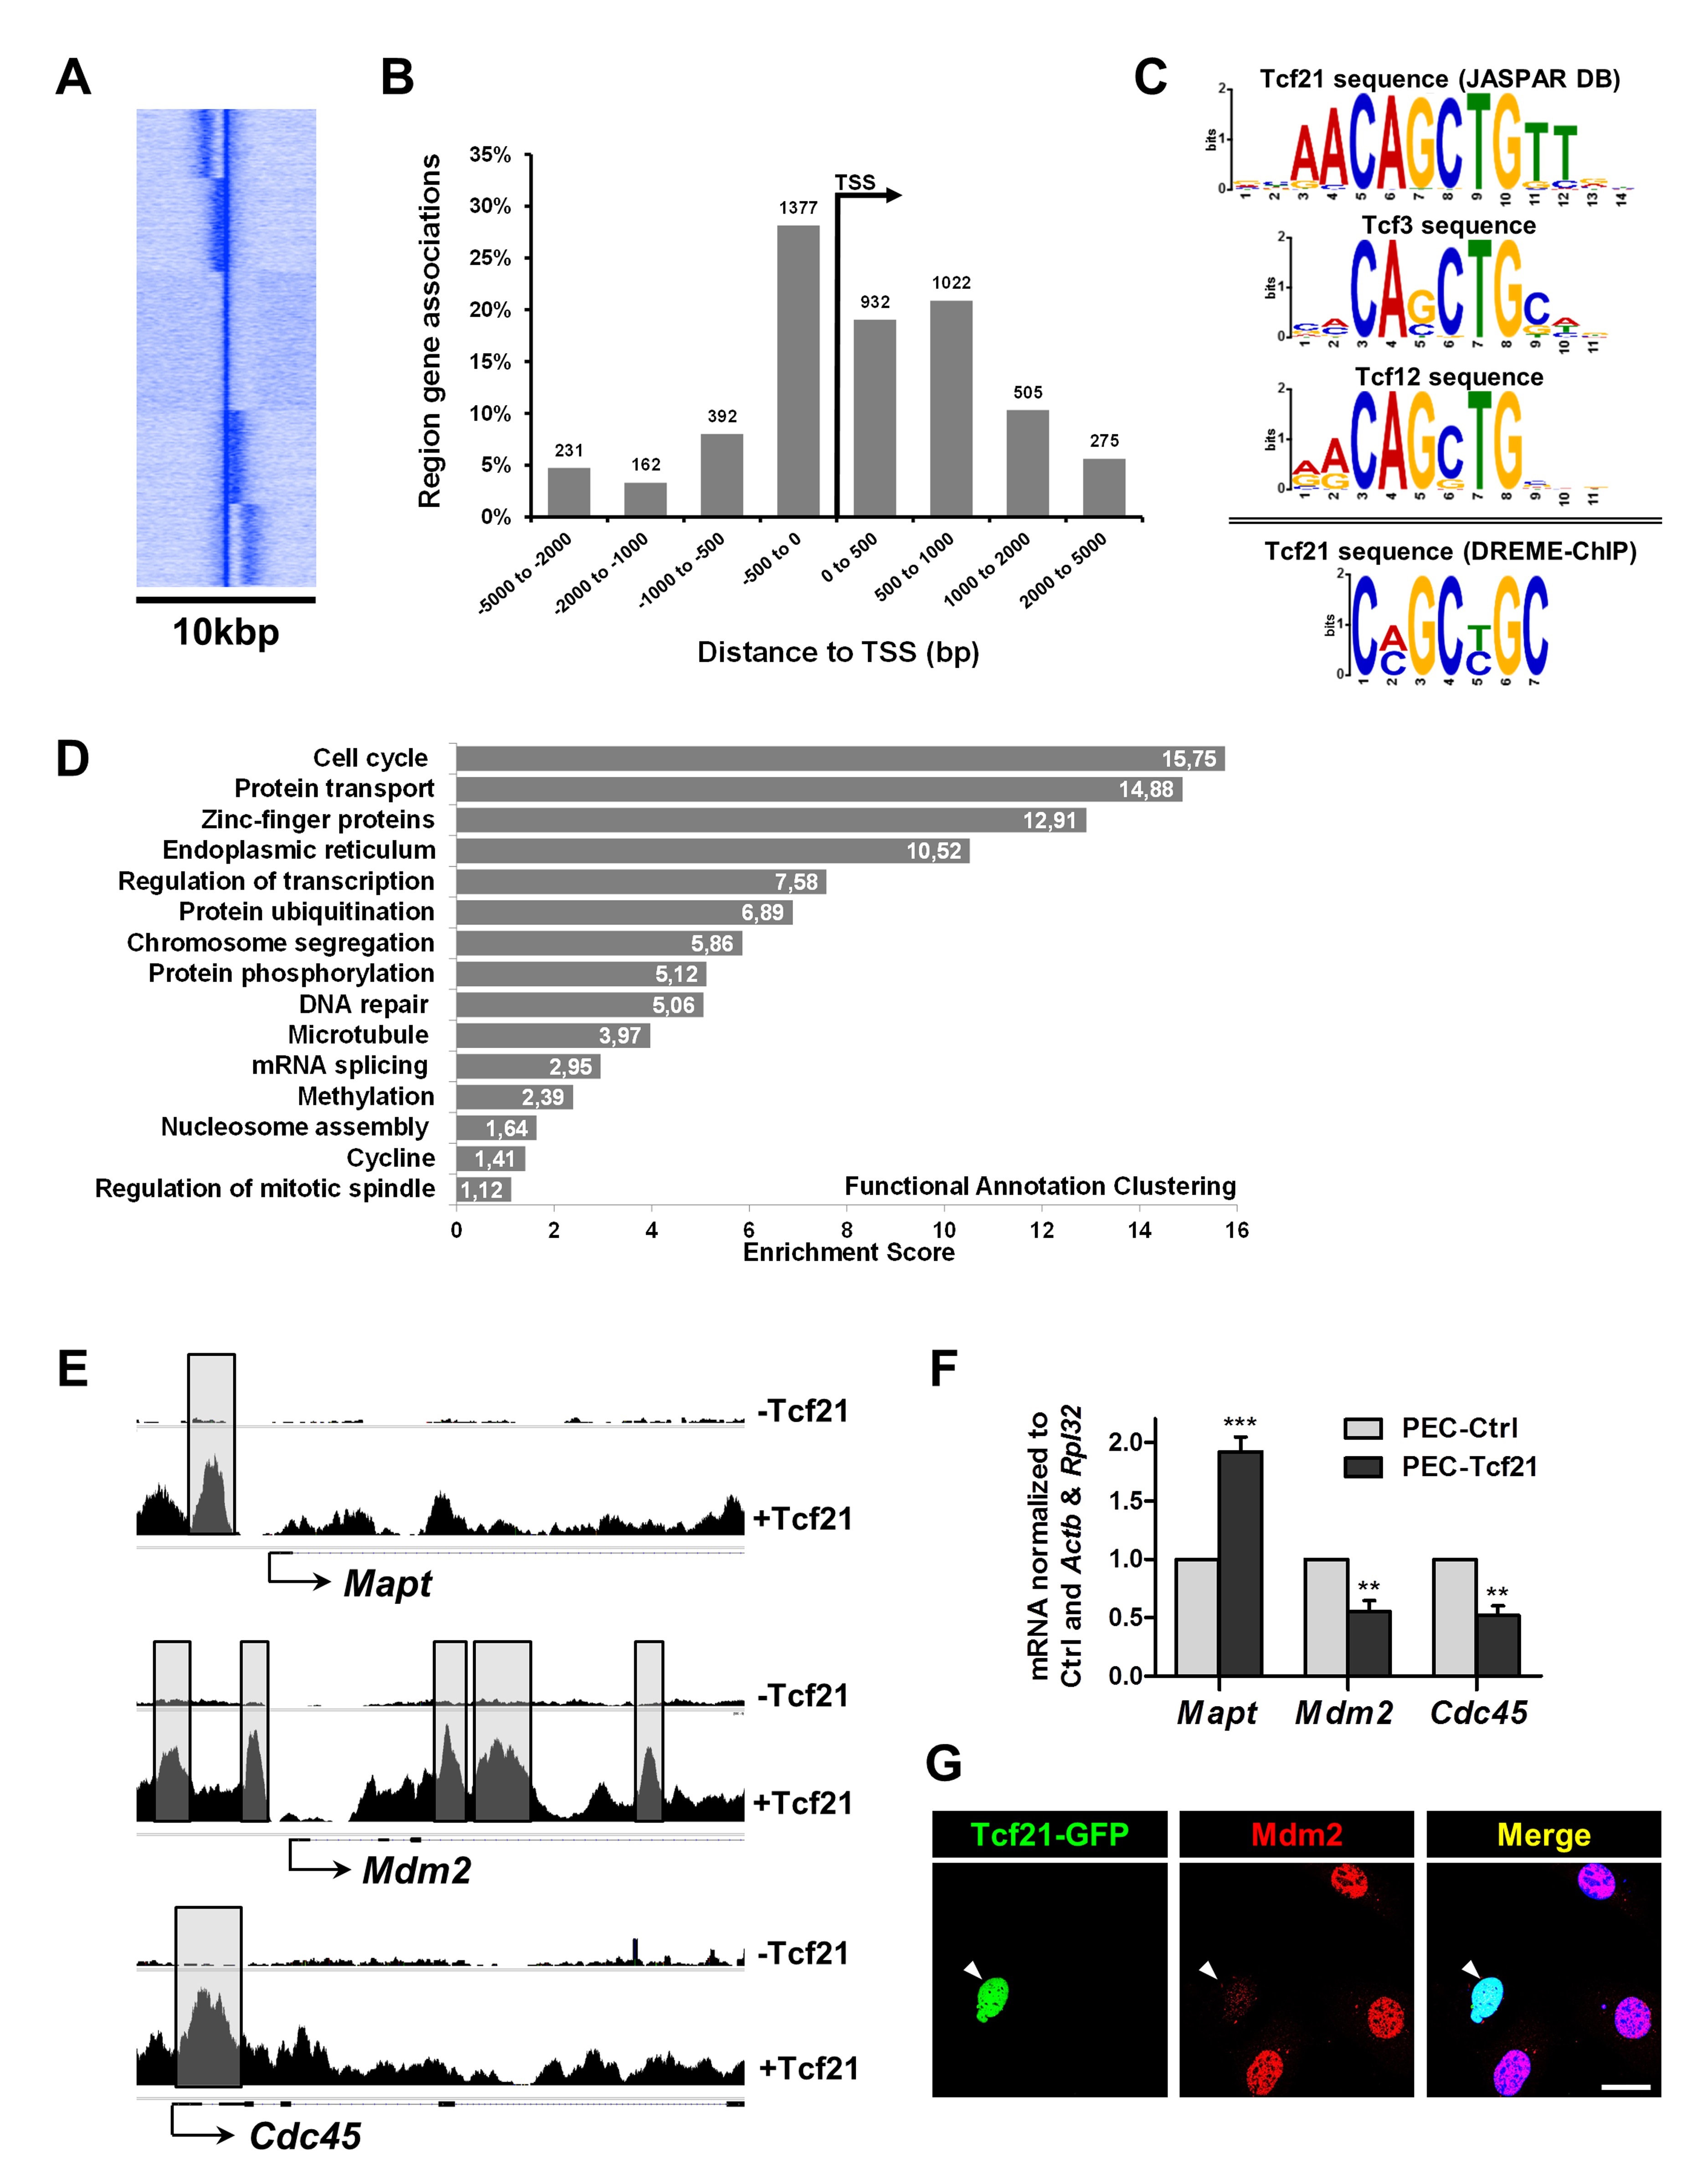
Our ChIP-Seq analysis identified 9125 peaks (putative Tcf21 target genes). To create density distributions around transcription start sites (TSSs), heat maps were created using SeqMINER [37] (Fig. 4A). We next mapped these Tcf21-binding sites and found about 54% of Tcf21-binding sites within ±5 kbp of any TSS (Fig. 4B). 76% of these binding sites were approximately ±1 kbp around the TSSs. The availability of sequence information across a large number of TF binding sites allowed the identification of the canonical binding sequence of Tcf21.
By de novo TF motif enrichment within the Tcf21 peaks, we identified the nucleotide sequence CAGCTG (23.6% of peaks, P = 4.8e-042) (Fig 4C). We found that this sequence matched the CANNTG sequence. This is a common E-box binding motif used by bHLH factors. Moreover, this sequence is identical to the E-box motif that is known to mediate the binding of bHLH partners of Tcf21, including Tcf12 and Tcf3 (Fig. 4C) [39].
Interestingly, many of these Tcf21 target genes are involved in the regulation of the cell cycle, cell division, microtubule-based processes and chromosome segregation (Supplementary Table 4).
Additionally, DAVID was used to perform functional annotation clustering on peaks in relation to TSSs [34]. Peak-associated genes showed also a clear enrichment of cell cycle genes (Fig. 4D). We found several Tcf21 peaks in the promoter regions of cell cycle genes like Mapt, Mdm2 or Cdc45 (peaks highlighted with gray boxes in Fig. 4E). By qRT-PCR, we showed that Mapt was highly up-regulated in the presence of Tcf21 (92±12%) (Fig. 4F). In contrast, Cdc45 which decreased by 52±8% as well as Mdm2 by 55±10%, a protein know to induce the mitotic catastrophy (Fig. 4F). The downregulation of Mdm2 due to Tcf21 transfection was also confirmed by immunostaining (Fig. 4G). Furthermore, we found Tcf21 bindings sites in the promoter regions of p53 (Trp53; NM_001127233; Tcf21 peak 43bp from TSS) and p21 (Cdkn1a; NM_001111099; Tcf21 peak -38bp from TSS), which are important regulators of the cell cycle.
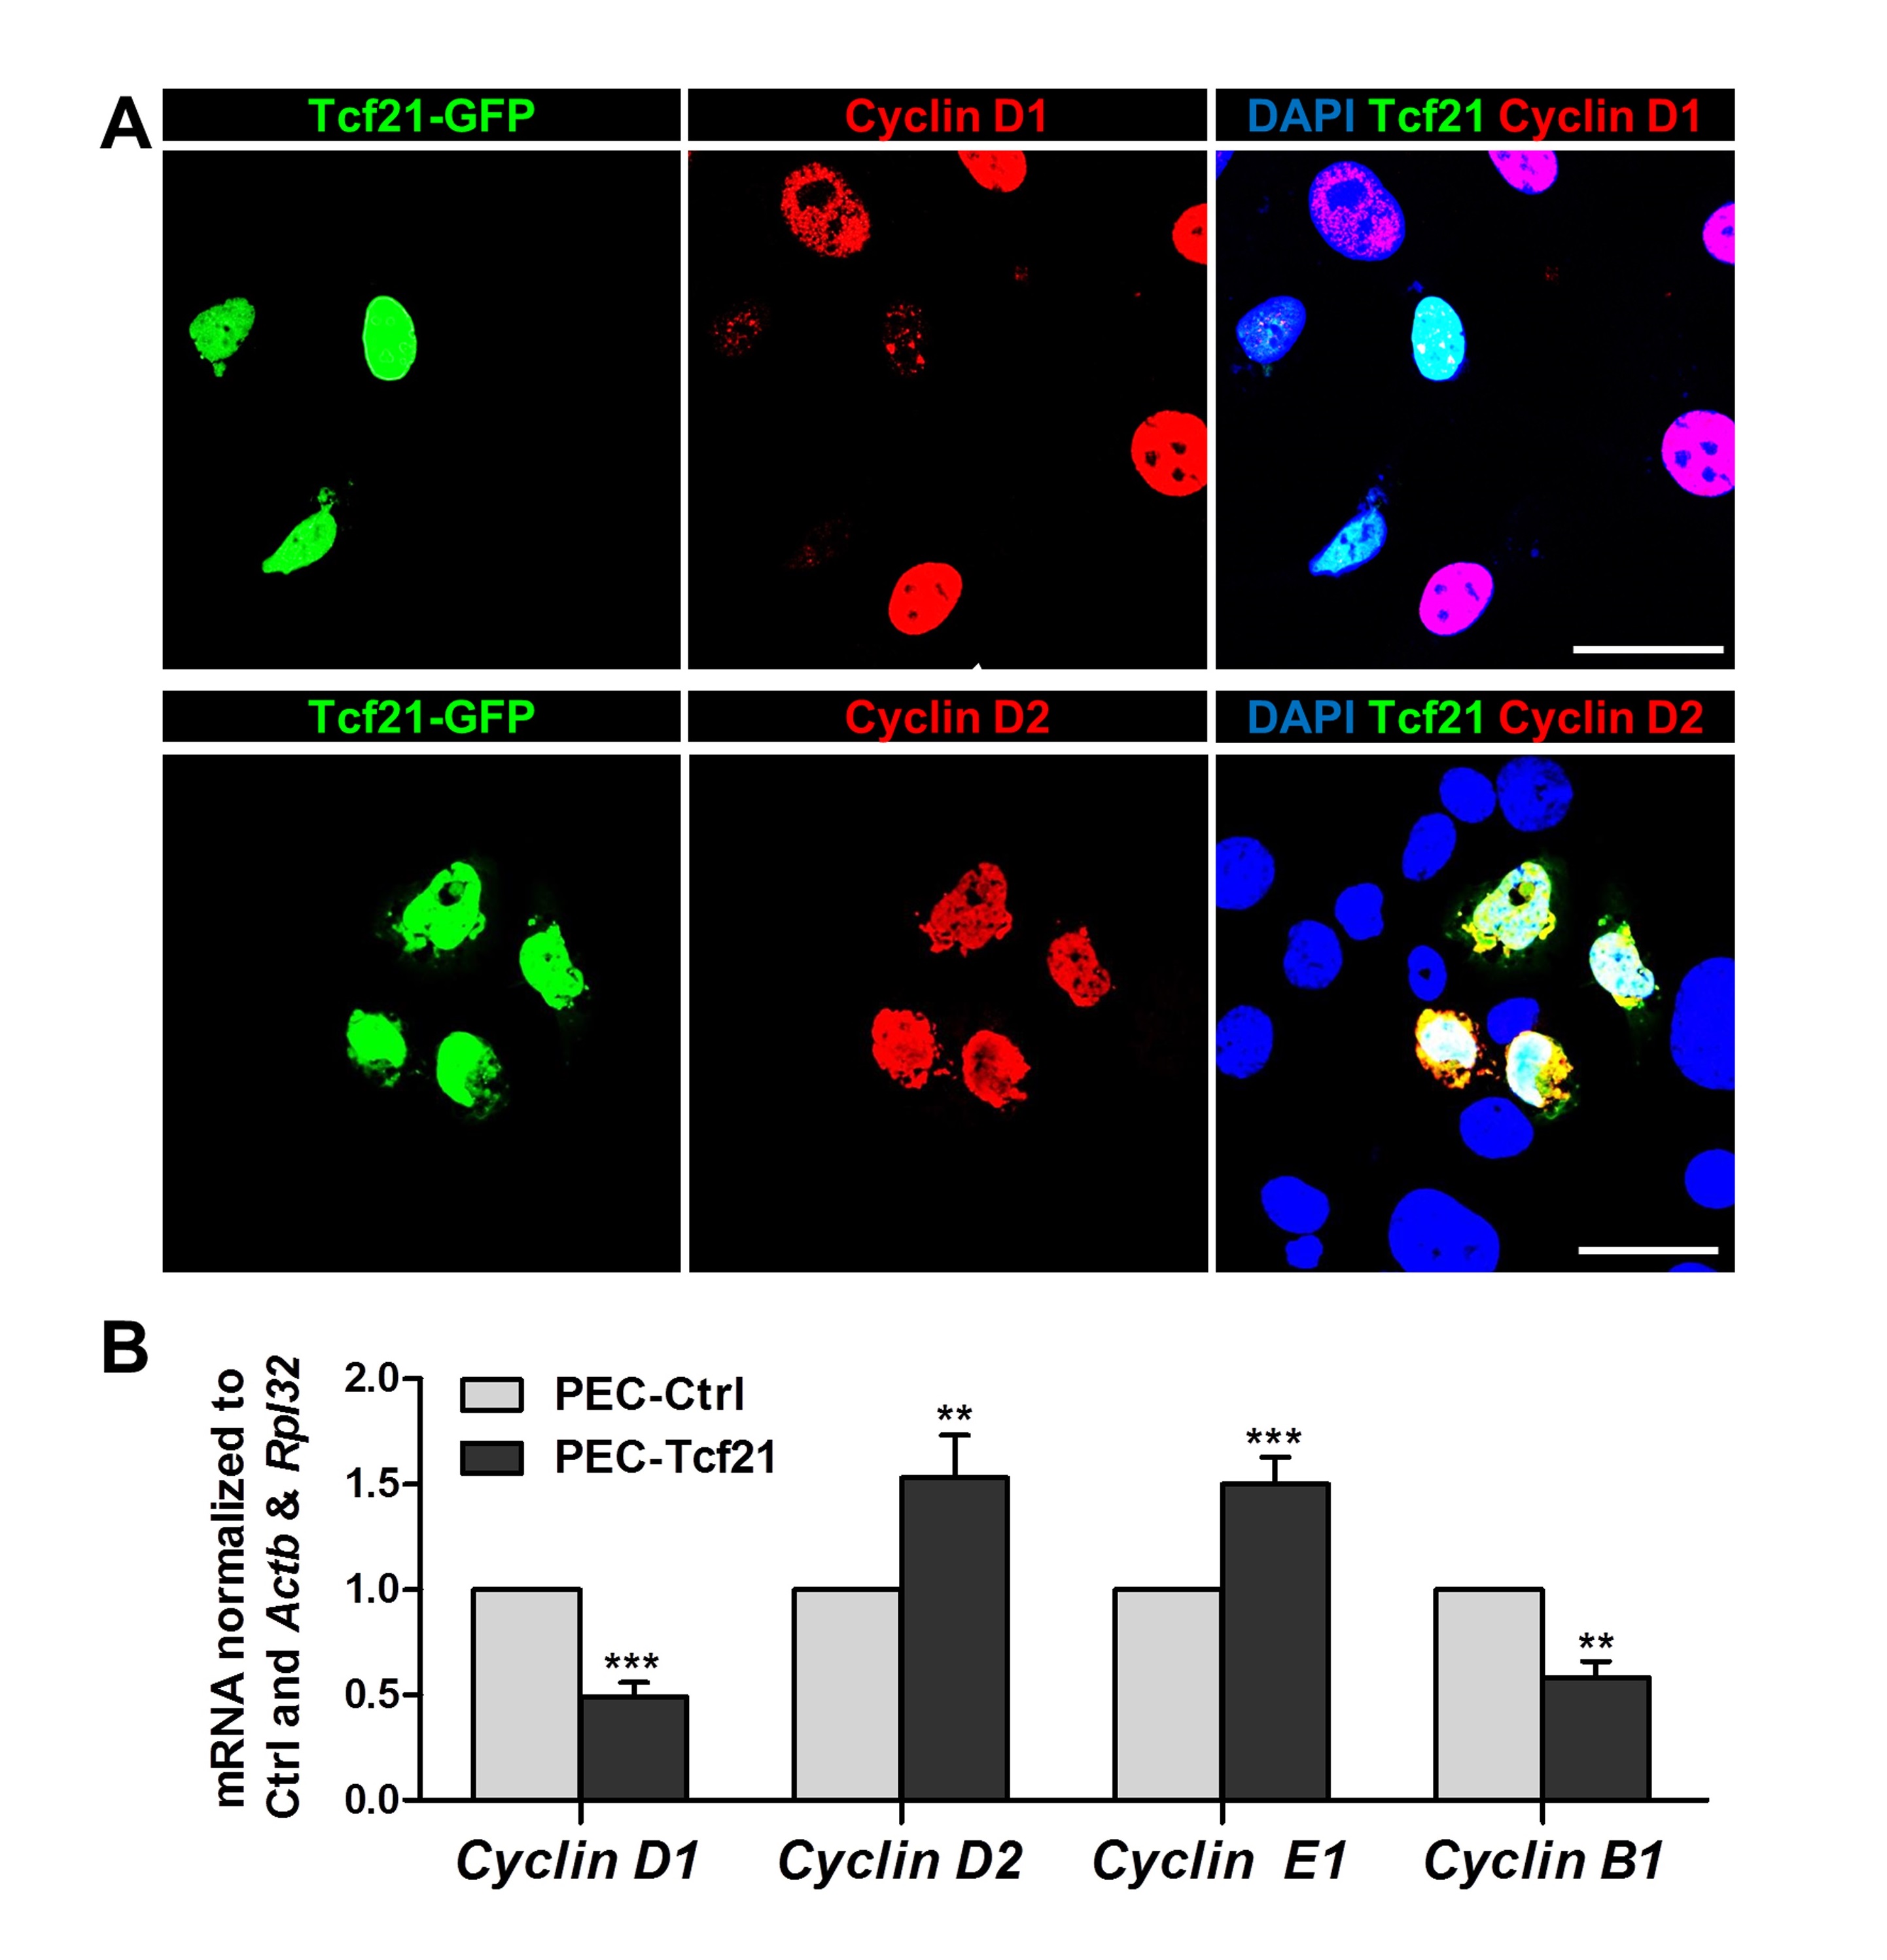
Tcf21 regulates the expression of specific cyclins
Since Tcf21 induced incomplete mitosis, we studied the expression of specific cyclins like D1 and D2 after the transfection with Tcf21 (Fig. 5A). By immunofluorescence staining we have found a downregulation of cyclin D1 and an upregulation of cyclin D2.
By qRT-PCR, we demonstrated that cyclin D1 and B1 are significantly reduced by 49±7% and 58±8%, respectively, due to the expression of Tcf21 in PECs. In contrast, the expression of cyclin D2 and E1 was significantly increased by 153±20% and 150±13% (Fig. 5B).
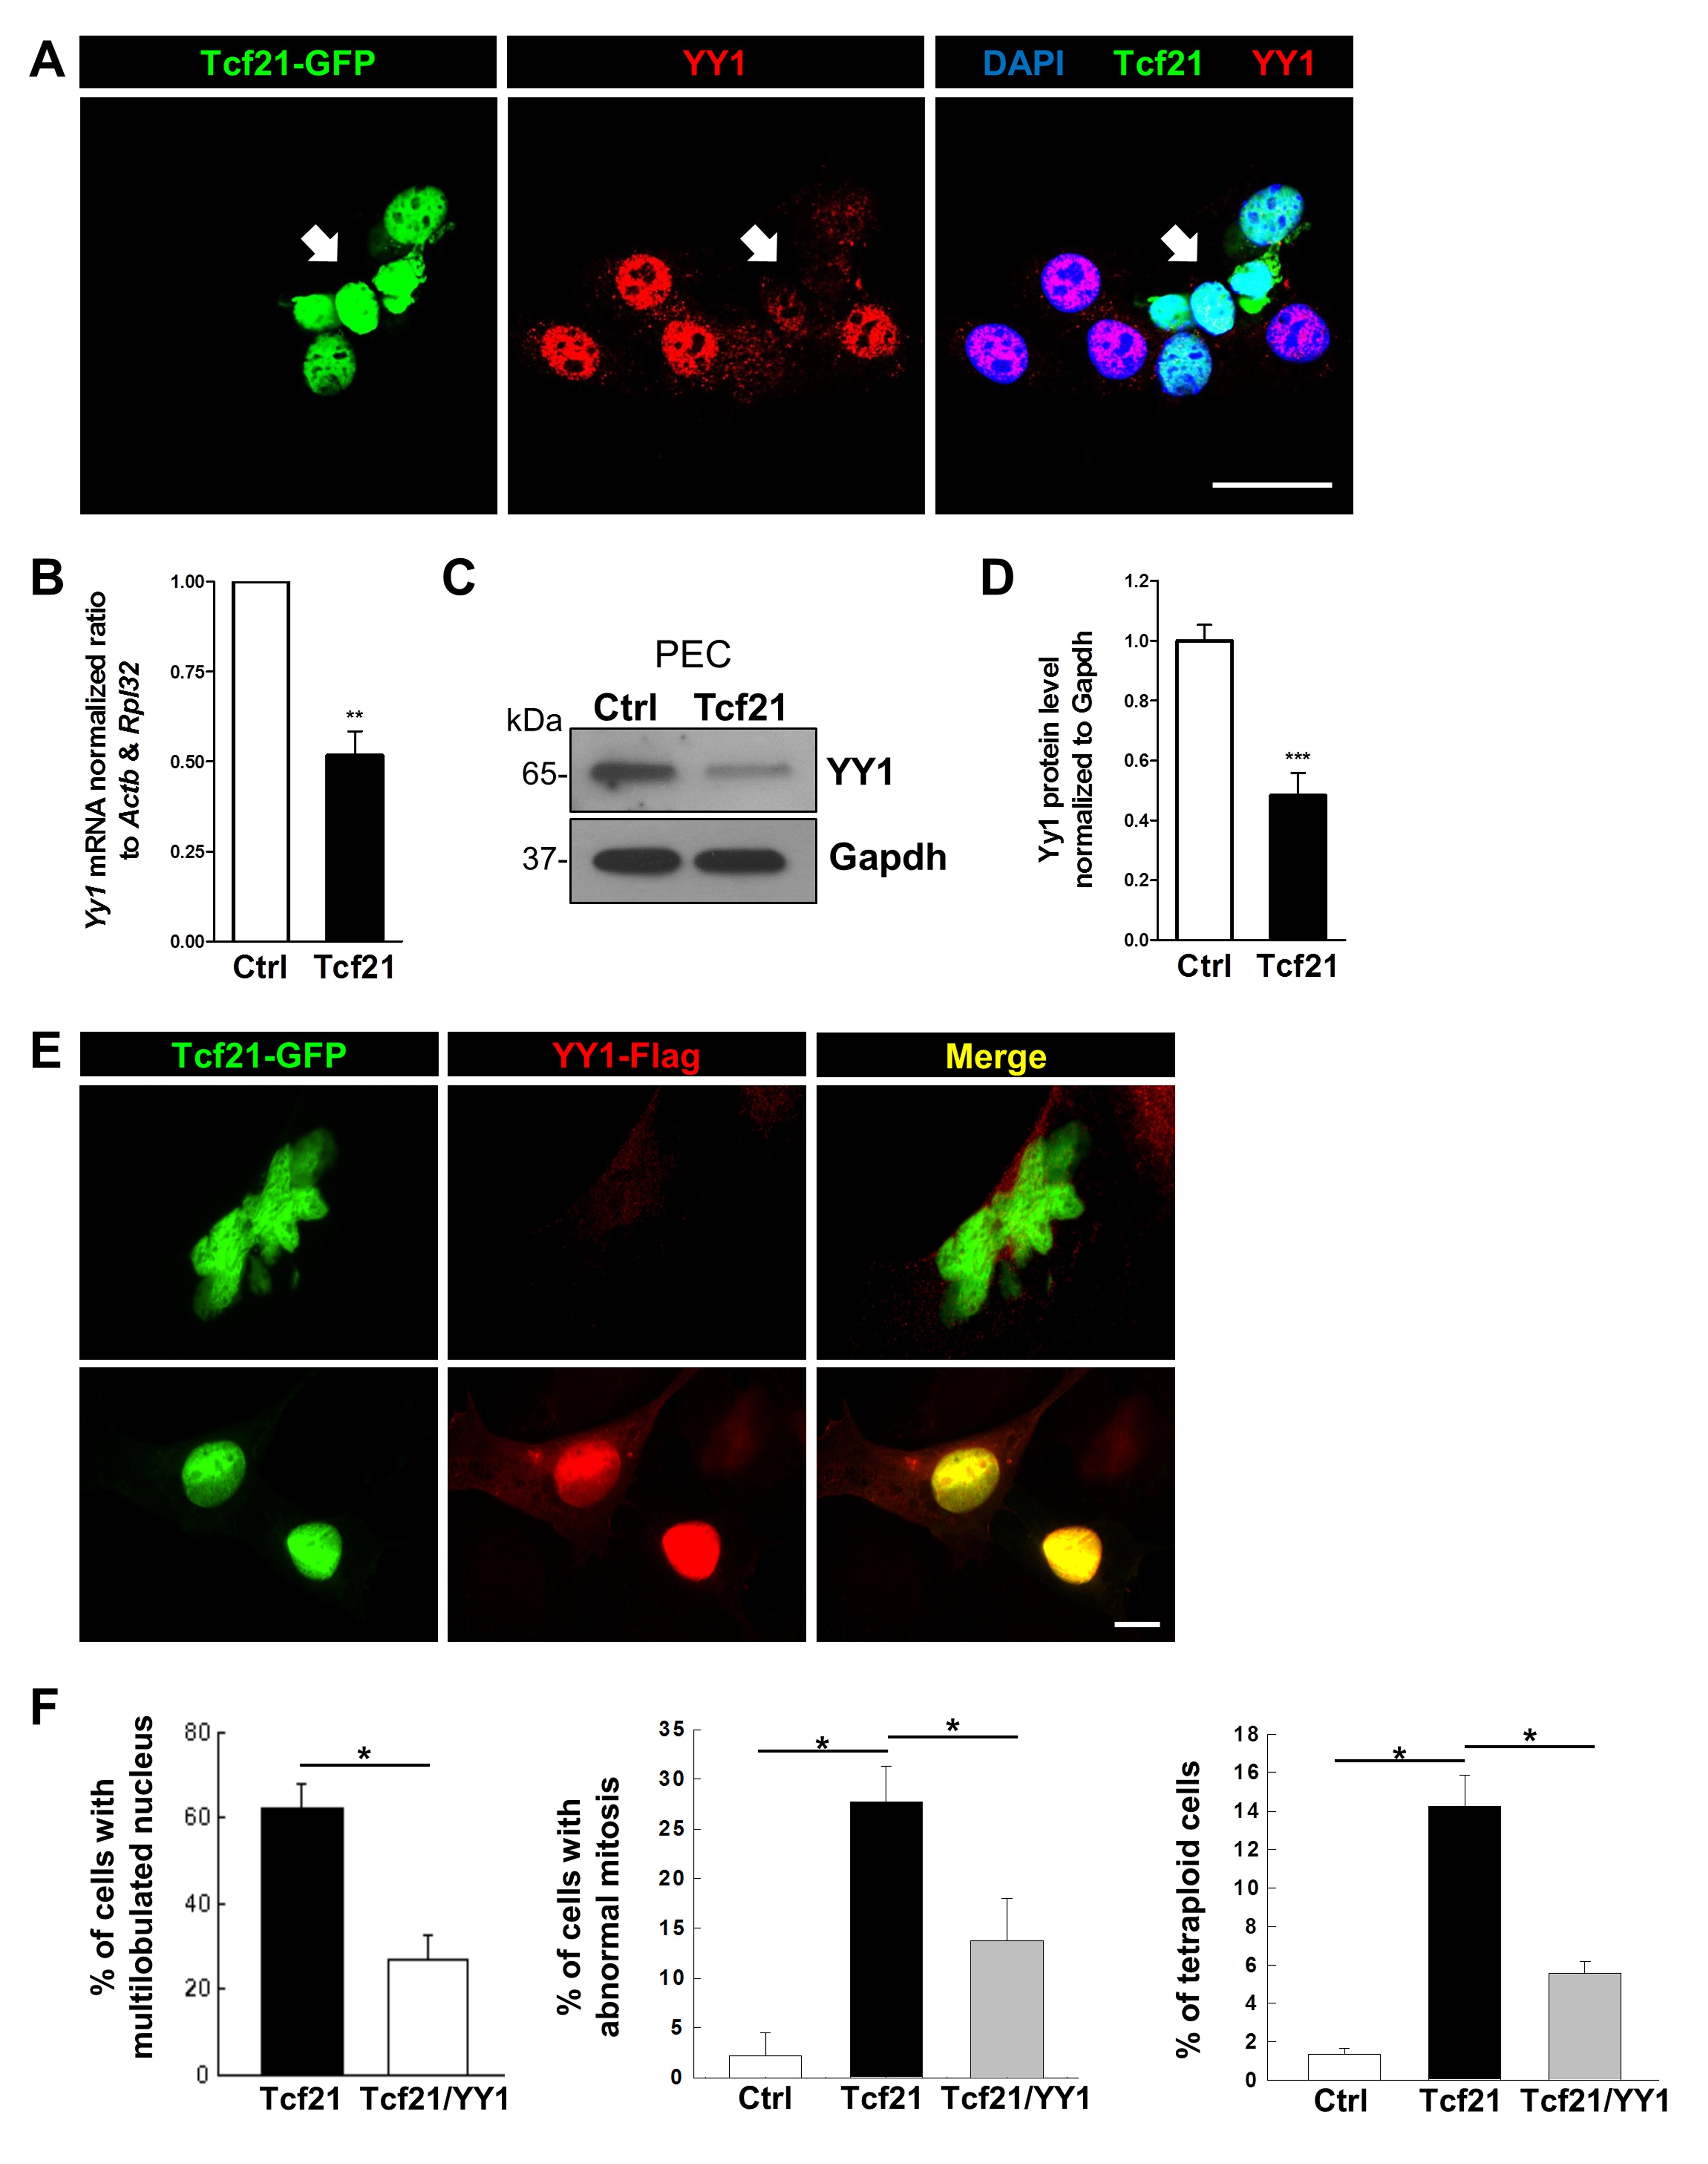
YY1 rescues the Tcf21-induced MBM
Since it is known that YY1, an important transcriptional repressor protein, is able to regulate de-/differentiation, we studied the expression of YY1 in dependence on Tcf21. We have found by qRT-PCR that YY1 is significantly downregulated (-52±7%) in Tcf21-PECs (Fig. 6B) which was confirmed by immunofluorescence staining (Fig. 4A) and Western blot (-48±8%) (Fig. 6C, D).
Moreover, we found that the co-expression of YY1 in Tcf21-PECs rescued the MBM. We determined a significant reduction of multilobulation, budding as well as tetraploidy (by 62 %) shown in Fig. 6E and F. These results demonstrated that YY1 and Tcf21 are important regulators of the cell cycle.
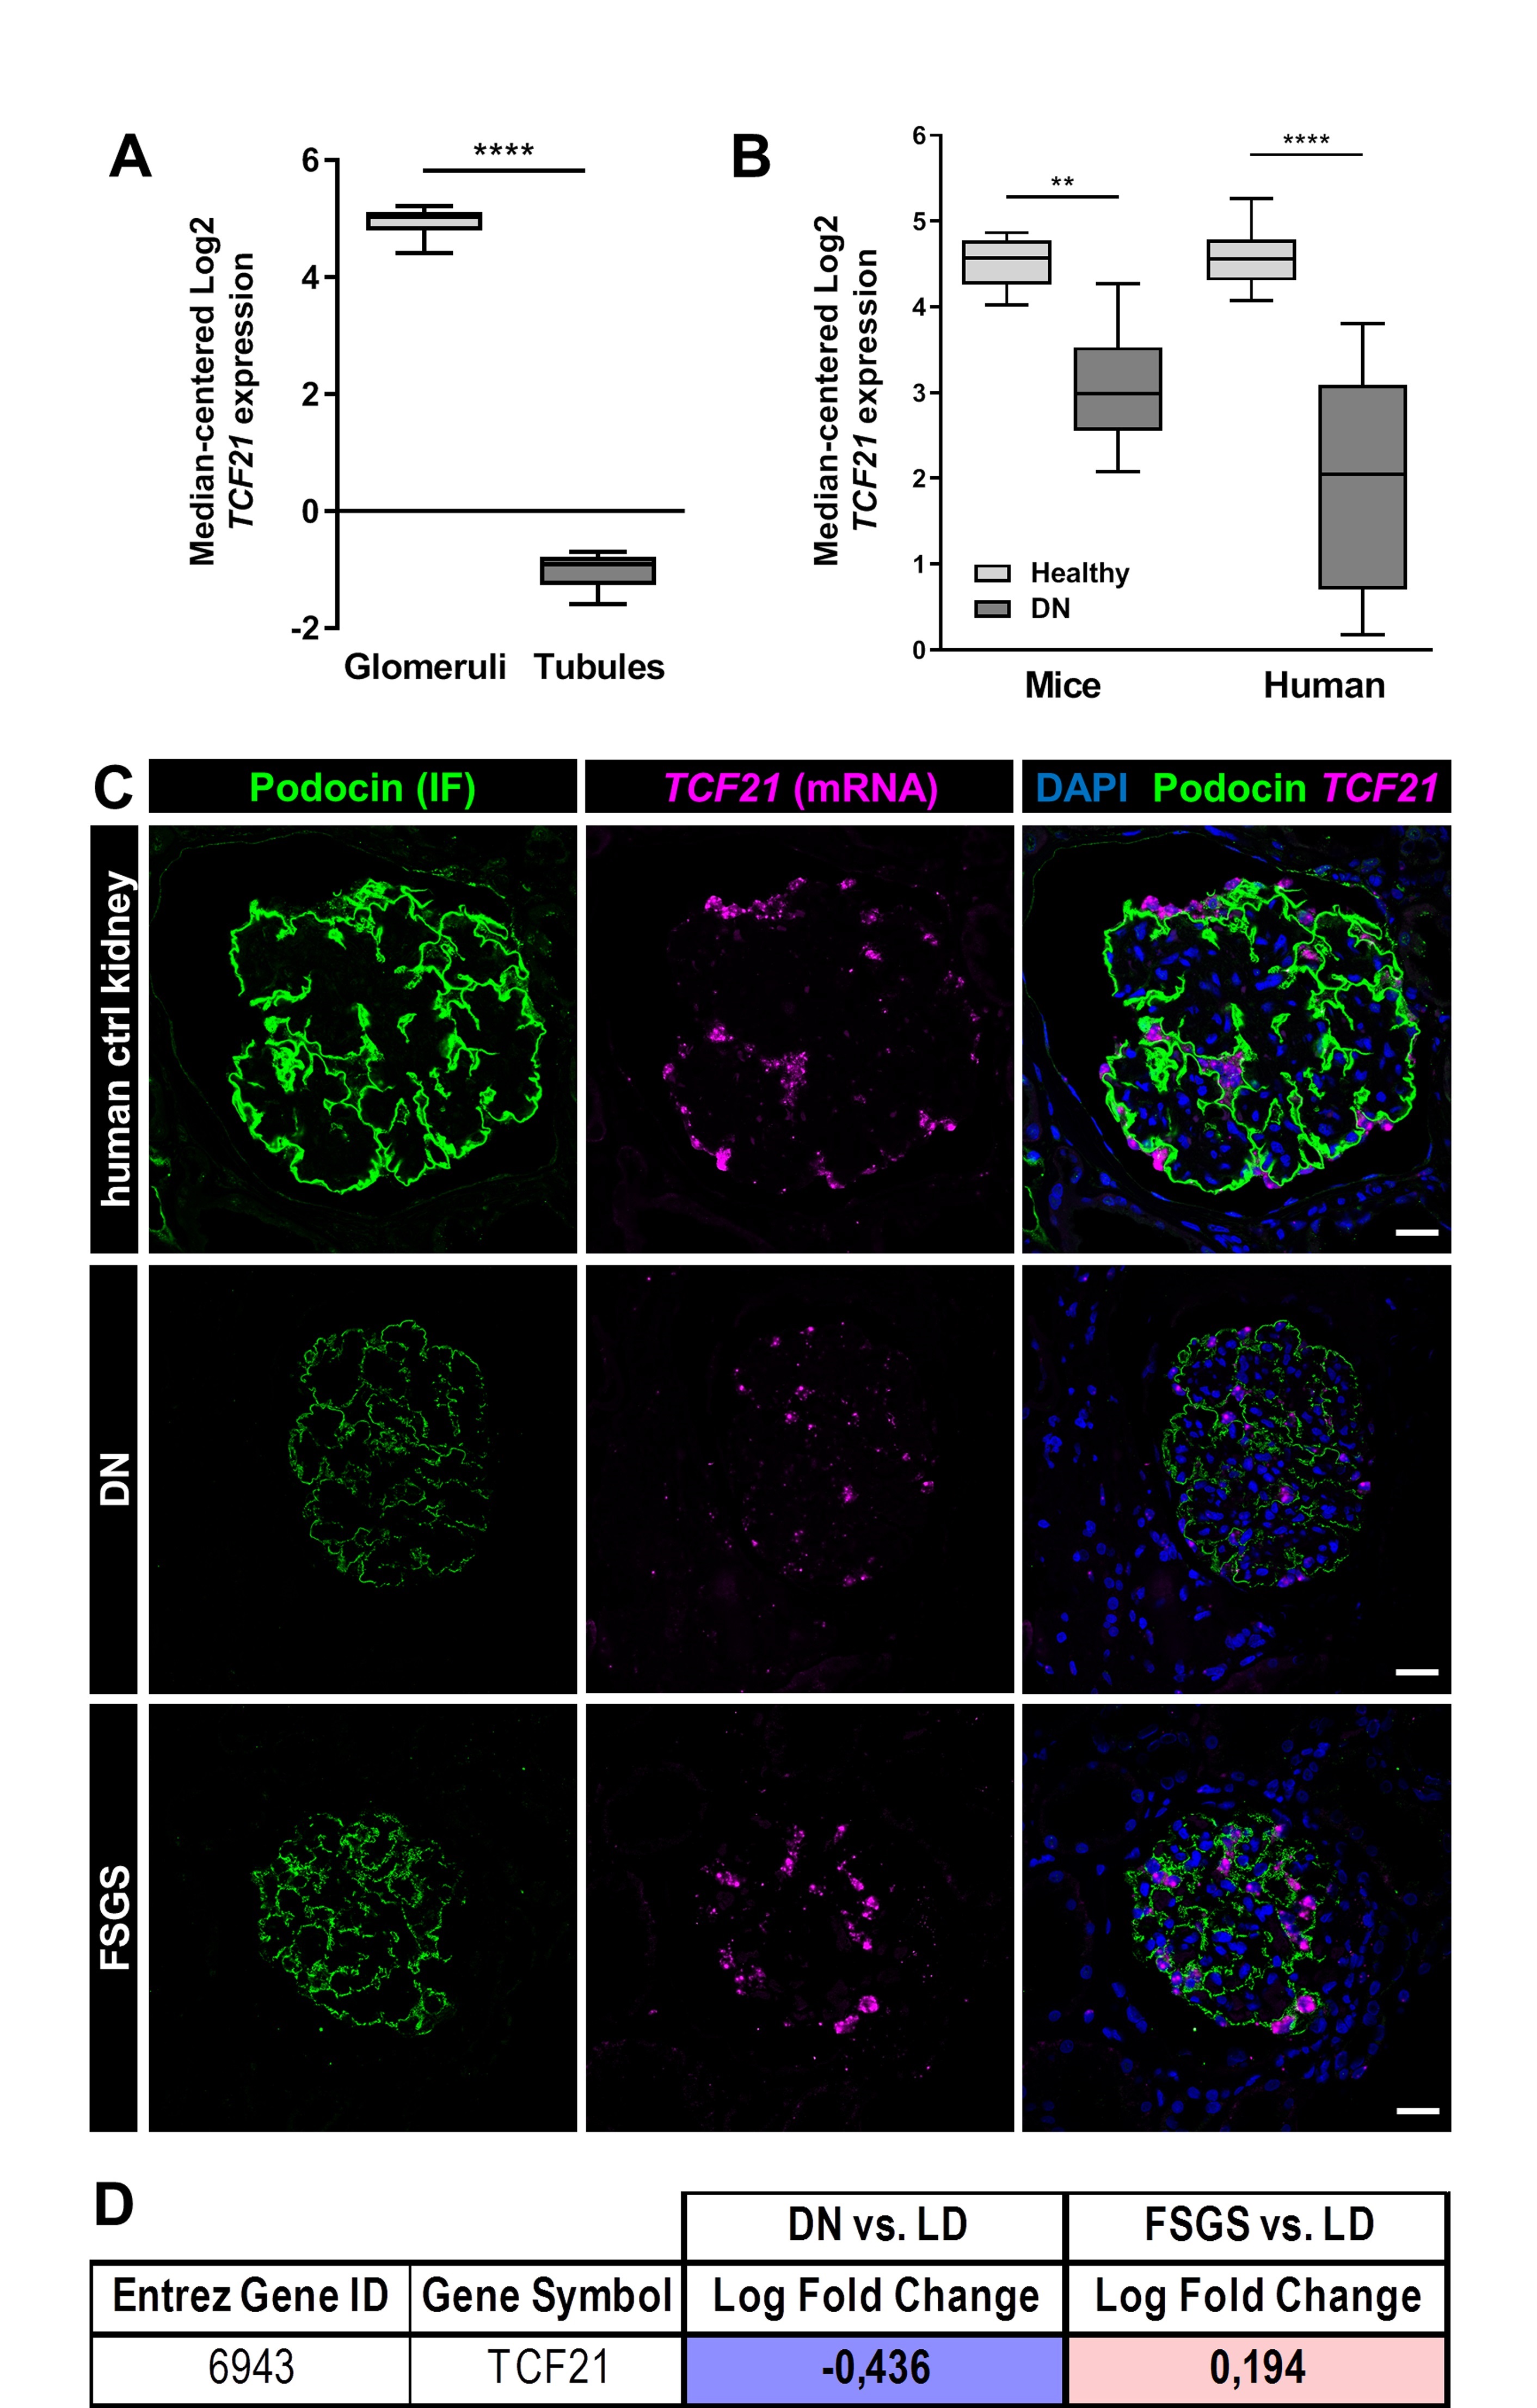
TCF21 expression is down-regulated in patients suffering from diabetic nephropathy
An analysis of microarray data of the Nephroseq database [40–42] has shown that the expression of TCF21 in glomeruli was 3.4 times higher compared to the expression in the tubules of human kidneys (Fig. 7A). However, the expression of Tcf21 mRNA was significantly decreased in mice (2.6 times) and human patients (6.3 times) suffering from diabetic nephropathy (DN) (Fig. 7B).
These results were verified by single mRNA in situ hybridization (Fig. 7C) of human biopsies of patients suffering from DN and FSGS compared to healthy control. The results suggest that podocytes in patients with DN tend to have a lower expression of Tcf21, which could then influence the maintenance of the podocytes. Furthermore, we measured the mRNA expression of TCF21 in microdissected glomeruli originated from renal biopsies of patients suffering from DN and FSGS and compared to mRNA levels of healthy living donors (Fig. 7D) (European Renal cDNA Bank) [25, 26]. We observed that patients with DN showed a significant decrease of TCF21 mRNA compared to the control (log fold change: -0.44). In contrast, patients suffering from focal segmental glomerulosclerosis (FSGS), showed a slight, but significant increase of TCF21 mRNA expression (log fold change: 0.19).
The authors thank Mandy Weise for technical assistance and Robert Weissmann and Lars Jensen for ChIP-Seq bioinformatic analysis. Part of the work was also supported by an Emerging Fields Initiative (EFI) for Cell Cycle in Disease and Regeneration (CYDER) from the Friedrich-Alexander-Universität Erlangen-Nürnberg (FAU) (Germany). We also thank all participating centers of the European Renal cDNA Bank - Kröner-Fresenius biopsy bank (ERCB-KFB) and their patients for their cooperation. Active members at the time of the study please see (Shved et al., Sci Rep 2017;7(1):8576).
Author Contributions
The study was designed by NE, KE and FK; FK and SS contributed to the cell culture experiments; FK performed ChIP-Seq, supported by AWK; biopsies were handled and analyzed by FK, NA, FS and KA; SS and FS performed RNAscope®; all other experiments were performed by FK; experimental data was analyzed by FK; FK, NE and KE wrote the main manuscript text. FK prepared figures. All authors reviewed the manuscript.
Funding
This work was supported by a grant of the European Foundation for the Study of Diabetes/ Novo Nordisk to KE and by a grant of the EU (COST action BM0702 “Kidney and Urinary Proteomics – EuroKUP”) and of the Federal Ministry of Education and Research (BMBF, grant 01GM1518B, STOP‐FSGS) to NE as well as by the Südmeyer und Dr. Büchtemann Stiftung. This work was also supported by the Research Network Molecular Medicine of the University Medicine Greifswald. The ERCB-KFB was supported by the Else Kröner-Fresenius Foundation.
The authors declare no competing financial interests.
| 1 Berger K, Moeller MJ: Podocytopenia, parietal epithelial cells and glomerulosclerosis. Nephrol Dial Transplant 2014;29:948-950. https://doi.org/10.1093/ndt/gft511 |
||||
| 2 Marshall CB, Shankland SJ: Cell cycle and glomerular disease: a minireview. Nephron Exp Nephrol 2006;102:e39-48. https://doi.org/10.1159/000088400 |
||||
| 3 Wharram BL, Goyal M, Wiggins JE, Sanden SK, Hussain S, Filipiak WE, Saunders TL, Dysko RC, Kohno K, Holzman LB, Wiggins RC: Podocyte depletion causes glomerulosclerosis: diphtheria toxin-induced podocyte depletion in rats expressing human diphtheria toxin receptor transgene. J Am Soc Nephrol 2005;16:2941-2952. https://doi.org/10.1681/ASN.2005010055 |
||||
| 4 Appel D, Kershaw DB, Smeets B, Yuan G, Fuss A, Frye B, Elger M, Kriz W, Floege J, Moeller MJ: Recruitment of podocytes from glomerular parietal epithelial cells. J Am Soc Nephrol 2009;20:333-343. https://doi.org/10.1681/ASN.2008070795 |
||||
| 5 Berger K, Schulte K, Boor P, Kuppe C, van Kuppevelt, Toin H, Floege J, Smeets B, Moeller MJ: The regenerative potential of parietal epithelial cells in adult mice. J Am Soc Nephrol 2014;25:693-705. https://doi.org/10.1681/ASN.2013050481 |
||||
| 6 Eng DG, Sunseri MW, Kaverina NV, Roeder SS, Pippin JW, Shankland SJ: Glomerular parietal epithelial cells contribute to adult podocyte regeneration in experimental focal segmental glomerulosclerosis. Kidney Int 2015;88:999-1012. https://doi.org/10.1038/ki.2015.152 |
||||
| 7 Guhr SSO, Sachs M, Wegner A, Becker JU, Meyer TN, Kietzmann L, Schlossarek S, Carrier L, Braig M, Jat PS, Stahl RAK, Meyer-Schwesinger C: The expression of podocyte-specific proteins in parietal epithelial cells is regulated by protein degradation. Kidney Int 2013;84:532-544. https://doi.org/10.1038/ki.2013.115 |
||||
| 8 Kietzmann L, Guhr SSO, Meyer TN, Ni L, Sachs M, Panzer U, Stahl RAK, Saleem MA, Kerjaschki D, Gebeshuber CA, Meyer-Schwesinger C: MicroRNA-193a Regulates the Transdifferentiation of Human Parietal Epithelial Cells toward a Podocyte Phenotype. J Am Soc Nephrol 2015;26:1389-1401. https://doi.org/10.1681/ASN.2014020190 |
||||
| 9 Kuppe C, Gröne H, Ostendorf T, van Kuppevelt, Toin H, Boor P, Floege J, Smeets B, Moeller MJ: Common histological patterns in glomerular epithelial cells in secondary focal segmental glomerulosclerosis. Kidney Int 2015;88:990-998. https://doi.org/10.1038/ki.2015.116 |
||||
| 10 Ohse T, Vaughan MR, Kopp JB, Krofft RD, Marshall CB, Chang AM, Hudkins KL, Alpers CE, Pippin JW, Shankland SJ: De novo expression of podocyte proteins in parietal epithelial cells during experimental glomerular disease. Am J Physiol Renal Physiol 2010;298:F702-F711. https://doi.org/10.1152/ajprenal.00428.2009 |
||||
| 11 Ronconi E, Sagrinati C, Angelotti ML, Lazzeri E, Mazzinghi B, Ballerini L, Parente E, Becherucci F, Gacci M, Carini M, Maggi E, Serio M, Vannelli GB, Lasagni L, Romagnani S, Romagnani P: Regeneration of glomerular podocytes by human renal progenitors. J Am Soc Nephrol 2009;20:322-332. https://doi.org/10.1681/ASN.2008070709 |
||||
| 12 Zhang J, Hansen KM, Pippin JW, Chang AM, Taniguchi Y, Krofft RD, Pickering SG, Liu Z, Abrass CK, Shankland SJ: De novo expression of podocyte proteins in parietal epithelial cells in experimental aging nephropathy. Am J Physiol Renal Physiol 2012;302:F571-F580. https://doi.org/10.1152/ajprenal.00516.2011 |
||||
| 13 Kreidberg JA, Sariola H, Loring JM, Maeda M, Pelletier J, Housman D, Jaenisch R: WT-1 is required for early kidney development. Cell 1993;74:679-691. https://doi.org/10.1016/0092-8674(93)90515-R |
||||
| 14 Miner JH, Morello R, Andrews KL, Li C, Antignac C, Shaw AS, Lee B: Transcriptional induction of slit diaphragm genes by Lmx1b is required in podocyte differentiation. J Clin Invest 2002;109:1065-1072. https://doi.org/10.1172/JCI0213954 |
||||
| 15 Sadl V, Jin F, Yu J, Cui S, Holmyard D, Quaggin S, Barsh G, Cordes S: The mouse Kreisler (Krml1/MafB) segmentation gene is required for differentiation of glomerular visceral epithelial cells. Dev Biol 2002;249:16-29. https://doi.org/10.1006/dbio.2002.0751 |
||||
| 16 Takemoto M, He L, Norlin J, Patrakka J, Xiao Z, Petrova T, Bondjers C, Asp J, Wallgard E, Sun Y, Samuelsson T, Mostad P, Lundin S, Miura N, Sado Y, Alitalo K, Quaggin SE, Tryggvason K, Betsholtz C: Large-scale identification of genes implicated in kidney glomerulus development and function. EMBO J 2006;25:1160-1174. https://doi.org/10.1038/sj.emboj.7601014 |
||||
| 17 Quaggin SE, Vanden Heuvel, G B, Igarashi P: Pod-1, a mesoderm-specific basic-helix-loop-helix protein expressed in mesenchymal and glomerular epithelial cells in the developing kidney. Mech Dev 1998;71:37-48. https://doi.org/10.1016/S0925-4773(97)00201-3 |
||||
| 18 Quaggin SE, Schwartz L, Cui S, Igarashi P, Deimling J, Post M, Rossant J: The basic-helix-loop-helix protein pod1 is critically important for kidney and lung organogenesis. Development 1999;126:5771-5783. https://doi.org/10.1242/dev.126.24.5771 |
||||
| 19 Acharya A, Baek ST, Huang G, Eskiocak B, Goetsch S, Sung CY, Banfi S, Sauer MF, Olsen GS, Duffield JS, Olson EN, Tallquist MD: The bHLH transcription factor Tcf21 is required for lineage-specific EMT of cardiac fibroblast progenitors. Development 2012;139:2139-2149. https://doi.org/10.1242/dev.079970 |
||||
| 20 Hidai H, Bardales R, Goodwin R, Quertermous T, Quertermous EE: Cloning of capsulin, a basic helix-loop-helix factor expressed in progenitor cells of the pericardium and the coronary arteries. Mech Dev 1998;73:33-43. https://doi.org/10.1016/S0925-4773(98)00031-8 |
||||
| 21 Lu J, Richardson JA, Olson EN: Capsulin: a novel bHLH transcription factor expressed in epicardial progenitors and mesenchyme of visceral organs. Mech Dev 1998;73:23-32. https://doi.org/10.1016/S0925-4773(98)00030-6 |
||||
| 22 Lu J, Chang P, Richardson JA, Gan L, Weiler H, Olson EN: The basic helix-loop-helix transcription factor capsulin controls spleen organogenesis. Proc Natl Acad Sci U S A 2000;97:9525-9530. https://doi.org/10.1073/pnas.97.17.9525 |
||||
| 23 Maezawa Y, Onay T, Scott RP, Keir LS, Dimke H, Li C, Eremina V, Maezawa Y, Jeansson M, Shan J, Binnie M, Lewin M, Ghosh A, Miner JH, Vainio SJ, Quaggin SE: Loss of the podocyte-expressed transcription factor Tcf21/Pod1 results in podocyte differentiation defects and FSGS. J Am Soc Nephrol 2014;25:2459-2470. https://doi.org/10.1681/ASN.2013121307 |
||||
| 24 Kabgani N, Grigoleit T, Schulte K, Sechi A, Sauer-Lehnen S, Tag C, Boor P, Kuppe C, Warsow G, Schordan S, Mostertz J, Chilukoti RK, Homuth G, Endlich N, Tacke F, Weiskirchen R, Fuellen G, Endlich K, Floege J, Smeets B, et al.: Primary cultures of glomerular parietal epithelial cells or podocytes with proven origin. PloS One 2012;7:e34907. https://doi.org/10.1371/journal.pone.0034907 |
||||
| 25 Cohen CD, Frach K, Schlöndorff D, Kretzler M: Quantitative gene expression analysis in renal biopsies: a novel protocol for a high-throughput multicenter application. Kidney Int 2002;61:133-140. https://doi.org/10.1046/j.1523-1755.2002.00113.x |
||||
| 26 Martini S, Nair V, Keller BJ, Eichinger F, Hawkins JJ, Randolph A, Böger CA, Gadegbeku CA, Fox CS, Cohen CD, Kretzler M: Integrative biology identifies shared transcriptional networks in CKD. J Am Soc Nephrol 2014;25:2559-2572. https://doi.org/10.1681/ASN.2013080906 |
||||
| 27 Cohen CD, Klingenhoff A, Boucherot A, Nitsche A, Henger A, Brunner B, Schmid H, Merkle M, Saleem MA, Koller K, Werner T, Gröne H, Nelson PJ, Kretzler M: Comparative promoter analysis allows de novo identification of specialized cell junction-associated proteins. Proc Natl Acad Sci U S A 2006;103:5682-5687. https://doi.org/10.1073/pnas.0511257103 |
||||
| 28 Tusher VG, Tibshirani R, Chu G: Significance analysis of microarrays applied to the ionizing radiation response. Proc Natl Acad Sci U S A 2001;98:5116-5121. https://doi.org/10.1073/pnas.091062498 |
||||
| 29 Pfaffl MW: A new mathematical model for relative quantification in real-time RT-PCR. Nucleic Acids Res 2001;29:e45. https://doi.org/10.1093/nar/29.9.e45 |
||||
| 30 Bouter Y, Kacprowski T, Weissmann R, Dietrich K, Borgers H, Brauß A, Sperling C, Wirths O, Albrecht M, Jensen LR, Kuss AW, Bayer TA: Deciphering the Molecular Profile of Plaques, Memory Decline and Neuron Loss in Two Mouse Models for Alzheimer's Disease by Deep Sequencing. Front Aging Neurosci 2014;6:383. https://doi.org/10.3389/fnagi.2014.00075 |
||||
| 31 Bailey TL, Boden M, Buske FA, Frith M, Grant CE, Clementi L, Ren J, Li WW, Noble WS: MEME SUITE: tools for motif discovery and searching. Nucleic Acids Res 2009;37:W202-W208. https://doi.org/10.1093/nar/gkp335 |
||||
| 32 Bailey TL: DREME: motif discovery in transcription factor ChIP-seq data. Bioinformatics 2011;27:1653-1659. https://doi.org/10.1093/bioinformatics/btr261 |
||||
| 33 Mathelier A, Zhao X, Zhang AW, Parcy F, Worsley-Hunt R, Arenillas DJ, Buchman S, Chen C, Chou A, Ienasescu H, Lim J, Shyr C, Tan G, Zhou M, Lenhard B, Sandelin A, Wasserman WW: JASPAR 2014: an extensively expanded and updated open-access database of transcription factor binding profiles. Nucleic Acids Res 2014;42:D142-D147. https://doi.org/10.1093/nar/gkt997 |
||||
| 34 Huang DW, Sherman BT, Lempicki RA: Systematic and integrative analysis of large gene lists using DAVID bioinformatics resources. Nat Proc 2009;4:44-57. https://doi.org/10.1038/nprot.2008.211 |
||||
| 35 Chen J, Bardes EE, Aronow BJ, Jegga AG: ToppGene Suite for gene list enrichment analysis and candidate gene prioritization. Nucleic Acids Res 2009;37:W305-W311. https://doi.org/10.1093/nar/gkp427 |
||||
| 36 Robinson JT, Thorvaldsdóttir H, Winckler W, Guttman M, Lander ES, Getz G, Mesirov JP: Integrative genomics viewer. Nat Biotechnol 2011;29:24-26. https://doi.org/10.1038/nbt.1754 |
||||
| 37 Ye T, Krebs AR, Choukrallah M, Keime C, Plewniak F, Davidson I, Tora L: seqMINER: an integrated ChIP-seq data interpretation platform. Nucleic Acids Res 2011;39:e35. https://doi.org/10.1093/nar/gkq1287 |
||||
| 38 Kindt F, Hammer E, Kemnitz S, Blumenthal A, Klemm P, Schlüter R, Quaggin SE, van den Brandt, Jens, Fuellen G, Völker U, Endlich K, Endlich N: A novel assay to assess the effect of pharmaceutical compounds on the differentiation of podocytes. Br J Pharmacol 2017;174:163-176. https://doi.org/10.1111/bph.13667 |
||||
| 39 Murre C, McCaw PS, Baltimore D: A new DNA binding and dimerization motif in immunoglobulin enhancer binding, daughterless, MyoD, and myc proteins. Cell 1989;56:777-783. https://doi.org/10.1016/0092-8674(89)90682-X |
||||
| 40 Lindenmeyer MT, Eichinger F, Sen K, Anders H, Edenhofer I, Mattinzoli D, Kretzler M, Rastaldi MP, Cohen CD: Systematic analysis of a novel human renal glomerulus-enriched gene expression dataset. PloS One 2010;5:e11545. https://doi.org/10.1371/journal.pone.0011545 |
||||
| 41 Woroniecka KI, Park, Ae Seo Deok, Mohtat D, Thomas DB, Pullman JM, Susztak K: Transcriptome analysis of human diabetic kidney disease. Diabetes 2011;60:2354-2369. https://doi.org/10.2337/db10-1181 |
||||
| 42 Hodgin JB, Nair V, Zhang H, Randolph A, Harris RC, Nelson RG, Weil EJ, Cavalcoli JD, Patel JM, Brosius FC, Kretzler M: Identification of cross-species shared transcriptional networks of diabetic nephropathy in human and mouse glomeruli. Diabetes 2013;62:299-308. https://doi.org/10.2337/db11-1667 |
||||
| 43 Kaverina NV, Eng DG, Schneider, Remington R. S., Pippin JW, Shankland SJ: Partial podocyte replenishment in experimental FSGS derives from nonpodocyte sources. Am J Physiol Renal Physiol 2016;310:F1397. https://doi.org/10.1152/ajprenal.00369.2015 |
||||
| 44 Kaverina NV, Eng DG, Freedman BS, Kutz JN, Chozinski TJ, Vaughan JC, Miner JH, Pippin JW, Shankland SJ: Dual lineage tracing shows that glomerular parietal epithelial cells can transdifferentiate toward the adult podocyte fate. Kidney Int 2019;96:597-611. https://doi.org/10.1016/j.kint.2019.03.014 |
||||
| 45 Kaverina NV, Eng DG, Miner JH, Pippin JW, Shankland SJ: Parietal epithelial cell differentiation to a podocyte fate in the aged mouse kidney. Aging 2020;12:17601-17624. https://doi.org/10.18632/aging.103788 |
||||
| 46 Pfisterer U, Kirkeby A, Torper O, Wood J, Nelander J, Dufour A, Björklund A, Lindvall O, Jakobsson J, Parmar M: Direct conversion of human fibroblasts to dopaminergic neurons. Proc Natl Acad Sci U S A 2011;108:10343-10348. https://doi.org/10.1073/pnas.1105135108 |
||||
| 47 Endlich N, Kliewe F, Kindt F, Schmidt K, Kotb AM, Artelt N, Lindenmeyer MT, Cohen CD, Döring F, Kuss AW, Amann K, Moeller MJ, Kabgani N, Blumenthal A, Endlich K: The transcription factor Dach1 is essential for podocyte function. J Cell Mol Med 2018;22:2656-2669. https://doi.org/10.1111/jcmm.13544 |
||||
| 48 Yang K, Hitomi M, Stacey DW: Variations in cyclin D1 levels through the cell cycle determine the proliferative fate of a cell. Cell Div 2006;1:32. https://doi.org/10.1186/1747-1028-1-32 |
||||
| 49 Burnworth B, Pippin J, Karna P, Akakura S, Krofft R, Zhang G, Hudkins K, Alpers CE, Smith K, Shankland SJ, Gelman IH, Nelson PJ: SSeCKS sequesters cyclin D1 in glomerular parietal epithelial cells and influences proliferative injury in the glomerulus. Lab Invest 2012;92:499-510. https://doi.org/10.1038/labinvest.2011.199 |
||||
| 50 Shankland SJ, Anders H, Romagnani P: Glomerular parietal epithelial cells in kidney physiology, pathology, and repair. Curr Opin Nephrol Hypertens 2013;22:302-309. https://doi.org/10.1097/MNH.0b013e32835fefd4 |
||||
| 51 Gödel M, Temerinac D, Grahammer F, Hartleben B, Kretz O, Riederer BM, Propst F, Kohl S, Huber TB: Microtubule Associated Protein 1b (MAP1B) Is a Marker of the Microtubular Cytoskeleton in Podocytes but Is Not Essential for the Function of the Kidney Filtration Barrier in Mice. PloS One 2015;10:e0140116. https://doi.org/10.1371/journal.pone.0140116 |
||||
| 52 Kobayashi N: Mechanism of the process formation; podocytes vs. neurons. Microsc Res Tech 2002;57:217-223. https://doi.org/10.1002/jemt.10077 |
||||
| 53 França MM, Ferraz-de-Souza B, Lerario AM, Fragoso, Maria Candida Barisson Villares, Lotfi, Claudimara Ferini Pacicco: POD-1/TCF21 Reduces SHP Expression, Affecting LRH-1 Regulation and Cell Cycle Balance in Adrenocortical and Hepatocarcinoma Tumor Cells. BioMed Res Int 2015;2015:841784. https://doi.org/10.1155/2015/841784 |
||||
| 54 Mulay SR, Thomasova D, Ryu M, Kulkarni OP, Migliorini A, Bruns H, Gröbmayr R, Lazzeri E, Lasagni L, Liapis H, Romagnani P, Anders H: Podocyte loss involves MDM2-driven mitotic catastrophe. J Pathol 2013;230:322-335. https://doi.org/10.1002/path.4193 |
||||
| 55 Thomasova D, Bruns HA, Kretschmer V, Ebrahim M, Romoli S, Liapis H, Kotb AM, Endlich N, Anders H: Murine Double Minute-2 Prevents p53-Overactivation-Related Cell Death (Podoptosis) of Podocytes. J Am Soc Nephrol 2015;26:1513-1523. https://doi.org/10.1681/ASN.2014040345 |
||||
| 56 Fridman JS, Lowe SW: Control of apoptosis by p53. Oncogene 2003;22:9030-9040. https://doi.org/10.1038/sj.onc.1207116 |
||||
| 57 Lane D, Levine A: p53 Research: The Past Thirty Years and the Next Thirty Years. Cold Spring Harb Perspect Biol 2010;2:a000893. https://doi.org/10.1101/cshperspect.a000893 |
||||
| 58 Chen J: The Cell-Cycle Arrest and Apoptotic Functions of p53 in Tumor Initiation and Progression. Cold Spring Harb Perspect Med 2016;6:a026104. https://doi.org/10.1101/cshperspect.a026104 |
||||
| 59 Aubrey BJ, Kelly GL, Janic A, Herold MJ, Strasser A: How does p53 induce apoptosis and how does this relate to p53-mediated tumour suppression? Cell Death Differ 2018;25:104-113. https://doi.org/10.1038/cdd.2017.169 |
||||
| 60 Sui G, El Bachir Affar, Shi Y, Brignone C, Wall NR, Yin P, Donohoe M, Luke MP, Calvo D, Grossman SR, Shi Y: Yin Yang 1 Is a Negative Regulator of p53. Cell 2004;117:859-872. https://doi.org/10.1016/j.cell.2004.06.004 |
||||
| 61 Gronroos E, Terentiev AA, Punga T, Ericsson J: YY1 inhibits the activation of the p53 tumor suppressor in response to genotoxic stress. Proc Natl Acad Sci U S A 2004;101:12165-12170. https://doi.org/10.1073/pnas.0402283101 |
||||
| 62 Santiago FS, Ishii H, Shafi S, Khurana R, Kanellakis P, Bhindi R, Ramirez MJ, Bobik A, Martin JF, Chesterman CN, Zachary IC, Khachigian LM: Yin Yang-1 Inhibits Vascular Smooth Muscle Cell Growth and Intimal Thickening by Repressing p21 WAF1/Cip1 Transcription and p21 WAF1/Cip1 -Cdk4-Cyclin D1 Assembly. Circ Res 2007;101:146-155. https://doi.org/10.1161/CIRCRESAHA.106.145235 |
||||
| 63 Liu D, Zhang J, Wu Y, Shi G, Yuan H, Lu Z, Zhu Q, Wu P, Lu C, Guo F, Chen J, Jiang K, Miao Y: YY1 suppresses proliferation and migration of pancreatic ductal adenocarcinoma by regulating the CDKN3/MdM2/P53/P21 signaling pathway. Int J Cancer 2018;142:1392-1404. https://doi.org/10.1002/ijc.31173 |
||||
| 64 Sui Y, Wu T, Li F, Wang F, Cai Y, Jin J: YY1/BCCIP Coordinately Regulates P53-Responsive Element (p53RE)-Mediated Transactivation of p21Waf1/Cip1. Int J Mol Sci 2019;20:2095. https://doi.org/10.3390/ijms20092095 |
||||
| 65 Wu S, Shi Y, Mulligan P, Gay F, Landry J, Liu H, Lu J, Qi HH, Wang W, Nickoloff JA, Wu C, Shi Y: A YY1-INO80 complex regulates genomic stability through homologous recombination-based repair. Nat Struct Mol Biol 2007;14:1165-1172. https://doi.org/10.1038/nsmb1332 |
||||
| 66 Jha A, Saha S, Ayasolla K, Vashistha H, Malhotra A, Skorecki K, Singhal PC: MiR193a Modulation and Podocyte Phenotype. Cells 2020;9:1004. https://doi.org/10.3390/cells9041004 |
||||
| 67 Gao P, Li L, Yang L, Gui D, Zhang J, Han J, Wang J, Wang N, Lu J, Chen S, Hou L, Sun H, Xie L, Zou J, Peng C, Lu Y, Peng X, Wang C, Miao J, Ozcan U, et al.: Yin Yang 1 protein ameliorates diabetic nephropathy pathology through transcriptional repression of TGFβ1. Sci Transl Med 2019:11:eaaw2050. https://doi.org/10.1126/scitranslmed.aaw2050 |
||||
| 68 Makino H, Miyamoto Y, Sawai K, Mori K, Mukoyama M, Nakao K, Yoshimasa Y, Suga S: Altered gene expression related to glomerulogenesis and podocyte structure in early diabetic nephropathy of db/db mice and its restoration by pioglitazone. Diabetes 2006;55:2747-2756. https://doi.org/10.2337/db05-1683 |
||||
| 69 Usui J, Yaguchi M, Yamazaki S, Takahashi-Kobayashi M, Kawamura T, Kaneko S, Seshan SV, Ronco P, Yamagata K: Transcription factor 21 expression in injured podocytes of glomerular diseases. Sci Rep 2020;10:11516. https://doi.org/10.1038/s41598-020-68422-3 |
||||