×
![]()
Corresponding Author: Hubert H. Kerschbaum and Nikolaus Bresgen
University of Salzburg, Department of Biosciences,
Research Group for Comparative Stress Physiology
Hellbrunnerstrasse 34, 5020 Salzburg (Austria)
E-Mail Hubert.Kerschbaum@sbg.ac.at; Nikolaus.Bresgen@sbg.ac.at
Trypan Blue – Adapting a Dye Used for Labelling Dead Cells to Visualize Pinocytosis in Viable Cells
Hubert H. Kerschbauma Burcugül Altuğ Tasaa,b Melanie Schürza Karin Oberaschera Nikolaus Bresgena
aDepartment of Biosciences, University of Salzburg, Salzburg, Austria, bCellular Therapy and Stem Cell Production Application and Research Centre, ESTEM, Eskisehir Osmangazi University, Eskisehir, Turkey
Introduction
Trypan blue labelling of a cell is seen nowadays as an indicator for a dead cell, whereas decades ago it was seen as an indicator for a viable cell actively incorporating extracellular fluid. The disagreement in the interpretation of trypan blue labelling depends on the cause of cell labelling. In cell culture experiments, trypan blue labelling is assumed to indicate dead cells, whose plasma membrane has been ruptured. Dead cells are intensely stained by trypan blue and can easily be detected by bright field illumination [1-3] or fluorescence microscopy [4], while viable cells are seemingly undyed. In previous decades, vital dyes, including trypan blue, have been administrated to living animals to visualize cells exhibiting macrophage-like properties characterized by incorporating particles and colloids present in blood and intercellular fluids. These studies lead to the concept of the “reticulo-endothelial system” or “mononuclear phagocyte system” [5]. To avoid detrimental misinterpretation of trypan blue labelling and at the same time fully benefit from the simplicity of trypan blue application in cell biological experiments, identification of distinctive causative modes of trypan blue labelling is crucial.
Endocytosis and increased membrane permeability due to activation of transporters and ion channels may contribute to dye accumulation in viable cells. Macropinocytosis is a form of clathrin-independent endocytosis where cells take up non-selectively extracellular fluid [6, 7]. Consequently, when dyes are present in the cellular environment, they are incorporated in pinosomes, which accumulate in the perinuclear area. Permeation of organic compounds through the pore of ion channels is a further pathway for environmental organic molecules to enter the cell. For example, trypan blue enters viable J744 cells through the pore-forming Bacillus cereus toxin, HlyII [8]. Further, activation of P2X2, P2X7, or TRPV1 channels in HEK293 cells is associated with a nuclear accumulation of 4,6-diamidino-2-phenylindole (DAPI) and Hoechst 33258 (Bisbenzimide) [9]. Earlier studies also demonstrated that Hoechst 33342 is a substrate for the membrane efflux transporter ABCB1 (MDR1) and breast cancer resistance protein (BCRP) [10, 11]. Multidrug resistance-associated proteins (MDR) are ATP-dependent efflux transporters [12]. Thus, vesicle-dependent and vesicle-independent pathways could cause labelling of intracellular compartments in viable cells.
Silver evokes a broad spectrum of cellular responses, including modulation of signaling cascades, like MAPK-pathways and F-actin network stability, production of pro-inflammatory cytokines, increased permeability in cerebral microvessels, and cell death [13, 14]. Silver ions either enter biological systems as silver salts or are released from silver nanoparticles [15, 16]. Thus, if silver-dependent modulation of the F-actin network is associated with ruffle formation, a hallmark of macropinocytosis [17, 18], silver ions could also promote the intracellular accumulation of trypan blue.
We observed in the present study in the microglia cell line, BV-2, that silver nitrate increased trypan blue uptake in viable cells. In these cells, silver nitrate also showed an uptake of dextran dyes, a generally accepted marker for macropinocytosis. Amiloride, an inhibitor of macropinocytosis, abolished the accumulation of trypan blue containing vesicles. BV-2 cells exposed to a hypotonic solution showed an intense trypan blue labelling. NPPB, which suppresses volume-regulated ion channels, prevented trypan blue labelling of the cytoplasm and nucleus, but did not affect trypan blue accumulation in pinosomes. These observations demonstrate that trypan blue-labelled vesicles are macropinosomes representing different stages of maturation and trypan blue-labelled cytosol could indicate a further entry pathway of the dye into the cell, like NPPB-sensitive volume-regulated ion channels.
Materials and Methods
Cell Culture
The immortalized microglial cell line, BV-2 (Interlab Cell Line Collection; ATL03001) was maintained in RPMI-1640 (Biochrom / Germany) with 10% FBS (Invitrogen) at 37°C with 5 % CO2 in a 95% humidified atmosphere [19].
Evaluation and quantification of distinct cell phenotypes
DAPI- and trypan blue-labelled cells were microscopically evaluated according to the phenotype of the nucleus and the intracellular distribution of trypan blue using a conventional fluorescence microscope (Leitz Aristoplan) [4]. A cell was identified as apoptotic when the condensed chromatin showed a crescent-like distribution in the nucleus, as necrotic when the nucleus was pycnotic, and normal when the chromatin showed a cell type specific distribution of hetero- and euchromatin. A cell was identified as trypan blue positive when either a clear homogenous distribution or perinuclear accumulation of trypan blue was visible. In control as well as in each experiment, about 8000 cells were counted manually and each cell was attributed as normal (cell type specific chromatin distribution and trypan blue negative or perinuclear accumulation of trypan blue), necrotic (pycnotic and homogenous distribution of trypan blue) or apoptotic (crescent-like distribution of condensed chromatin; trypan blue negative). Statistical evaluation was performed as described in “Statistics”.
Trypan blue and dextran -conjugated dyes uptake and induction of cell death
For cell death and pinocytosis experiments, BV-2 cells were platted onto poly-D-lysine (0.01%) coated coverslips (12 mm) in RPMI-1640 with 10% FBS. Two days later, the cells were washed thrice in RPMI-1640 without FBS, incubated with silver nitrate (1, 3, 10 and 30 µM) at 37°C for three hours, washed three times in RPMI-1640 without FBS, and incubated with 0.004% Trypan blue for 10 min, 3 kD dextran Texas red (0.1 mg / ml) for 30 minutes or dextran FITC (0.1 mg / ml) for 30 minutes. Following several rinses in PBS buffer, cells were fixed in 4% paraformaldehyde for 20 minutes and chromatin was stained using DAPI (Sigma-Aldrich) (0.2µg/ml PBS). For quantitative evaluation of trypan blue labelling and DAPI staining, three experiments (three dishes per experiment) were performed on different days. Pinocytosis was determined by the presence of trypan blue or dextran red labelled vesicles.
Volume-dependent accumulation of trypan blue
Cell volume-dependent accumulation of trypan blue was tested using a hypotonic solution. Cells were incubated either in an isotonic solution (100 mM NaCl, 2.5 mM CaCl2, 2.5 mM MgCl2, 10 mM HEPES free acid, 95 mM Mannitol; 300 mOsm) or in a hypotonic solution (100 mM NaCl, 2.5 mM CaCl2, 2.5 mM MgCl2, 10 mM HEPES free acid; 210 mOsm) for 10 min in the presence of trypan blue (0.004%). To evaluate the impact of volume-regulated ion channels, we treated the cells with NPPB (10µM) in isotonic as well as hypotonic solution during the entire experiment. After ten minutes, cells were washed with PBS and fixed in 4% paraformaldehyde for 20 min at room temperature and mounted with glycergel. With the exception of glycergel (Agilent/Dako), all chemicals were purchased from (Sigma-Aldrich).
Fluorescence Microscopy and Confocal Laser Microscopy
For visualization of fluorescence signals, we used either a fluorescence microscope (Leitz Aristoplan) or a laser scanning confocal microscope (LSM 510 Meta; Zeiss, Germany). The fluorescence of trypan blue, dextran Texas red, and DAPI was imaged using a fluorescence microscope using a 63x or 100x oil immersion objective under the illumination of a mercury lamp and triple filter set (XF69, Omega Optical, Brattleboro, VT). Images were captured by a Nikon Coolpix P600 camera. In confocal microscopy, trypan blue was visualized by excitation of the samples with a 633 nm laser line and by collecting the emission with a long pass filter starting at 650 nm. For dextran Texas red, we used a laser line at 595 nm and an emission filter between 560 and 615 nm.
Live Cell Imaging
For live cell imaging, cells were seeded at a density of 3 to 4 x 10⁴ cells / ml onto poly-Dlysine (0.01%) coated imaging dishes (35 mm) with a glass bottom (Ibidi, Germany). Imaging of live cells was performed in RPMI-1640 without FBS in a humidified chamber with 5% CO2 at 37°C for three hours. Live cell images were taken at intervals of 45 seconds using brightfield and a 20x or 40x objective lens (Nikon, Biostation IM). Movies were analyzed using Nikon NIS Viewer.
Scanning electron microscopy
BV-2 cells were platted onto poly-D-lysine (0.01%) coated coverslips (12 mm) and maintained in RPMI-1640 with 10% FBS for two days. Then, cells were incubated with silver nitrate for three hours, fixed with 2.5% (v/v) glutaraldehyde (Agar Scientific Limited) in PBS (pH 7.4) for one hour, rinsed four times with PBS, dehydrated in a graded series of ethanol, and chemically dried with hexamethyldisilazane (HMDS, Sigma / Aldrich). After sputter coating with gold of the cells with Agar Sputter Coater, cells were evaluated using a Cambridge Stereoscan 250 scanning electron microscope (Cambridge Instruments). Cells were analyzed using an accelerating voltage of 20 kV and a working distance of 7.5 to 8.2 mm.
Statistics
Normality distribution of the data was examined by the Shapiro-Wilks test. For the evaluation of statistical significance Students two-tailed t-test for independent samples or the paired t-test was used for pairwise comparisons. ANOVA with Tukey post-hoc testing was performed for multiple comparisons. Significance of non-normally distributed data was assessed using Kruskal-Wallis H-test for multiple comparison and the one-sided Mann-Whiney-U Exact test for pairwise comparison of independent samples. The applied statistics are indicated in the figure legends. Statistical inspection was carried out using SPSS version 24.
Results
Distinctive trypan blue distribution in dead and viable cells – homogenous in dead cells and vesicular in viable cells
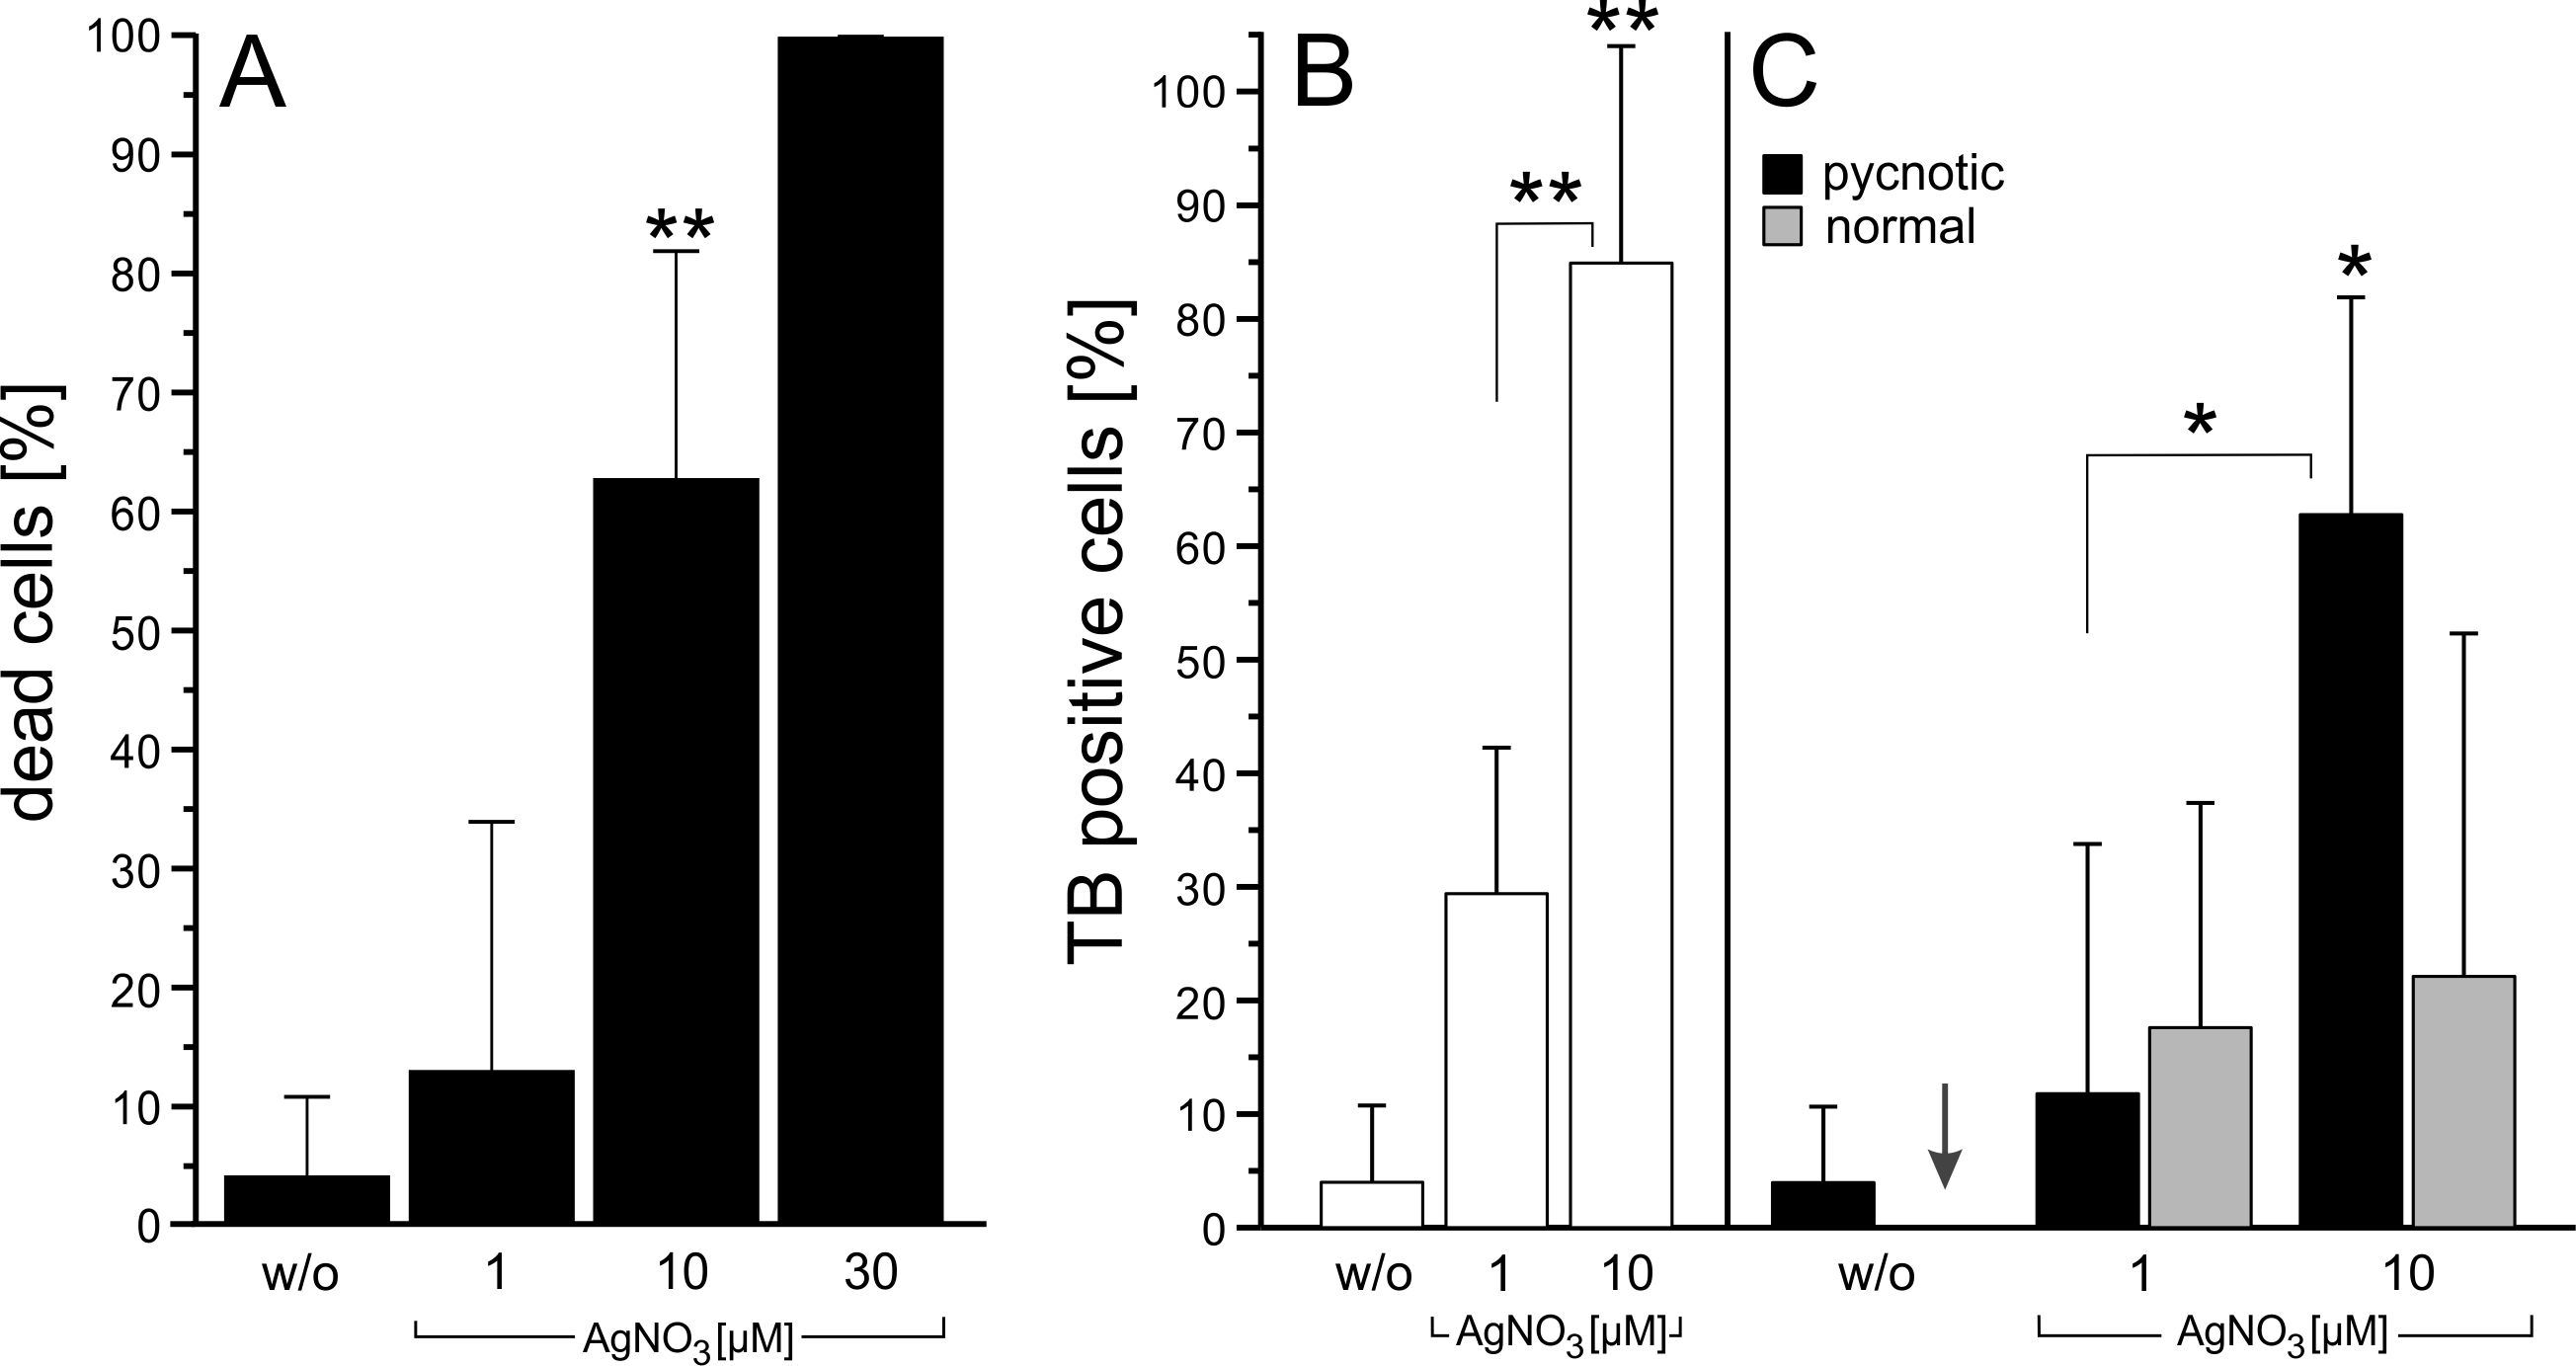
We sought to characterize the potency of trypan blue to differentiate between dead and viable cells as well as to evaluate the conditions associated with trypan blue uptake in viable cells in cell culture experiments. Since microglial cells show a constitutive pinocytosis [20], we used the microglia cell-line, BV-2, in our experiments. Exposure of BV-2 cells to silver nitrate increased concentration-dependently cell death (Fig. 1A). High concentration of silver nitrate (30 µM) caused cell swelling and rupture of the plasma membrane in virtually all cells.
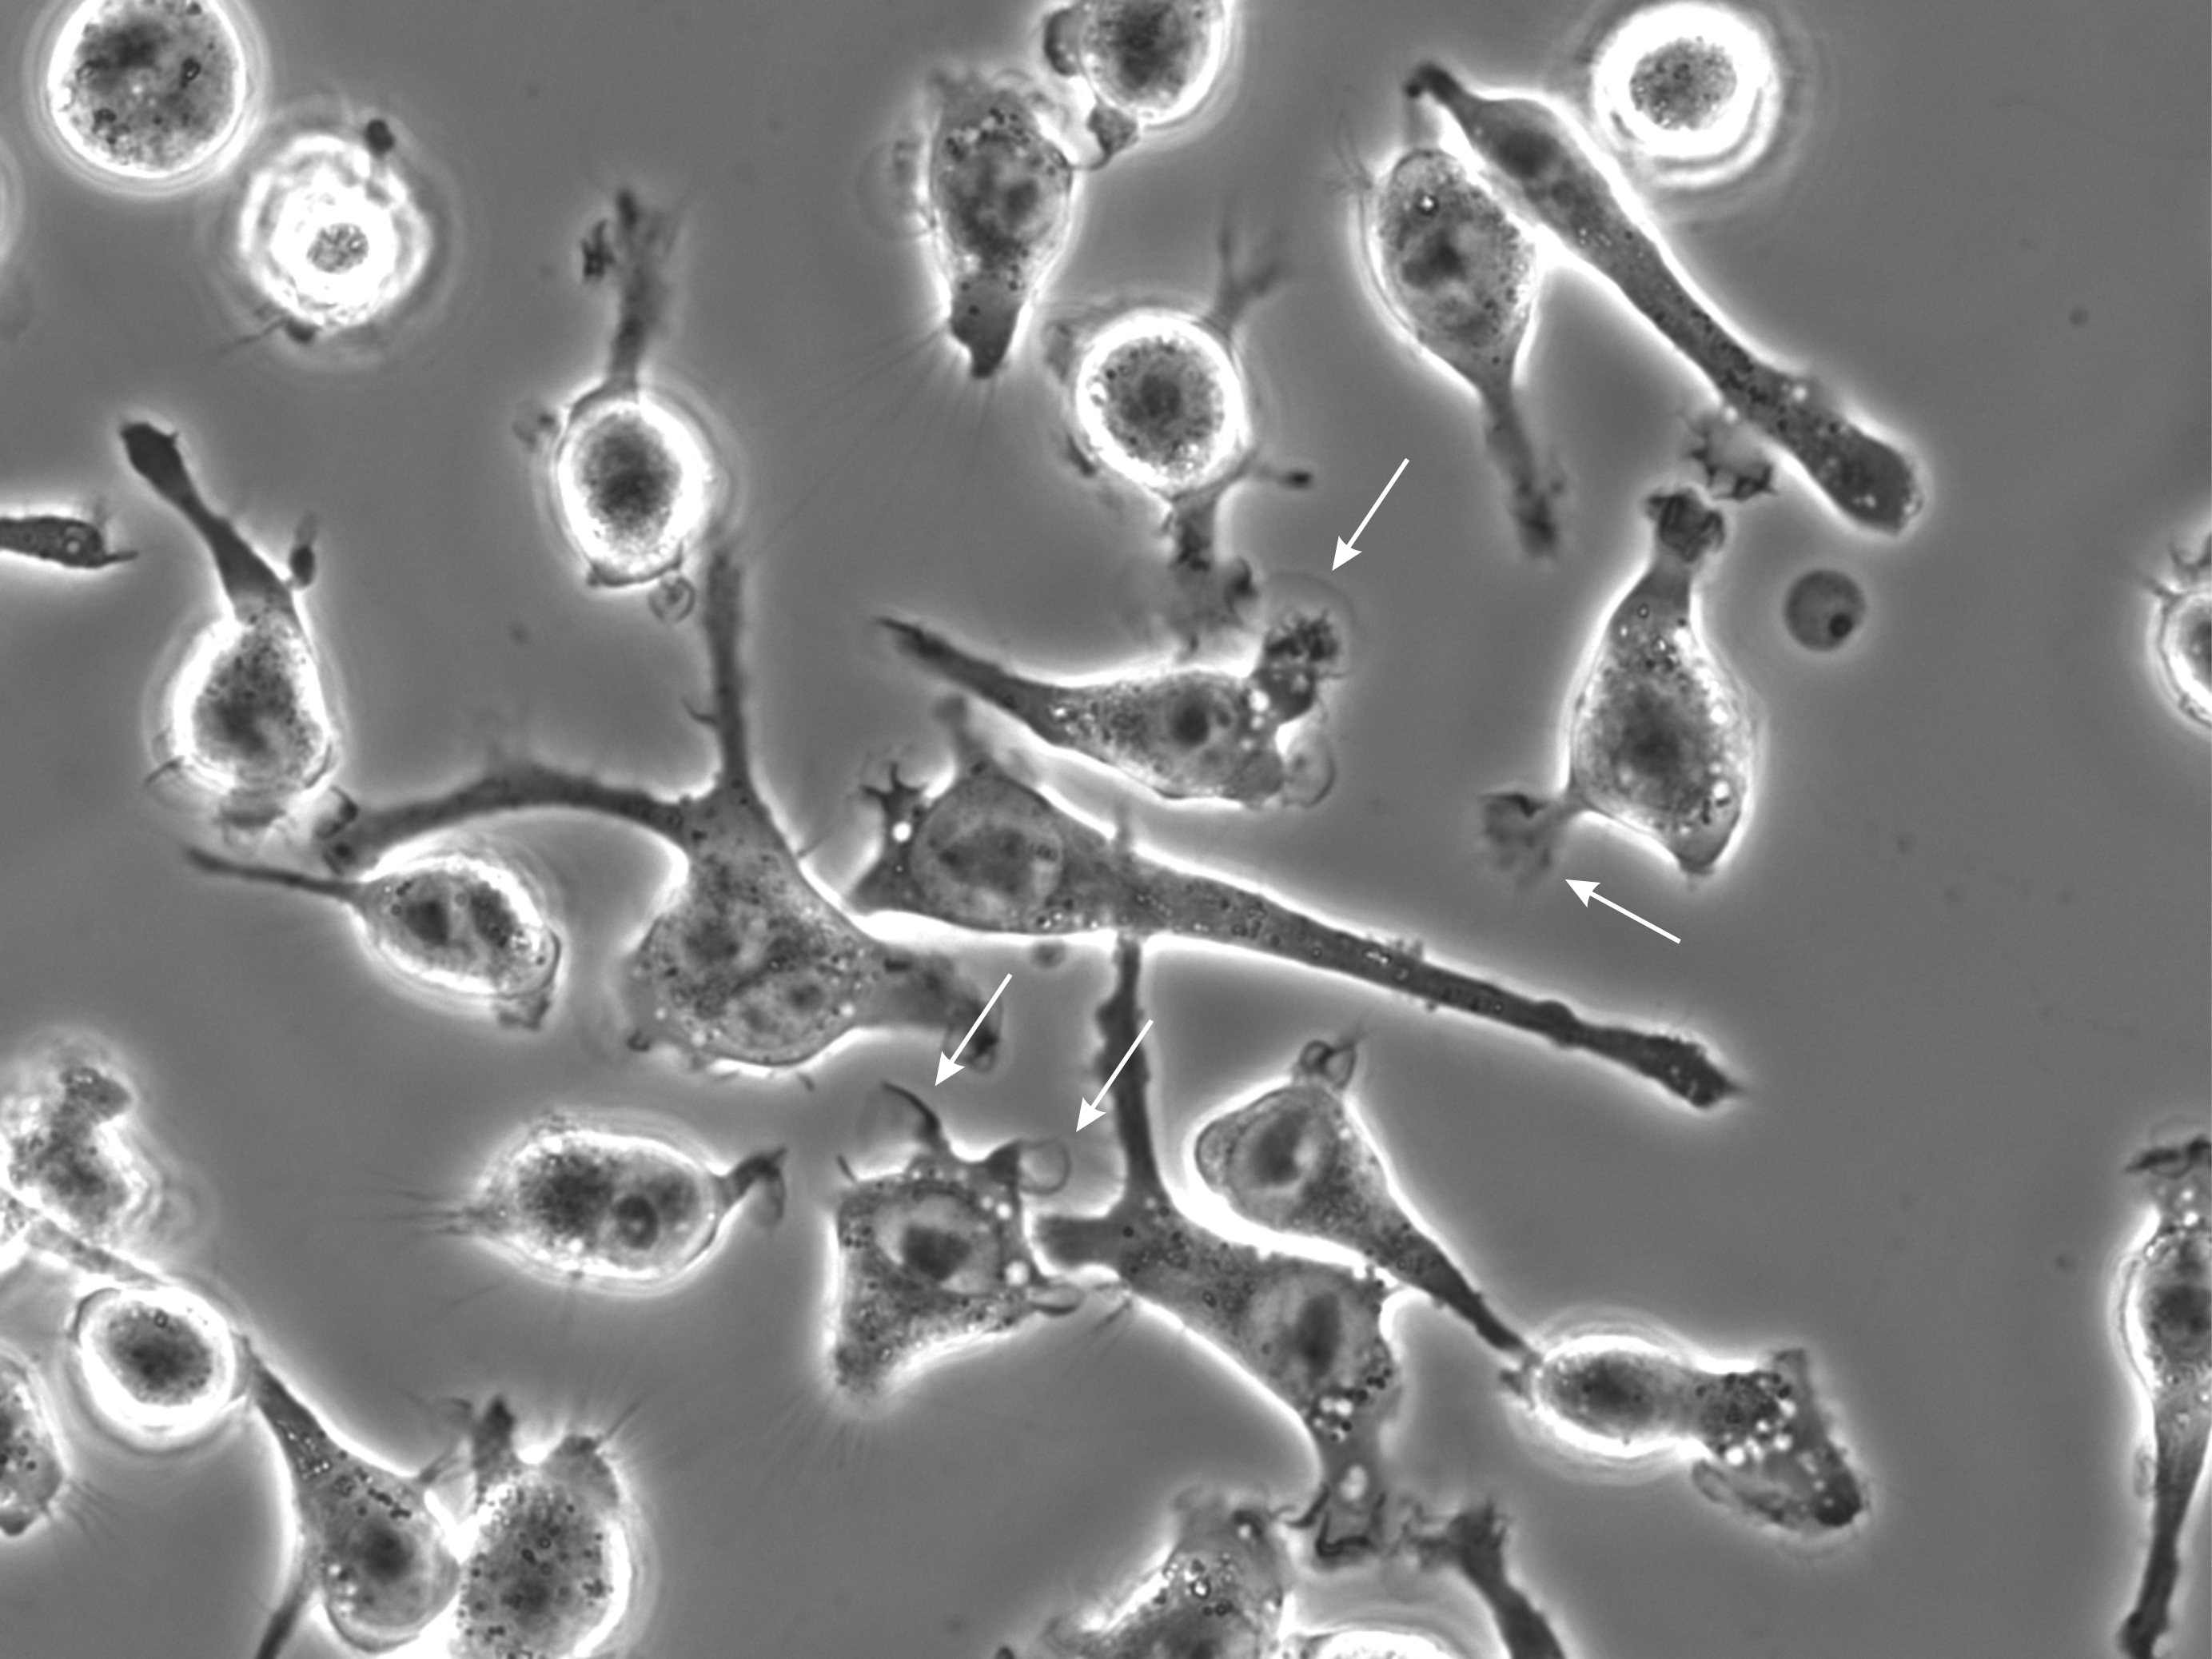
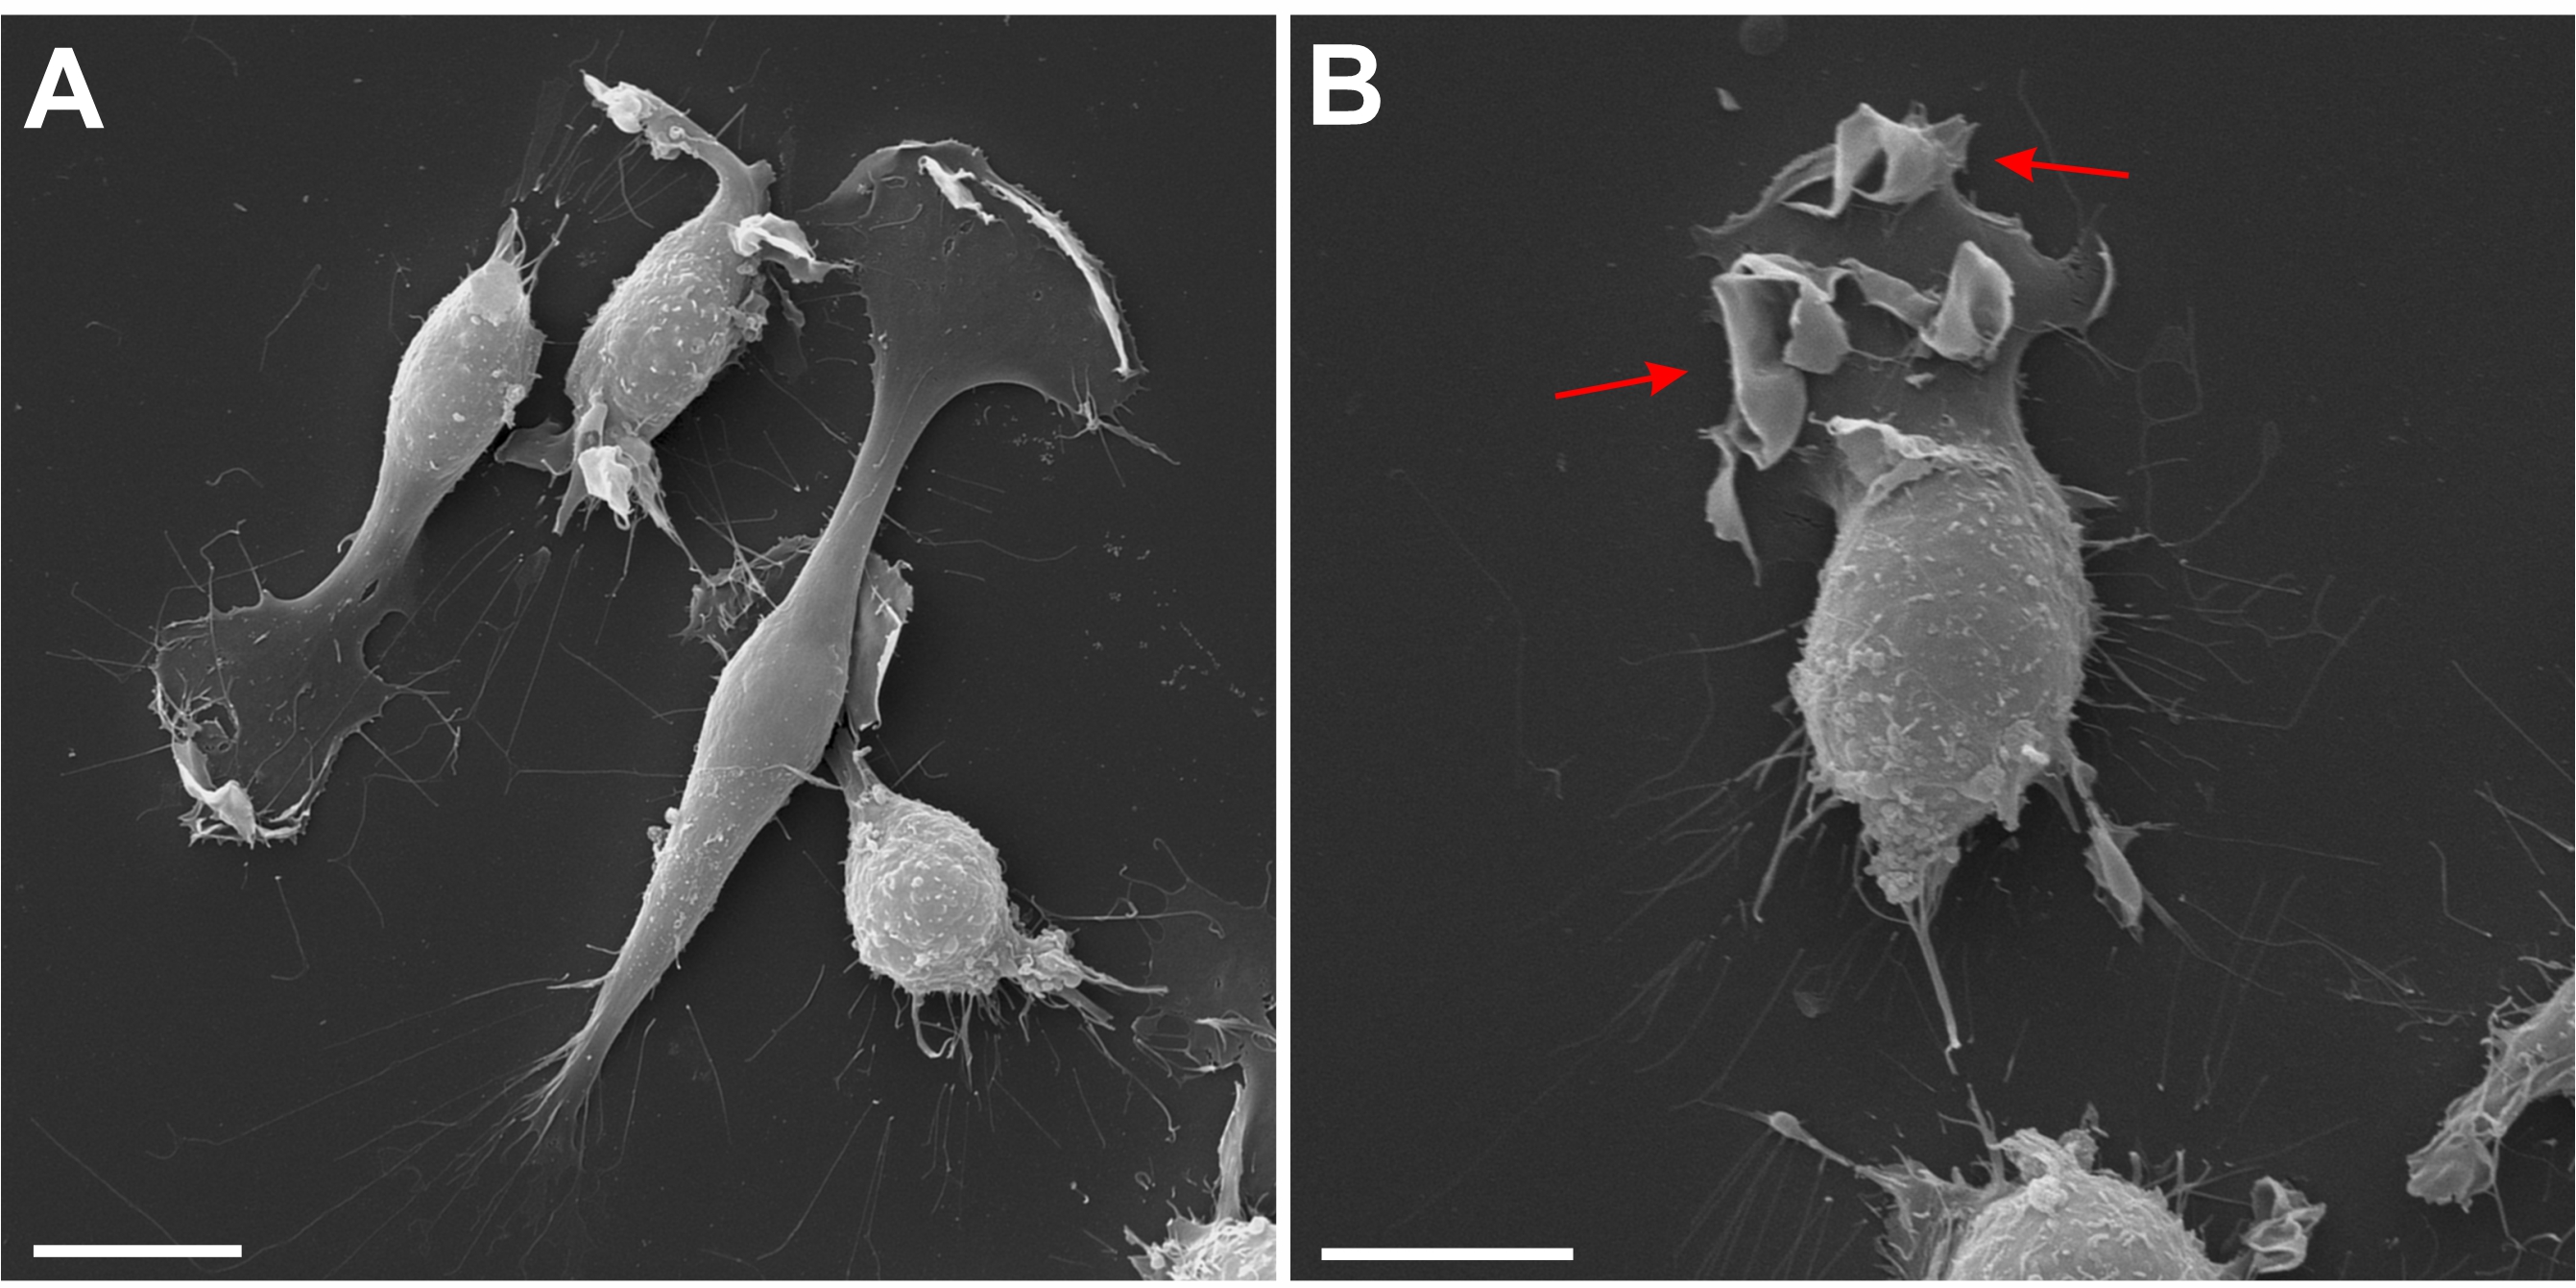
However, at lower silver nitrate concentrations trypan blue labeled dead as well as viable cells (Fig. 1B). Time-lapse movies revealed that application of silver nitrate (3 µM) caused in numerous cells the development of ruffles and cup-like structures, which closed and gave rise to centripetally trafficking pinosomes (Fig. 2; Supplementary Movie 1 – for all supplementary material see www.cellphysiolbiochem.com). Further, scanning electron microscopy revealed in silver-exposed cells prominent ruffle-formation on the lamellipodium and cell body (Fig. 3). These experiments indicated that silver nitrate further enhanced macropinocytosis in BV-2 cells, which could be used to evaluate trypan blue uptake in viable cells.
To differentiate between trypan blue-labeled dead and viable cells in more detail, we evaluated nucleus phenotypes in DAPI-stained preparations using conventional fluorescence microscopy. Consistent with previous studies [4, 21], we observed in control conditions that most viable cells were trypan blue negative (~96% of the cell population) and that necrotic cells (~4%), identified by pycnotic nuclei, were trypan blue positive. Necrotic cells showed a homogenous, bright labelling of the entire cell by the dye. Apoptotic cells (~ 0.1%), characterized by crescent-shaped chromatin condensations at the periphery of the nucleus [4], were trypan blue negative, indicating an intact plasma membrane. The number of pycnotic nuclei increased as the concentration of silver nitrate increased (Fig. 1A). At 30µM silver nitrate, almost each cell showed a pycnotic nucleus and was intensely labelled by trypan blue. At lower silver nitrate concentrations, numerous cells having a cell-type specific nucleus revealed trypan blue-labelling in vesicles (Fig. 1B, C). Compared to the homogenous staining of necrotic cells, viable cells showed a distinct accumulation of trypan-blue vesicles in the perinuclear area. Occasionally, few viable cells showed a faint background labelling in the cytoplasm and nucleus in addition to trypan blue labelled vesicles. In these experiments, only cells showing a clear trypan blue labelling were counted and quantified.
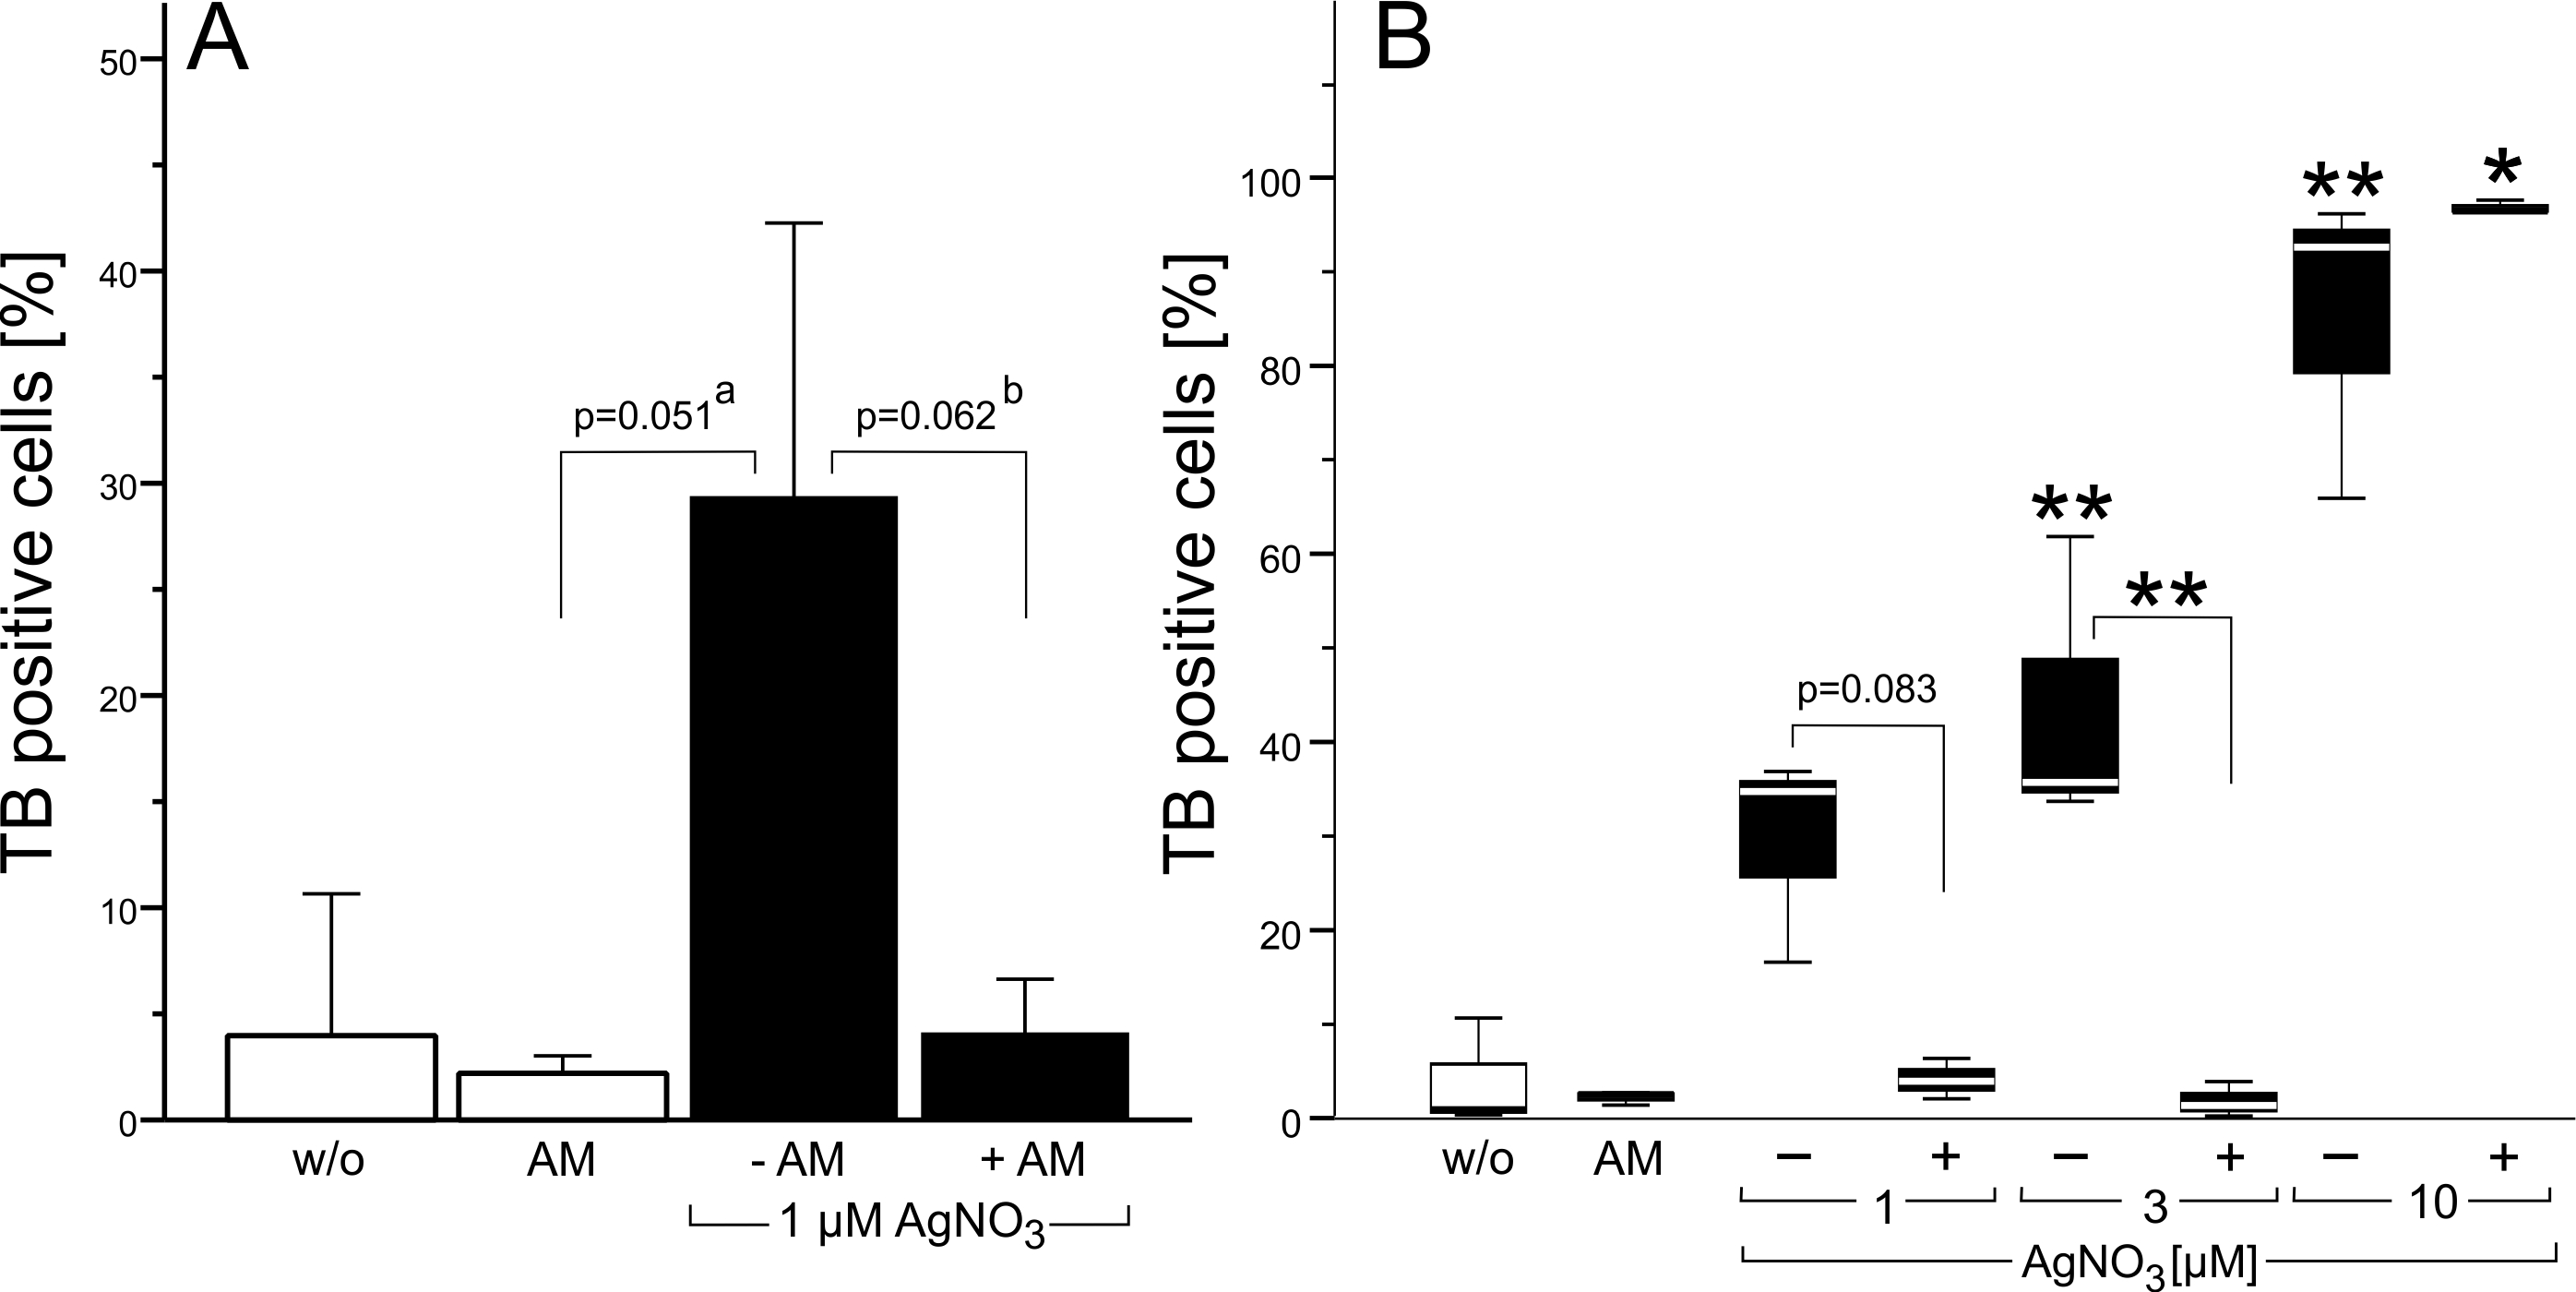
To evaluate whether macropinocytosis is required for trypan blue accumulation in vesicles, BV-2 cells were co-incubated with silver nitrate and amiloride (30 µM). The pyrazine compound, amiloride, is widely used to inhibit macropinocytosis [18, 22]. A three-hour coincubation with silver nitrate (1 or 3 µM) and amiloride (30 µM) abolished trypan blue uptake (Fig. 4A, B). In contrast, co-incubation of amiloride with 10 µM silver nitrate revealed a strong trypan blue staining in about 97% of the cells (Fig. 4B). However, in these experiments DAPI-labelled chromatin showed pycnotic nuclei, indicating that amiloride enhanced the toxicity of the silver nitrate.
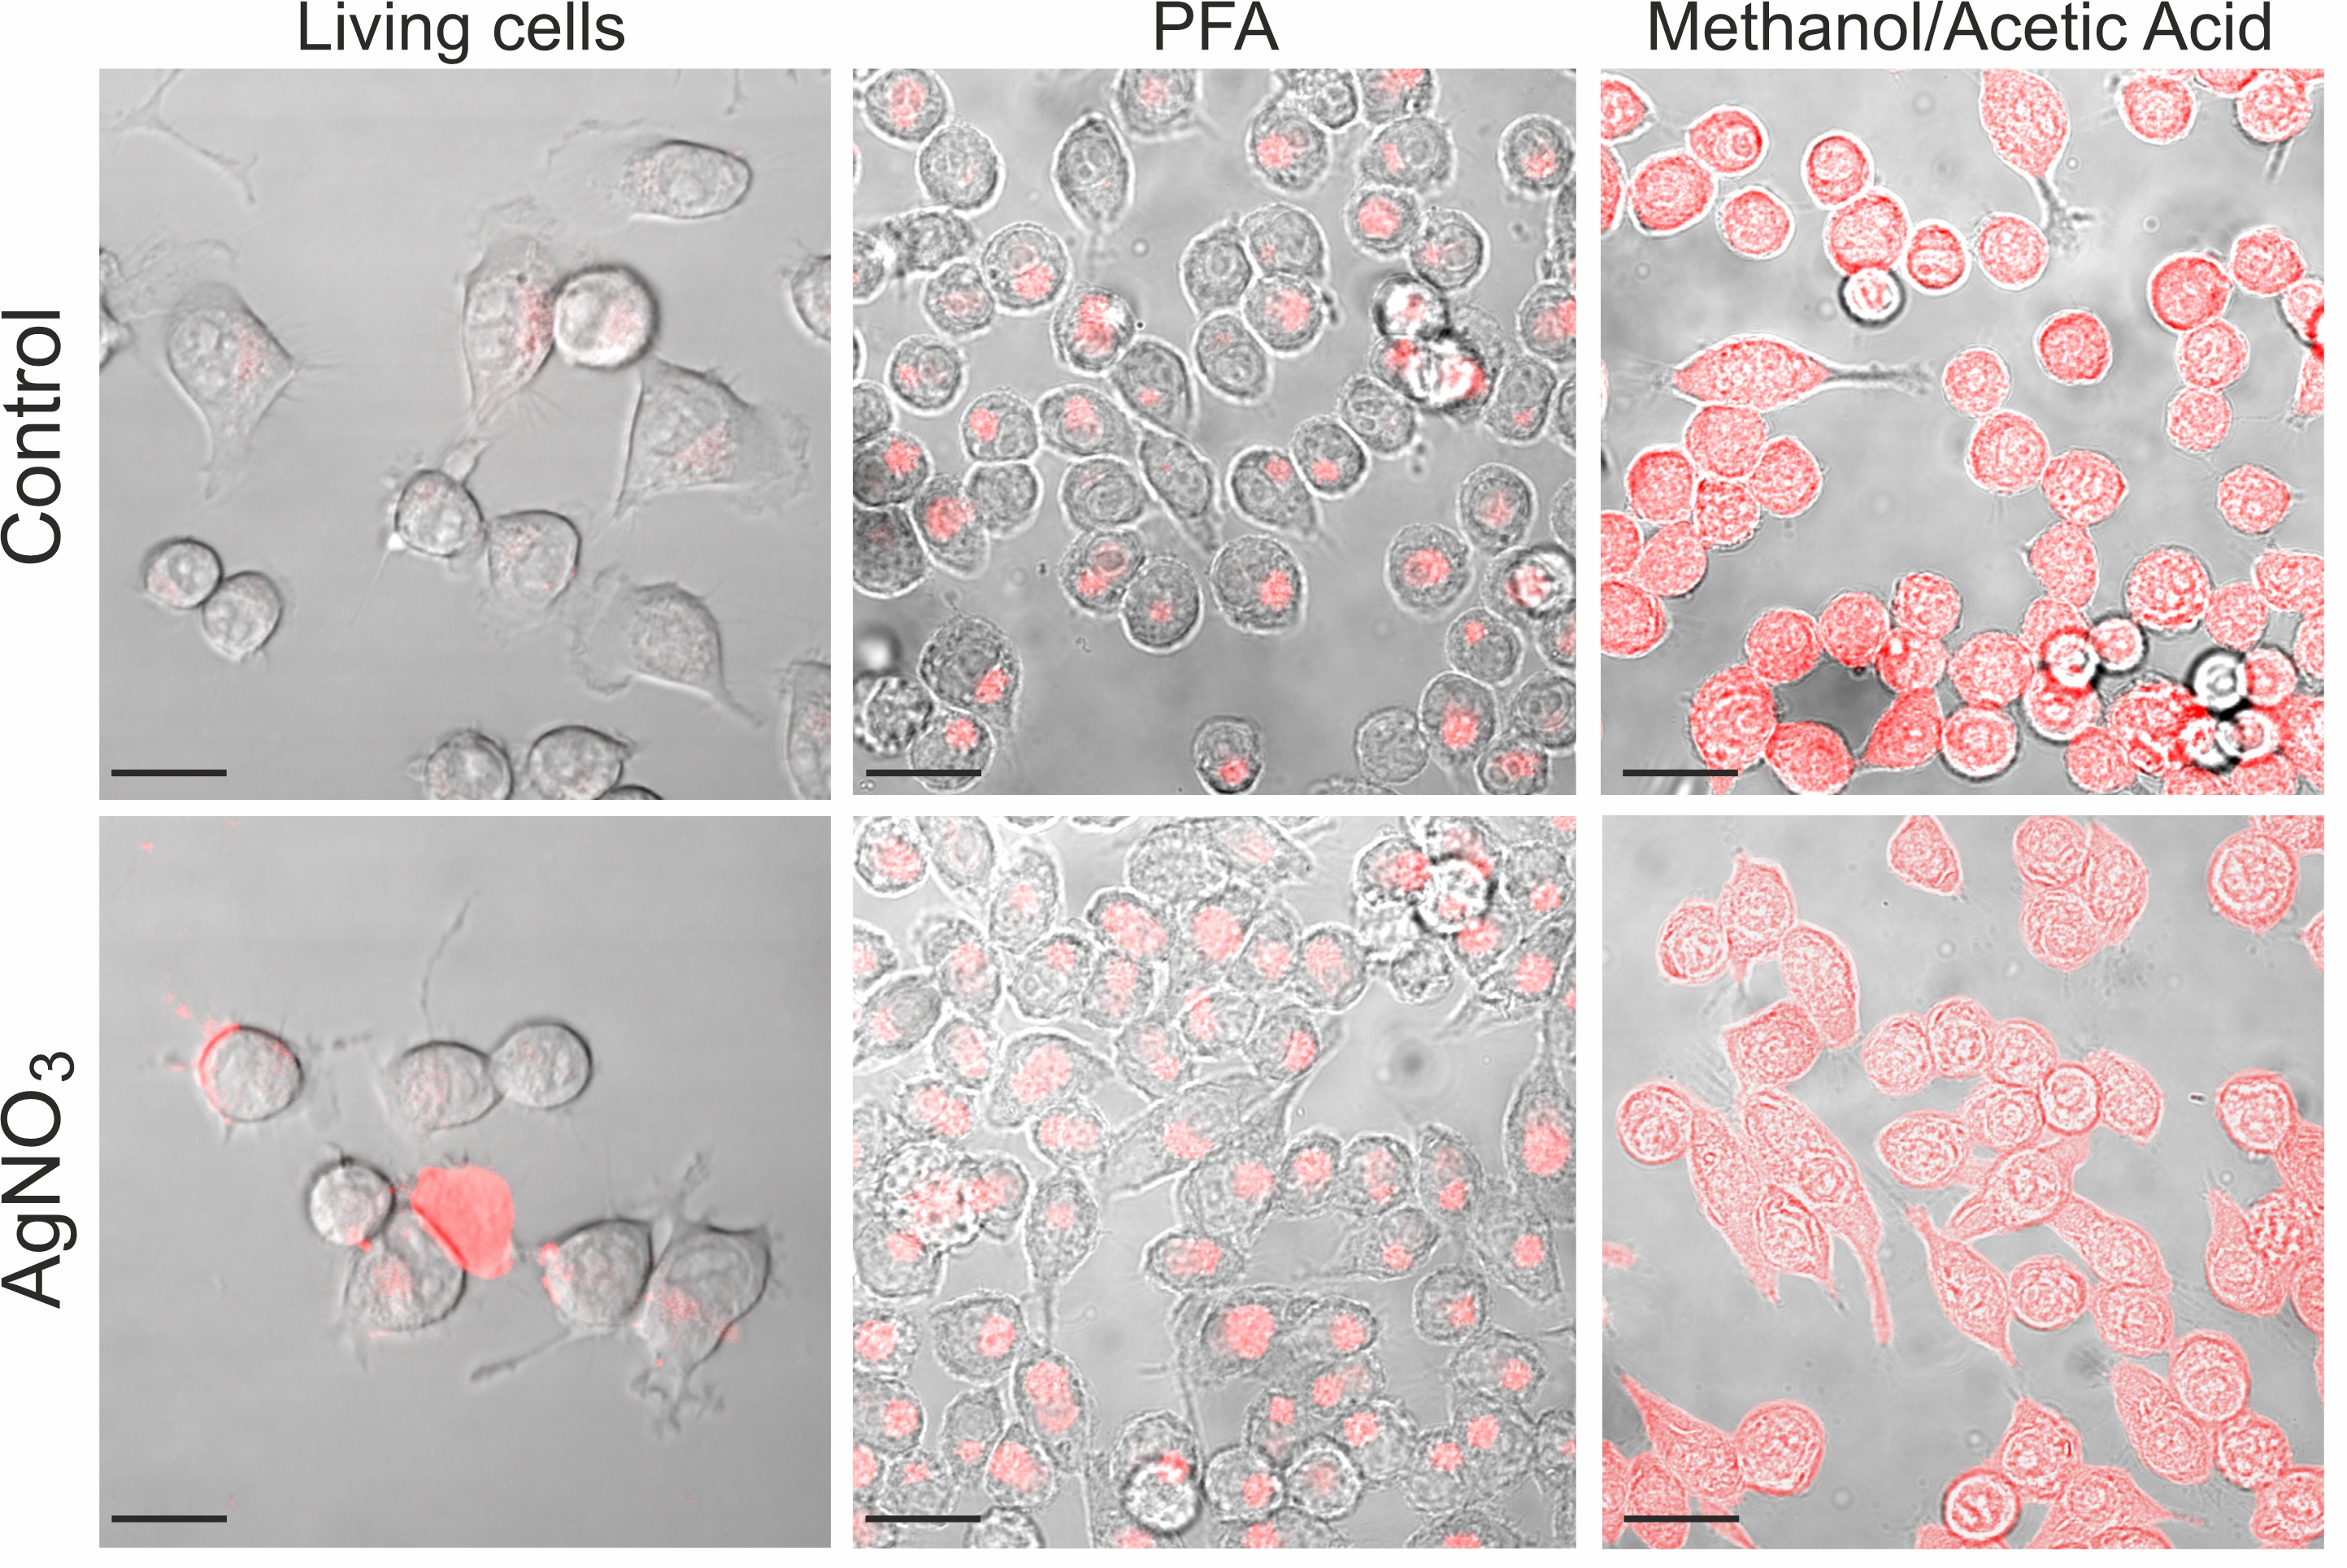
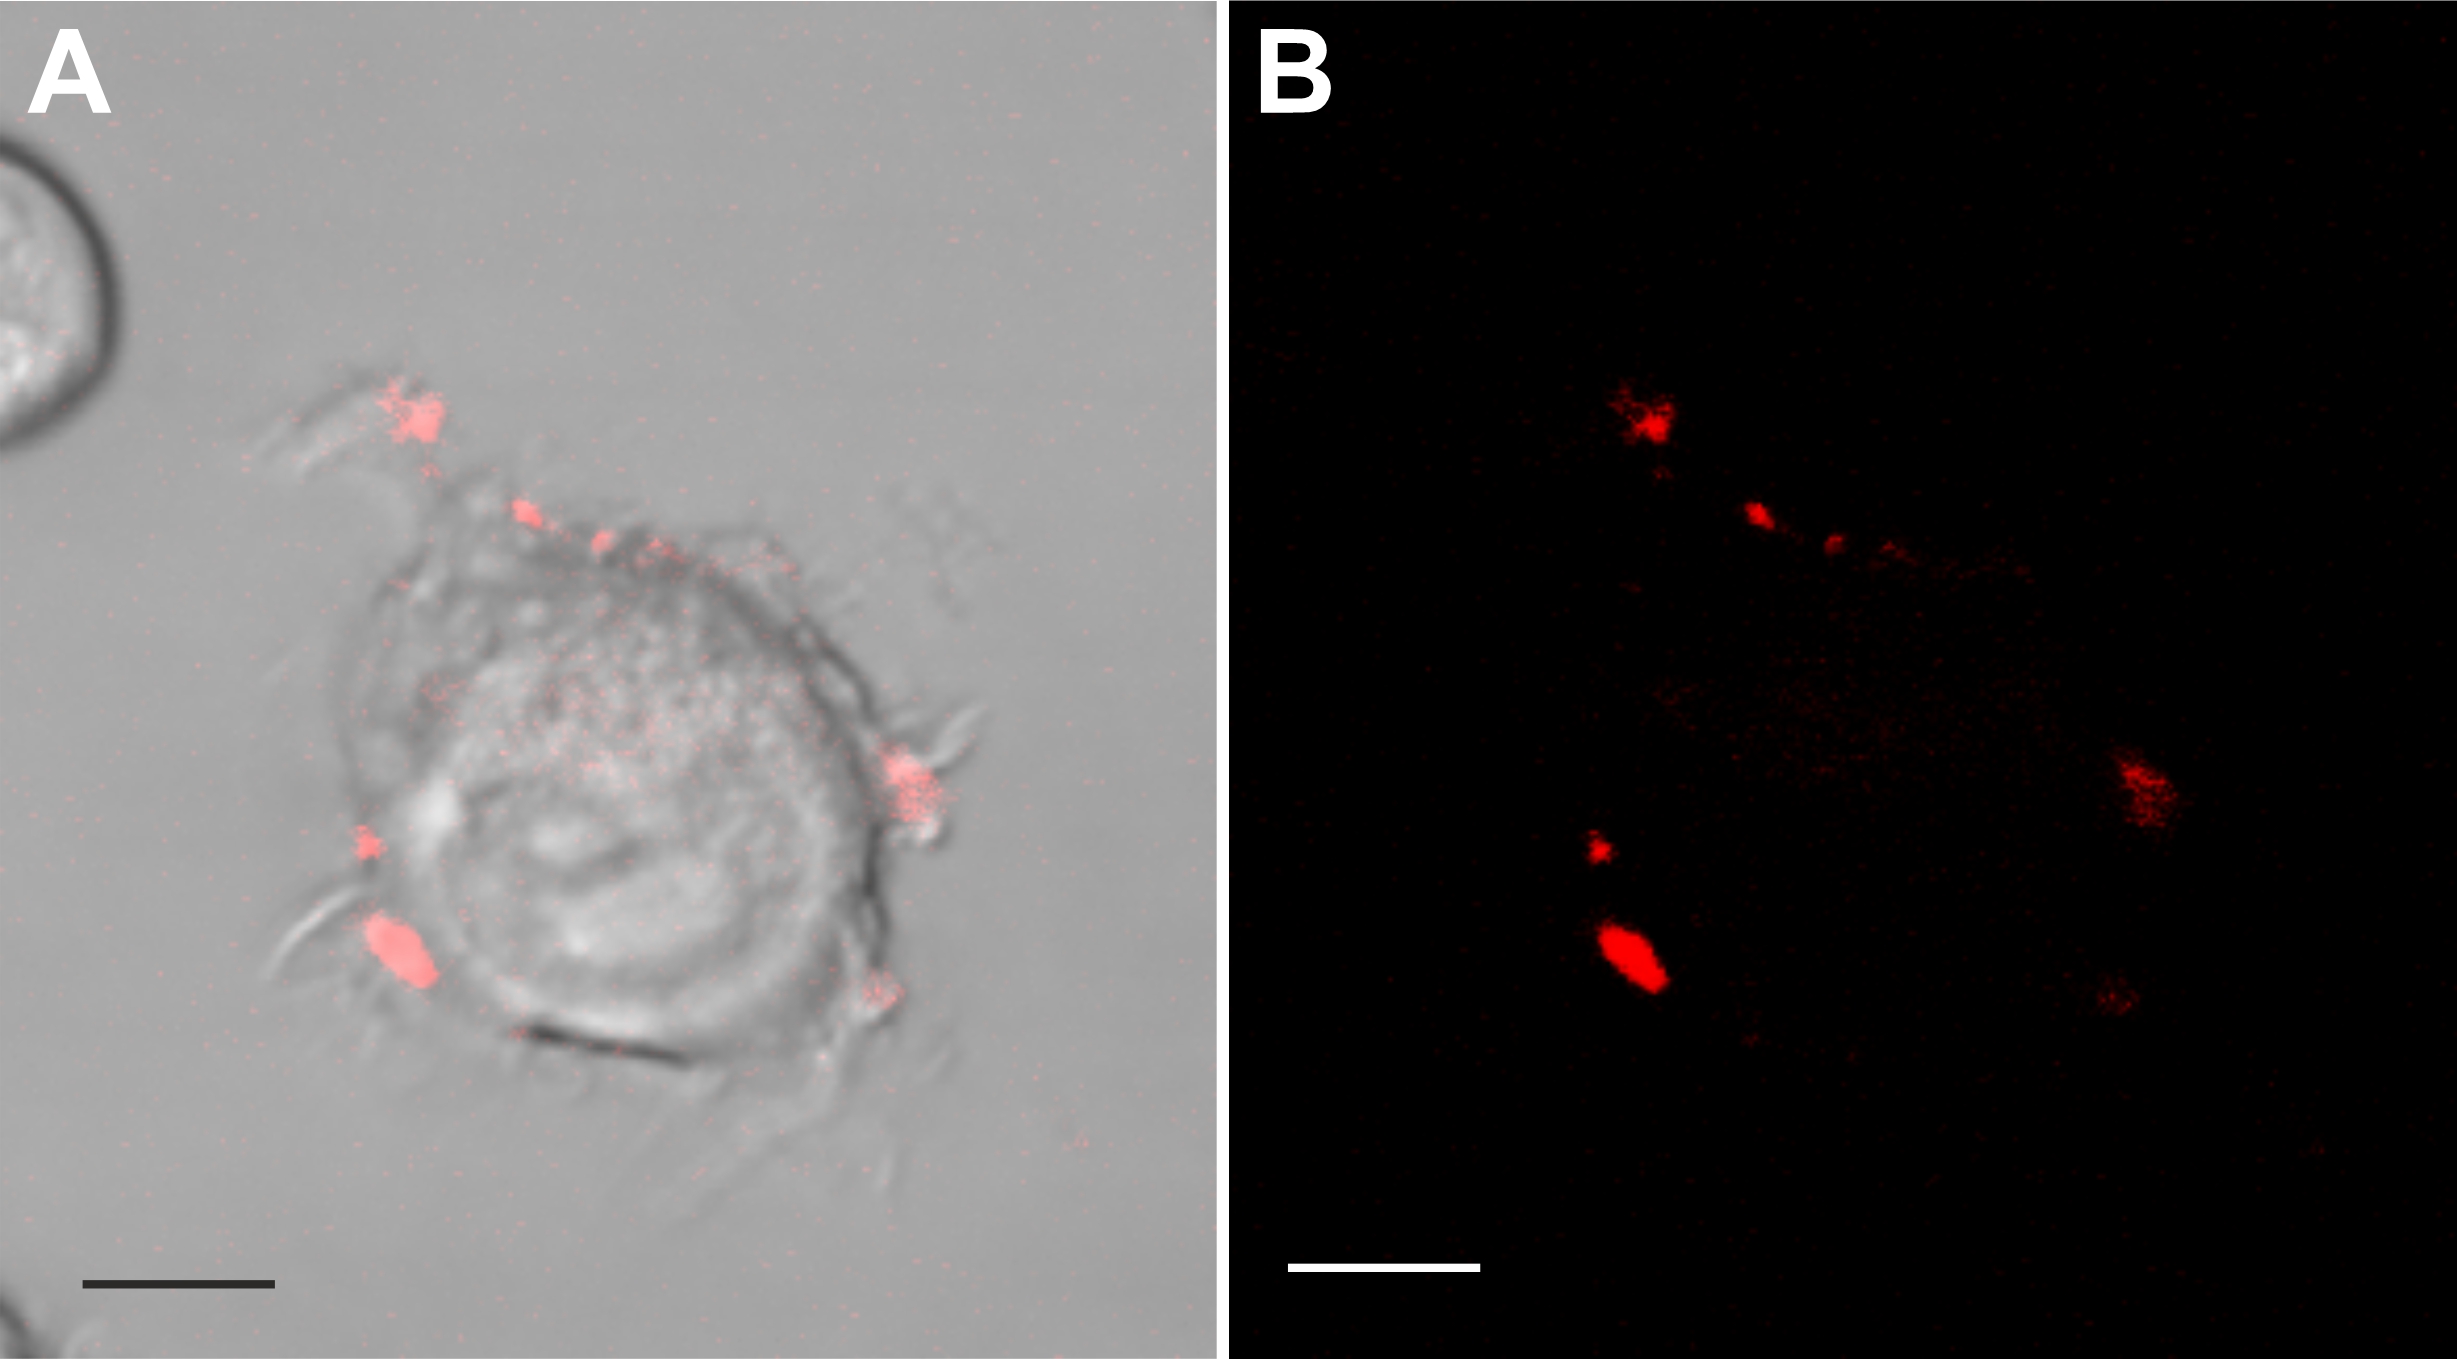
Confocal images of control and silver nitrate exposed cells revealed clear trypan blue labelling at the cell periphery and in the perinuclear area in both conditions (Fig. 5 and 6). The confocal images in Fig. 5 visualize the differences in fluorescence intensity and spatial distribution of trypan blue labelling across living, paraformaldehyde-fixed, and acetic acid methanol-fixed BV-2 cells. In viable cells, we identified numerous labeled puncta localized mostly at the cell periphery in ruffle-like structures and in the perinuclear area. Large macropinosomes did not contain fluorescent material (Fig. 5 and 6). Fig. 6 shows at a higher magnification the spatial distribution of trypan blue fluorescent puncta in a BV-2 cell. Considering that the volume of the vesicle decreases due to efflux of water, which causes an increase in the concentration of the molecules present in the vesicle [6], and that trypan blue becomes fluorescent following binding to proteins [23], these fluorescent puncta may represent protein enriched recycling tubules or vesicles and late macropinosomes and lysosomes. In control conditions, living as well as paraformaldehyde-fixed cells revealed a perinuclear accumulation of punctate trypan blue fluorescent labelling. Acetic acid methanol-fixed cells where inhomogeneous but globally labelled by trypan blue in the cytoplasm and nucleus. Paraformaldehyde causes crosslinking of proteins, whereas acetic acid methanol exposure causes denaturation of proteins and disruption of interactions between lipids in membranes, which makes cells and cell organelles more permeable. Thus, residual trypan blue, which could be still present after washing, may label precipitated cellular proteins, which become accessible due to permeabilization of membranes.
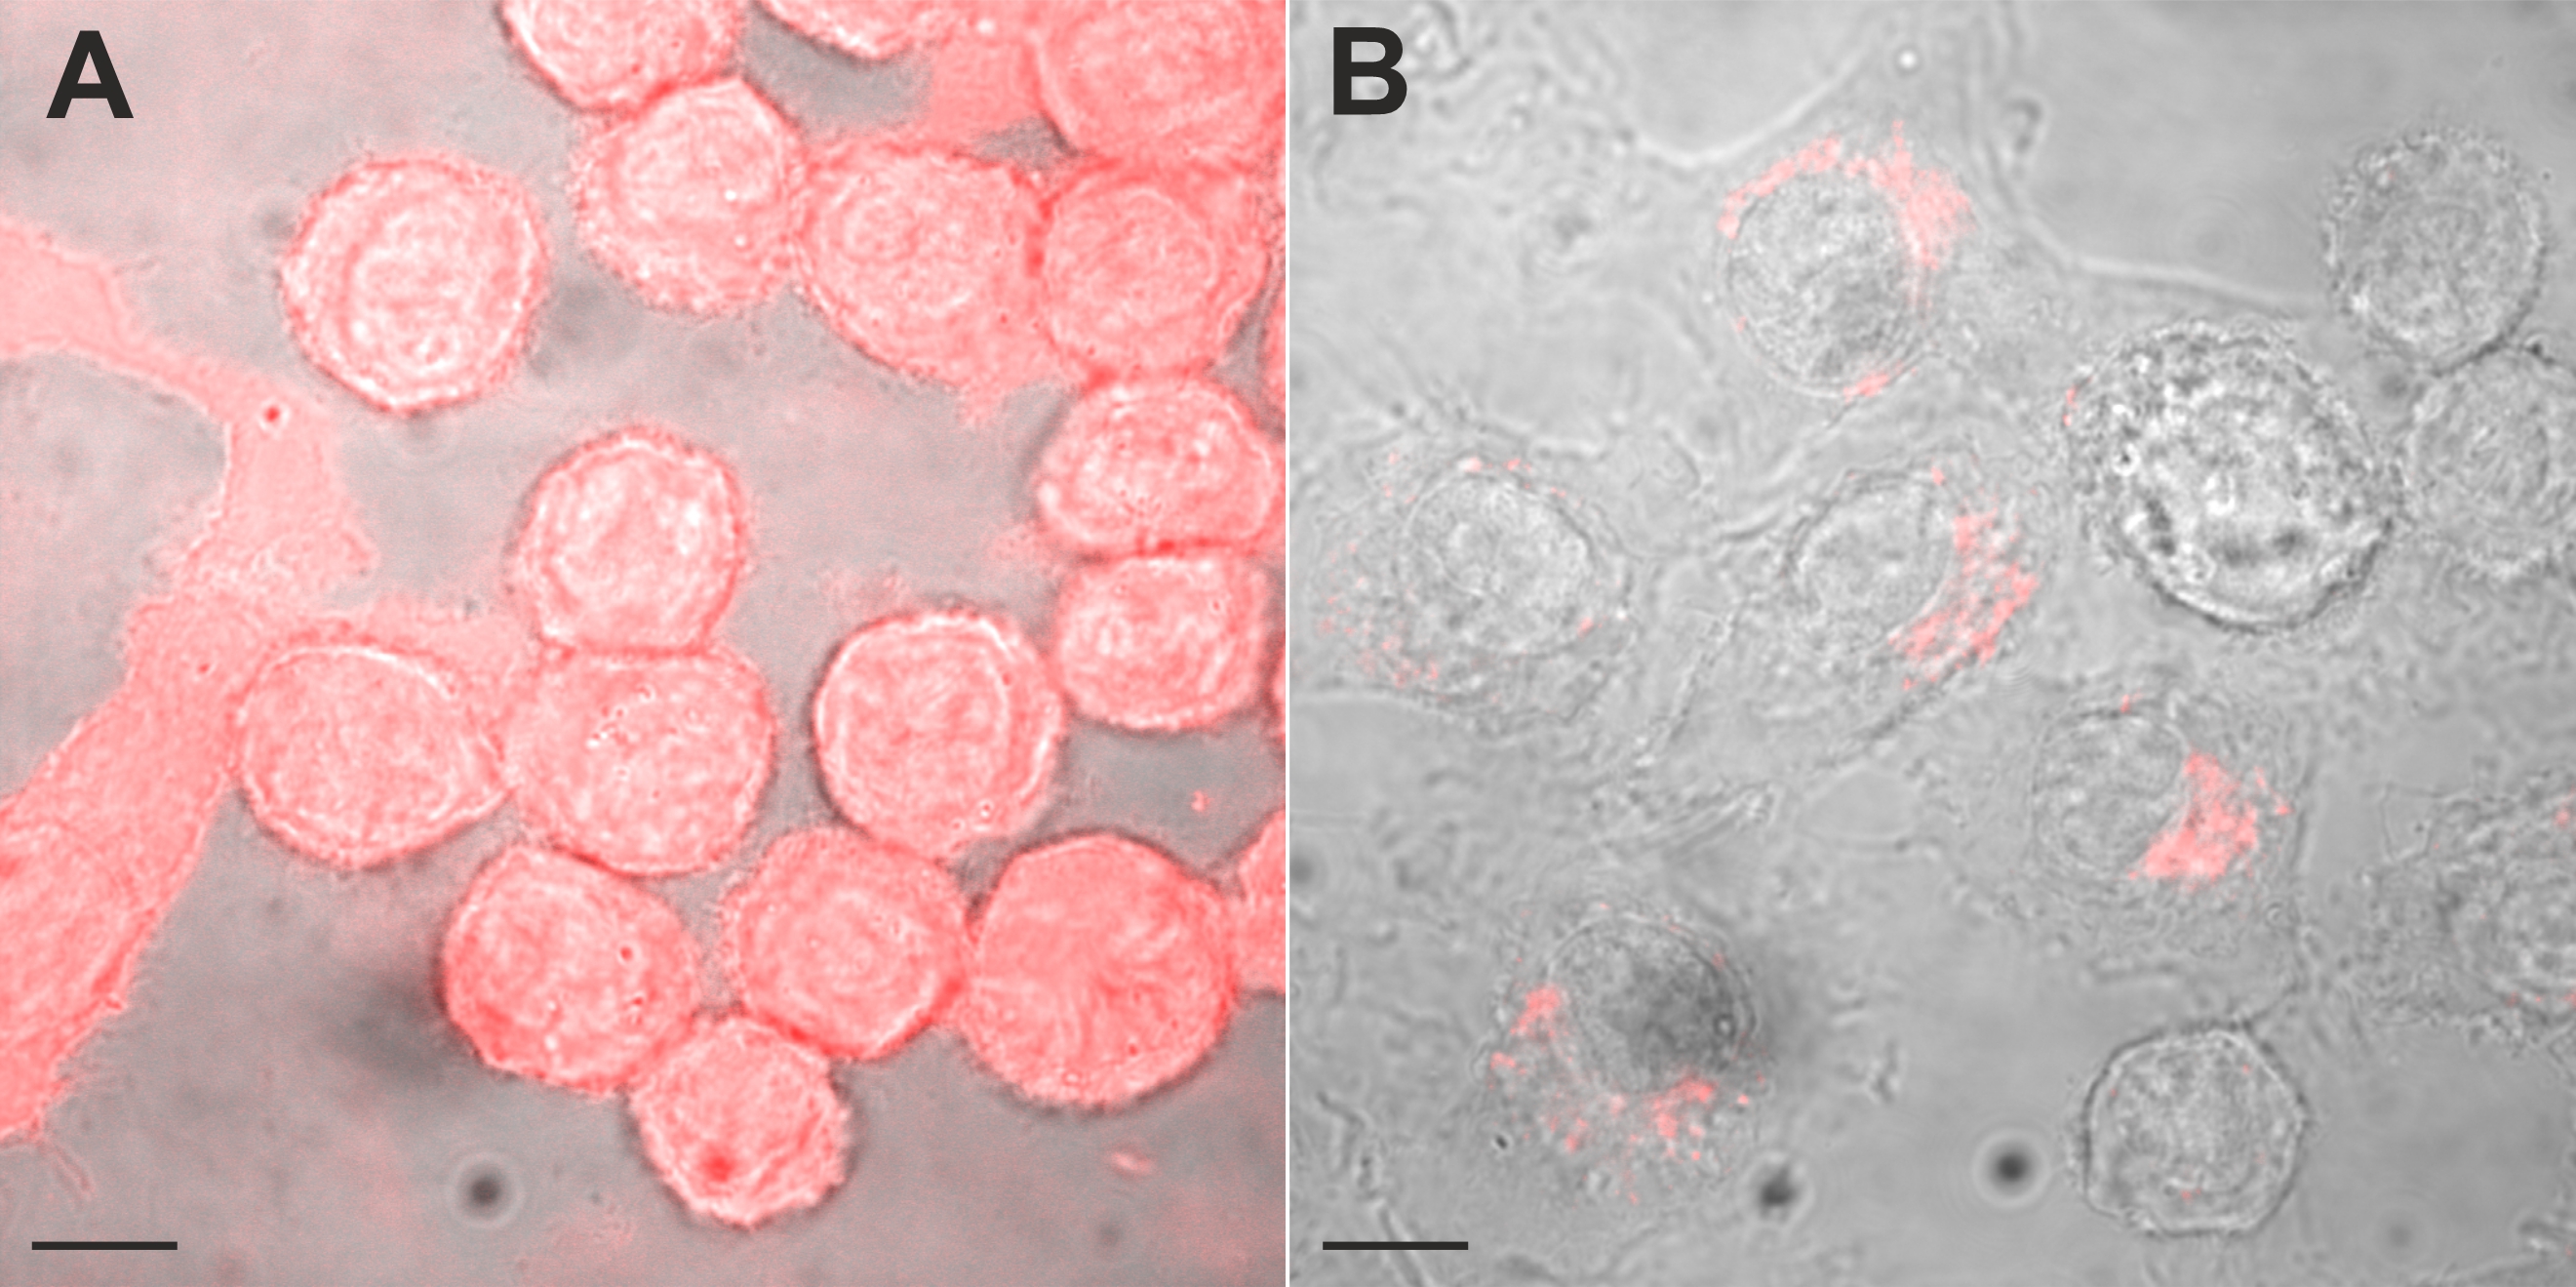
Whereas trypan blue fluorescence in vesicular compartments is in line with a pinocytotic uptake, trypan blue labelling of the cyto- and nucleoplasm suggests an additional entry pathway. Microglia cells express ion channels whose pores are large enough to accommodate small organic molecules. For example, the volume-sensitive ion channels VRAC and TRP12 (OTRPC4) are permeable to small organic compounds and both are sensitive to NPPB [24-28]. If volume-regulated ion channels promote trypan blue influx, then cell swelling increase trypan blue labelling of the cytoplasm and blockade of these ion channels suppress cytoplasmic accumulation of the azo dye. Because only few silver nitrate-treated cells showed a cytoplasmic labelling, we induced cell swelling by exposing BV-2 cell to a hypotonic solution. Replacement of the isotonic by a hypotonic solution induced an intense trypan blue labelling in each of the cells in each of the four independent experiments (Fig. 7A). When the hypotonic solution contained NPPB (10 µM), trypan blue labelling was restricted to vesicles, which were accumulated in the perinuclear area (Fig. 7B).
Comparison between trypan blue and dextran labelling
The perinuclear accumulation of trypan blue labelled vesicles resembled the distribution of dyes regularly used to evaluate pinocytosis, like dextran-conjugated dyes. Accordingly, we evaluated the distribution of Texas red conjugated dextran in control and silver nitrate exposed cells. Control cells exposed to Texas red-conjugated dextran showed either a perinuclear labelling or were free of labelling. When BV-2 cells were exposed to sliver nitrate (< 10 µM), most cells showed a perinuclear accumulation of Texas red-conjugated dextran and in about 12 % of the cells, bright dextran-labelling was identified in the entire cytoplasm. Cells showing a perinuclear distribution of Texas red conjugated dextran revealed a normal nuclear phenotype, whereas cells showing a homogenous labelling of the entire cytoplasm contained a pycnotic nucleus (Fig. 8). Thus, Texas red-conjugated dextran as well as trypan blue showed a comparable cellular labeling pattern. Necrotic cells showed a homogenous, bright labelling of the entire cell and viable cells showed a labelling of vesicles, which accumulate in the perinuclear area.
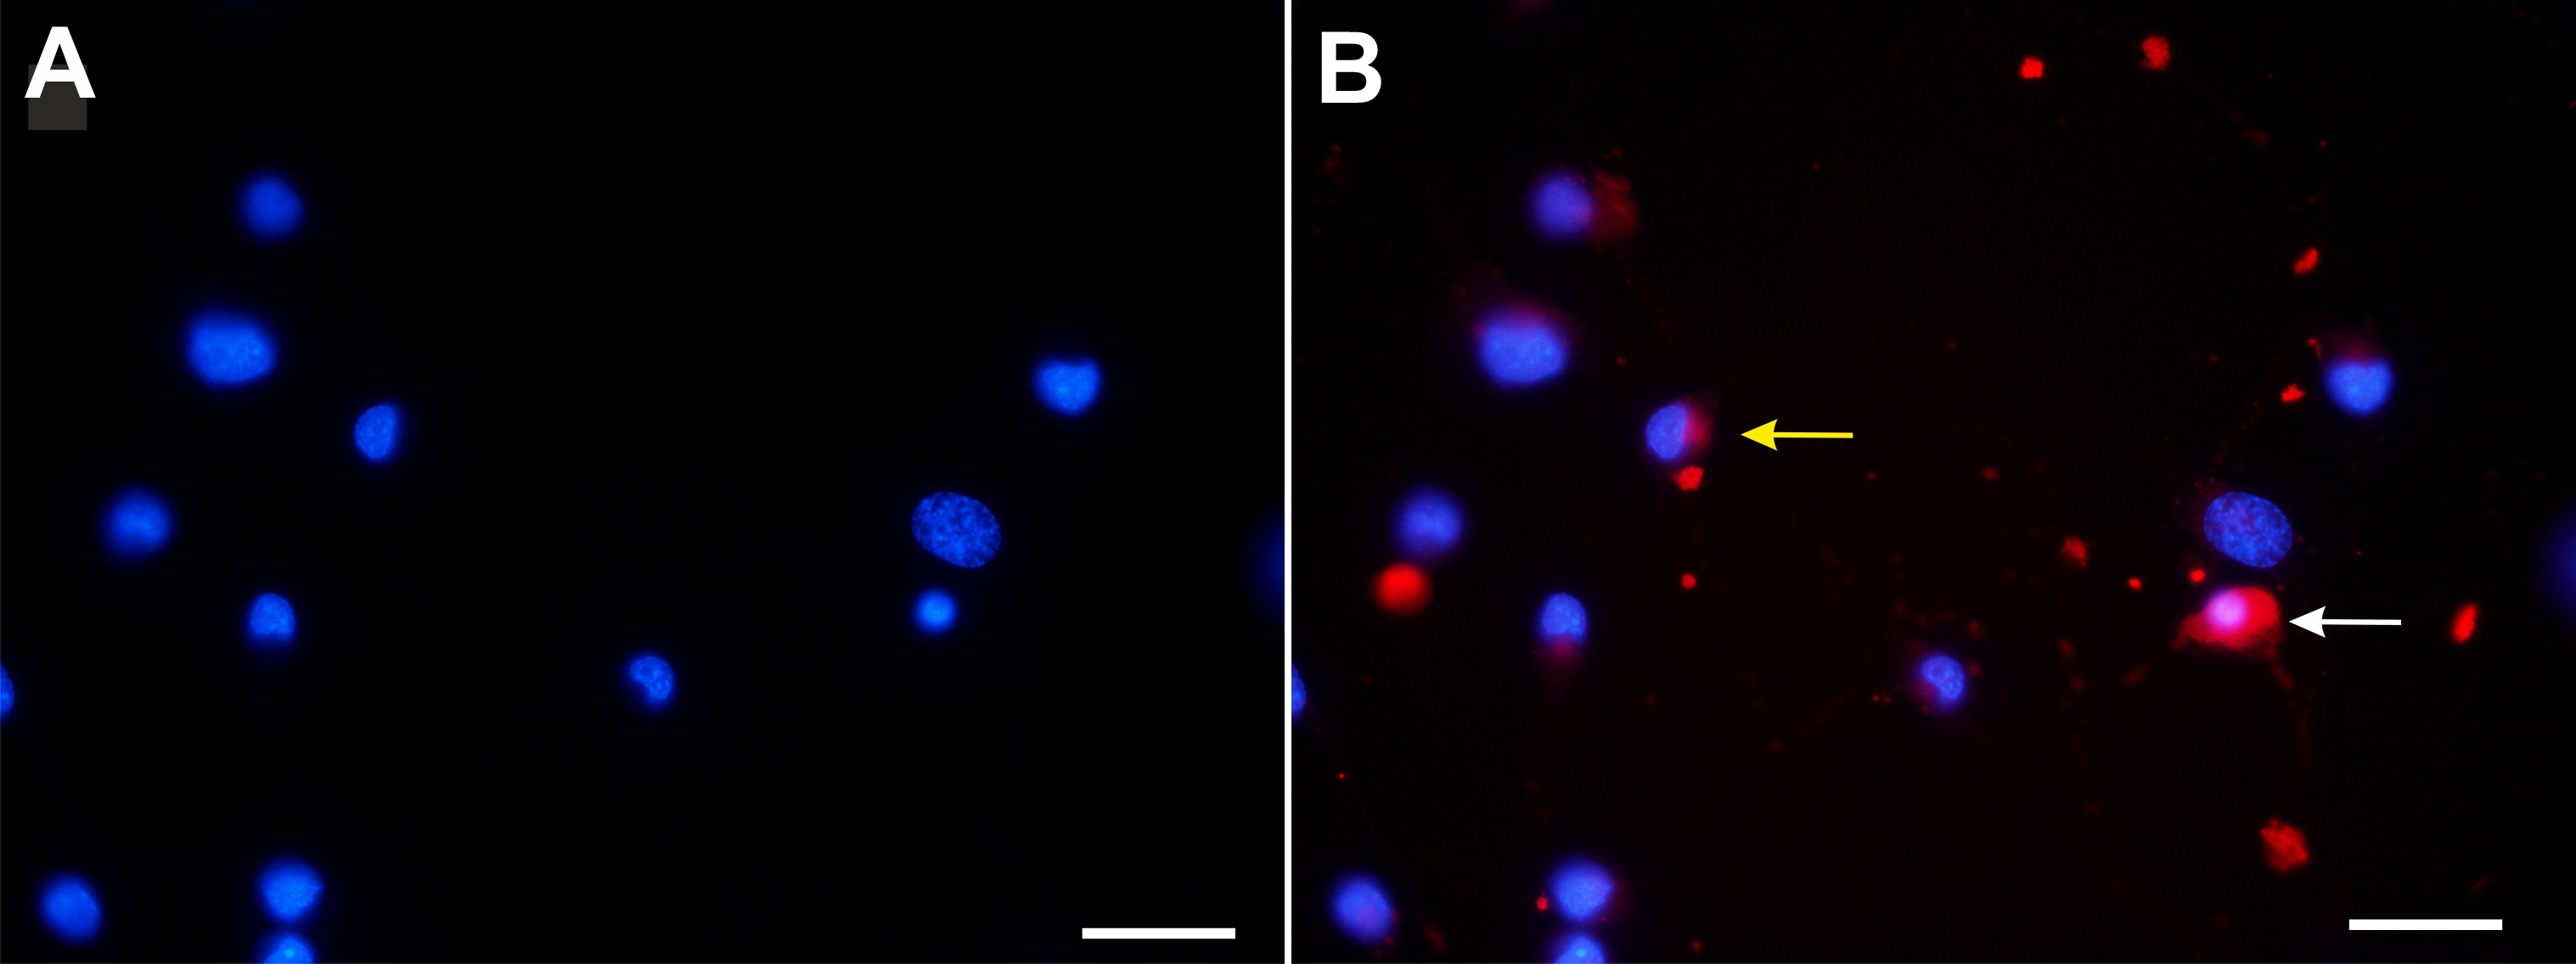
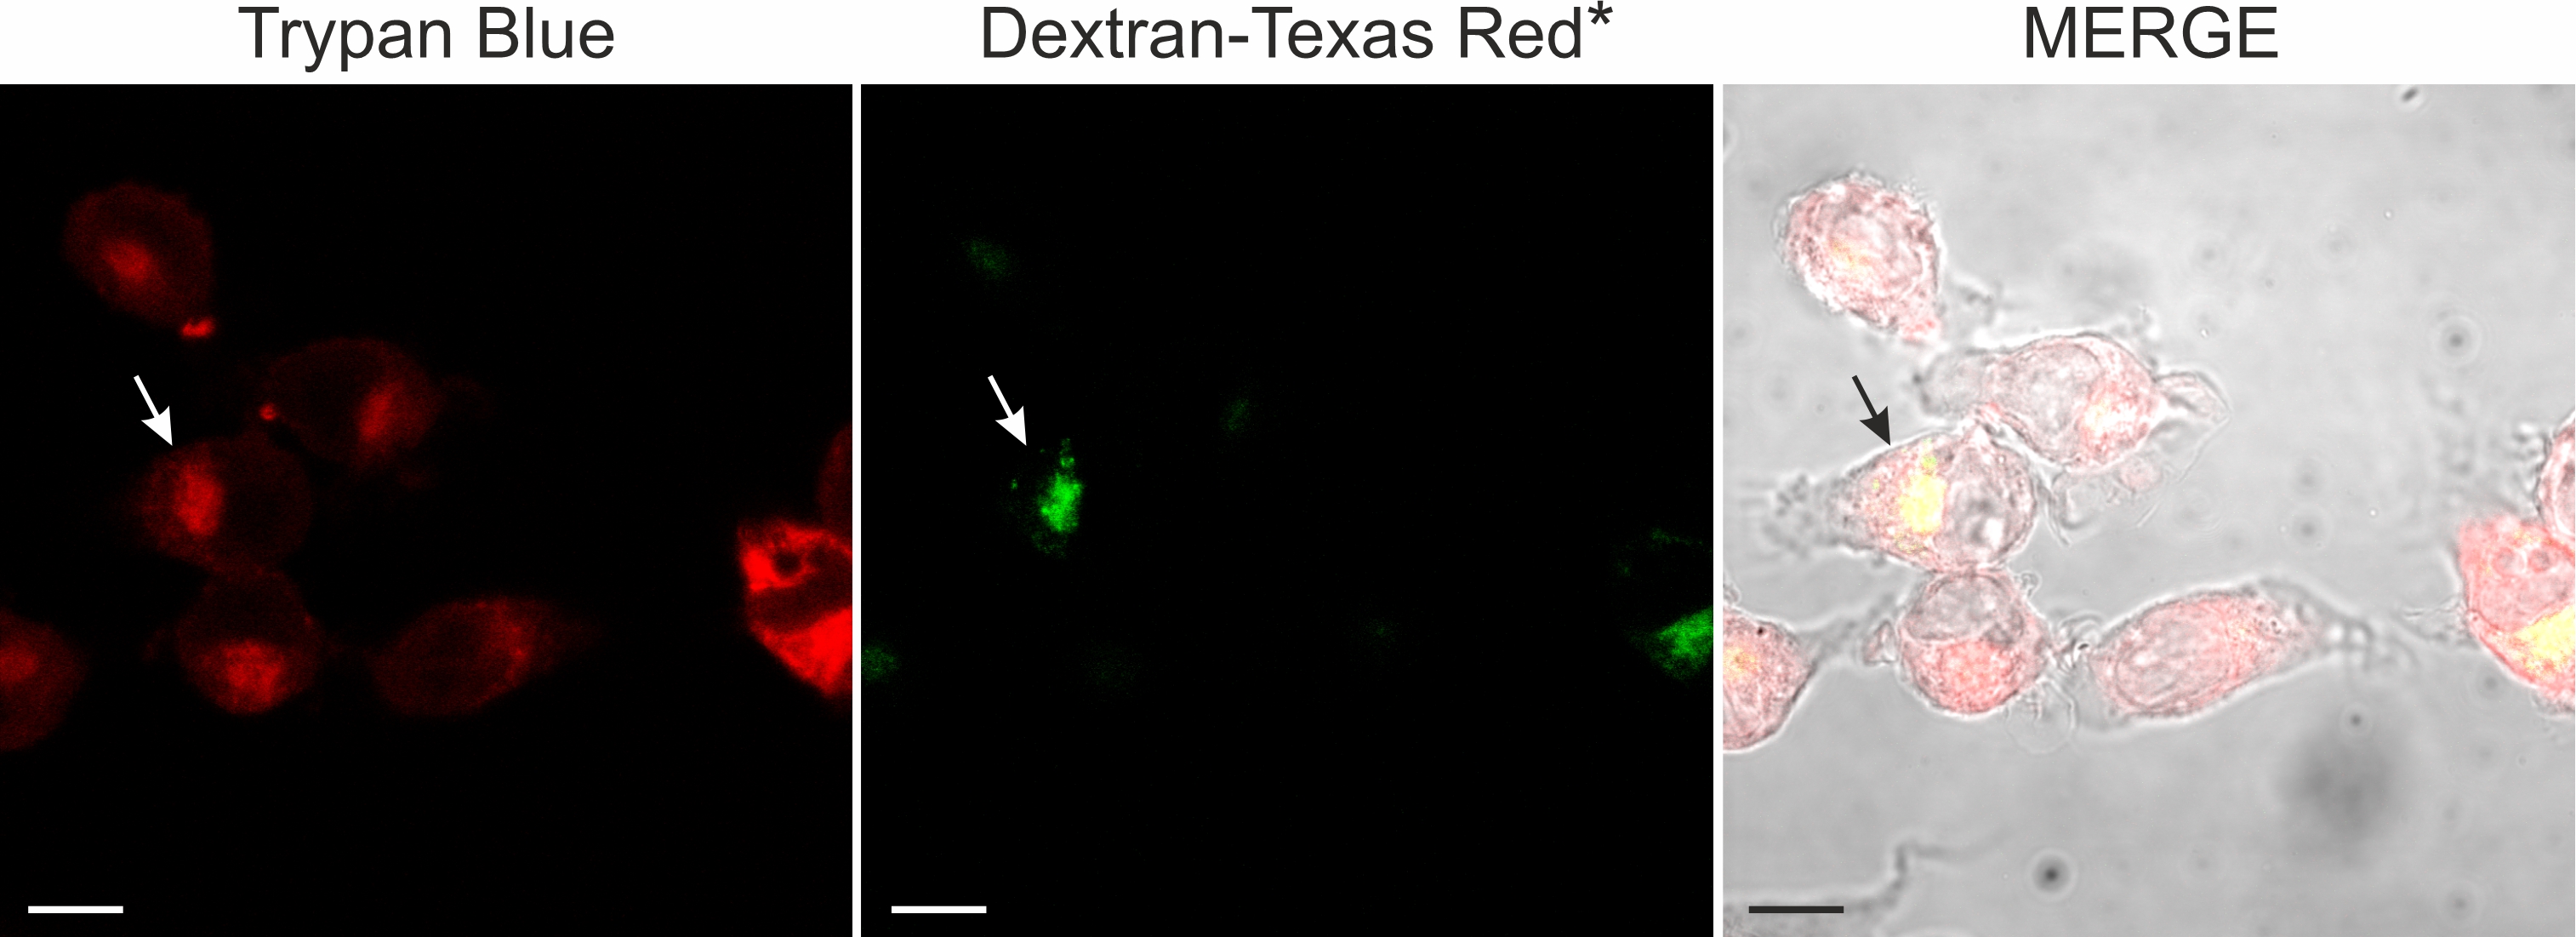
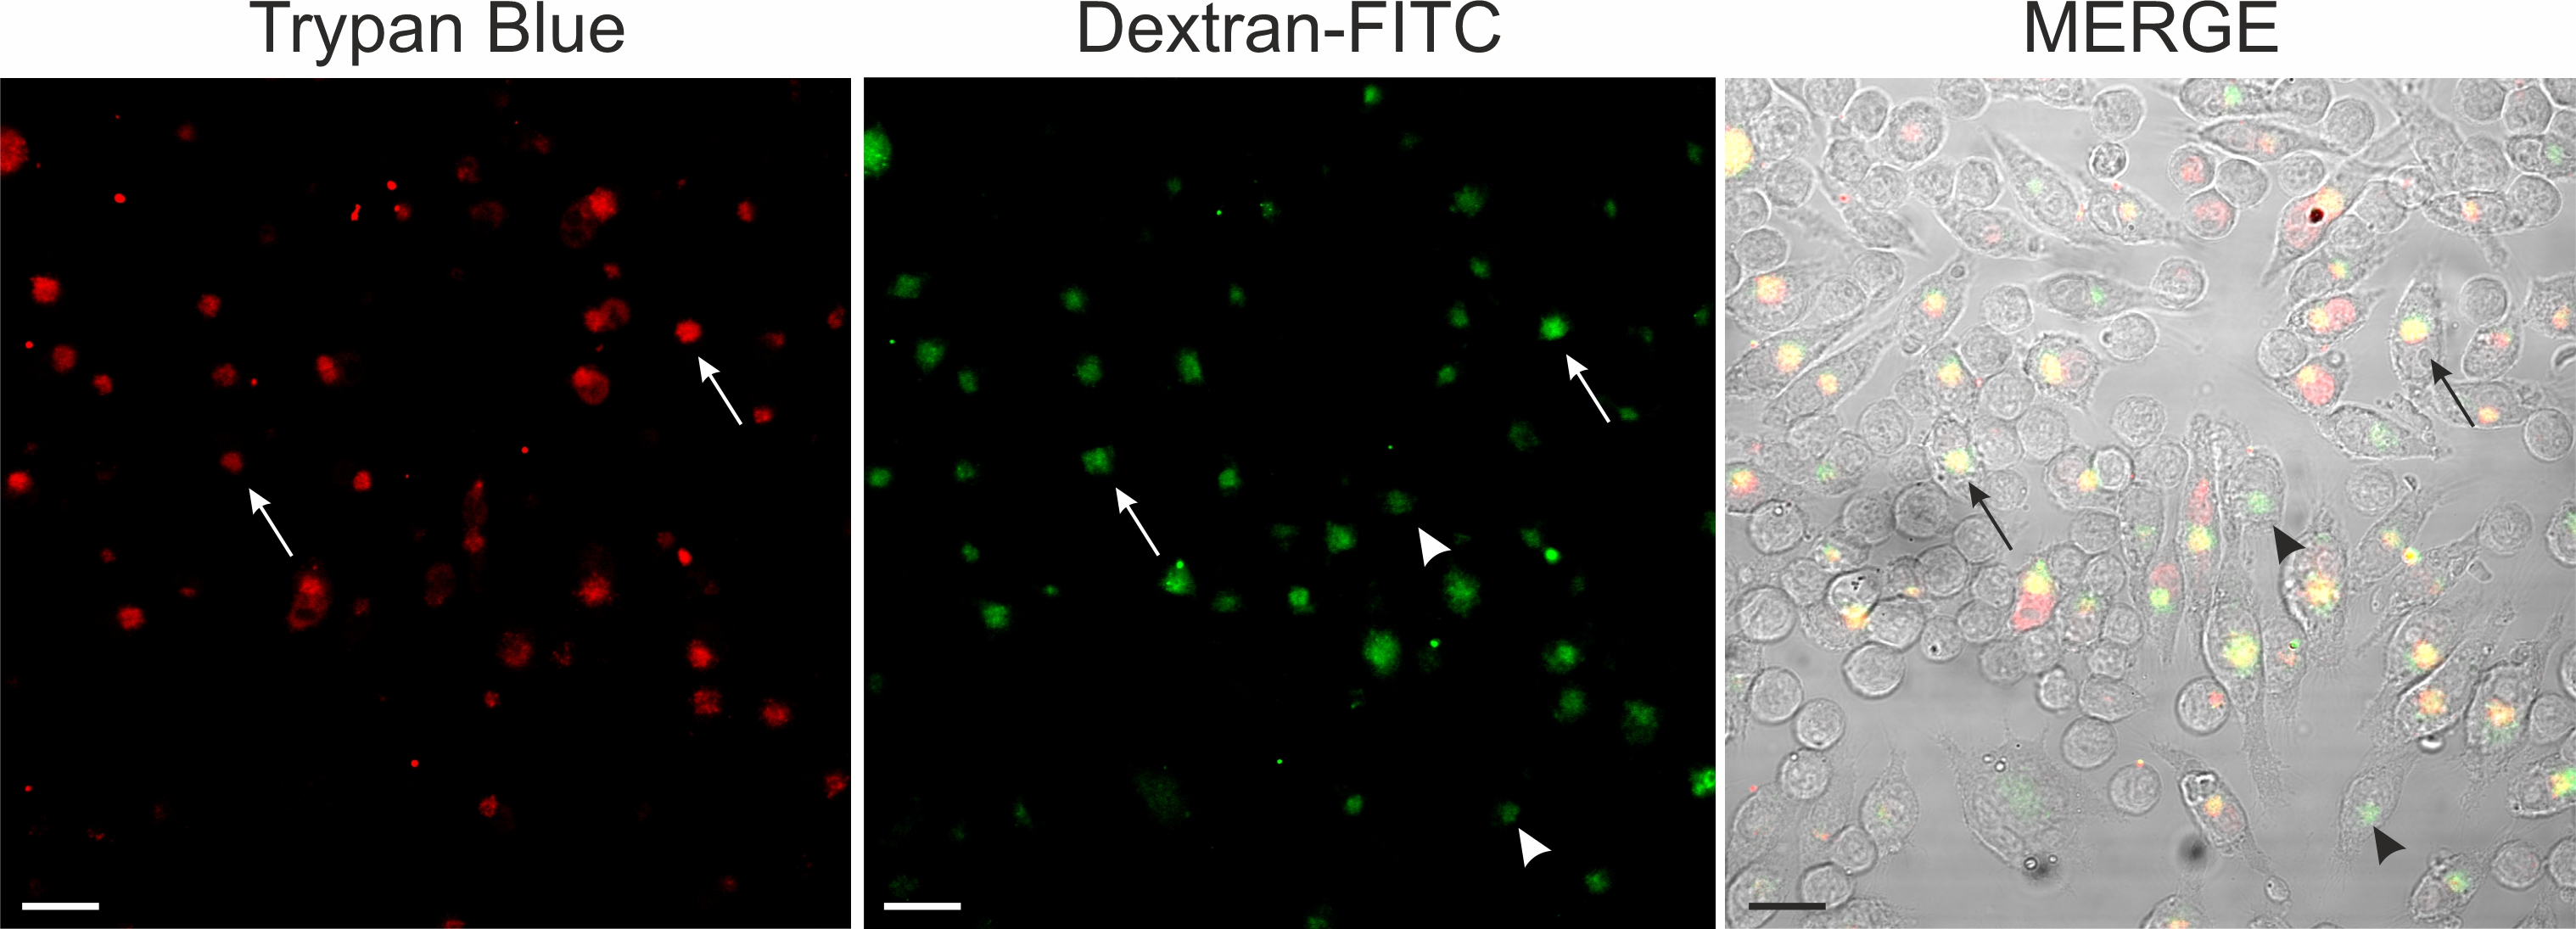
As trypan blue and dextran-conjugated dyes showed a similar intracellular distribution, we next compared the distribution of both dyes at the single cell level in double labelling experiments. Using confocal microscopy, we observed that (1) simultaneous application of Texas red-conjugated dextran and trypan blue did not yield a fluorescence signal and (2) sequential application of Texas red conjugated-dextran and trypan blue revealed fluorescence in the pinosome pool (Fig. 9). Consistent with the fluorescence quenching property of trypan blue [29-31], (1) simultaneous application of the dyes may have quenched dextran Texas red fluorescence, whereas (2) sequential application of the dyes labelled vesicles, which did not fuse and stayed separate, revealed a fluorescence signal. However, the experimental evaluation whether trypan blue and Texas red-conjugated dextran were co-localized within a single vesicle was hampered by the broad emission spectrum of trypan blue (excitation: 580 – 640nm; emission maxima 630 -720), which overlaps with those of Texas red-conjugated dextran (excitation: 595nm; emission max 615 nm). Therefore, we used in a different set of experiments dextran-FITC, having an excitation maximum of around 490 nm. Sequential application of first dextran-FITC followed by trypan blue revealed in the perinuclear area an abundant labeling by both dyes. Fig. 10 shows confocal images of dextran-FITC and trypan blue co-labelled cells. In control as well as in silver nitrate-exposed cells, we observed cells labeled either by trypan blue or by trypan blue and dextran-FITC (Fig. 10). Those cells, which were labeled by both dyes, showed an overlapping, partially overlapping or nonoverlapping accumulation of the dyes in the perinuclear area.
We have described that macropinocytosis causes trypan blue labeling in viable cells. Using trypan blue in cell biological experiments may be advantageous to identify protein-enriched stages during maturation of macropinosomes, and may be used in combination with dextran dyes to visualize pinocytosis. Further, fluorescent vesicles should be evaluated with care when using trypan blue exclusion test to avoid false positive results due to macropinocytosis of trypan blue [40, 41]. In these tests, trypan blue is used to quench the fluorescence of to-be phagocytosed particles, which are attached to a cell but not internalized [40]. Therefore, we suggest that a combination of trypan blue and DAPI staining may be relevant in numerous studies to evaluate cell death and pinocytosis or volume regulation in the same cell culture experiment at the single cell level.
The authors declare that no conflict of interests exist.
| 1 Louis KS, Siegel AC: Cell viability analysis using trypan blue: manual and automated methods. Methods Mol Biol 2011;740:7-12. https://doi.org/10.1007/978-1-61779-108-6_2 |
||||
| 2 Piccinini F, Tesei A, Arienti C, Bevilacqua A: Cell Counting and Viability Assessment of 2D and 3D Cell Cultures: Expected Reliability of the Trypan Blue Assay. Biol Proced Online 2017;19:8. https://doi.org/10.1186/s12575-017-0056-3 |
||||
| 3 Serafini R, Longobardi V, Spadetta M, Neri D, Ariota B, Gasparrini B, Di Palo R: Trypan blue/giemsa staining to assess sperm membrane integrity in salernitano stallions and its relationship to pregnancy rates. Reprod Domest Anim 2014;49:41-47. https://doi.org/10.1111/rda.12221 |
||||
| 4 Bresgen N, Ohlenschläger I, Wacht N, Afazel S, Ladurner G, Eckl PM: Ferritin and FasL (CD95L) mediate density dependent apoptosis in primary rat hepatocytes. J Cell Physiol 2008;217:800-808. https://doi.org/10.1002/jcp.21555 |
||||
| 5 Yona S, Gordon S: From the Reticuloendothelial to Mononuclear Phagocyte System - The Unaccounted Years. Front Immunol 2015;6:328. https://doi.org/10.3389/fimmu.2015.00328 |
||||
| 6 Freeman SA, Grinstein S: Resolution of macropinosomes, phagosomes and autolysosomes: Osmotically driven shrinkage enables tubulation and vesiculation. Traffic 2018;12:965-974. https://doi.org/10.1111/tra.12614 |
||||
| 7 Swanson, JA, King, JS: The breadth of macropinocytosis research. Philos Trans R Soc Lond B Biol Sci 2019;374:20180146. https://doi.org/10.1098/rstb.2018.0146 |
||||
| 8 Tran SL, Puhar A, Ngo-Camus M, Ramarao N: Trypan blue dye enters viable cells incubated with the pore-forming toxin HlyII of Bacillus cereus. PLoS One 2011;6:e22876. https://doi.org/10.1371/journal.pone.0022876 |
||||
| 9 Bukhari M, Burm H, Samways DSK: Ion channel-mediated uptake of cationic vital dyes into live cells: a potential source of error when assessing cell viability. Cell Biol Toxicol 2016;32:363-371. https://doi.org/10.1007/s10565-016-9344-y |
||||
| 10 Brown CD, Sayer R, Windass AS, Haslam IS, De Broe ME, D'Haese PC, Verhulst A: Characterisation of human tubular cell monolayers as a model of proximal tubular xenobiotic handling. Toxicol Appl Pharmacol 2008;233:428-438. https://doi.org/10.1016/j.taap.2008.09.018 |
||||
| 11 Jenkinson SE, Chung GW, van Loon E, Bakar NS, Dalzell AM, Brown CD. The limitations of renal epithelial cell line HK-2 as a model of drug transporter expression and function in the proximal tubule. Pflugers Arch 2012;464:601-611. https://doi.org/10.1007/s00424-012-1163-2 |
||||
| 12 Dallas S, Miller DS, Bendayan R: Multidrug resistance-associated proteins: expression and function in the central nervous system. Pharmacol Rev 2006;58:140-161. https://doi.org/10.1124/pr.58.2.3 |
||||
| 13 Trickler WJ, Lantz-McPeak SM, Robinson BL, Paule MG, Slikker W Jr, Biris AS, Schlager JJ, Hussain SM, Kanungo J, Gonzalez C, Ali SF: Porcine brain microvessel endothelial cells show pro-inflammatory response to the size and composition of metallic nanoparticles. Drug Metab Rev 2014;46:224-231. https://doi.org/10.3109/03602532.2013.873450 |
||||
| 14 Zhao X, Rao Y, Liang J, Lin S, Wang X, Li Z, Huang J: Silver Nanoparticle-Induced Phosphorylation of Histone H3 at Serine 10 Involves MAPK Pathways. Biomolecules 2019;9:78. https://doi.org/10.3390/biom9020078 |
||||
| 15 Chernousova S, Epple M: Silver as antibacterial agent: ion, nanoparticle, and metal. Angew Chem Int Ed Engl 2013;52:1636-1653. https://doi.org/10.1002/anie.201205923 |
||||
| 16 Zhao X, Toyooka T, Ibuki Y: Silver nanoparticle-induced phosphorylation of histone H3 at serine 10 is due to dynamic changes in actin filaments and the activation of Aurora kinases. Toxicol Lett 2017;276:39-47. https://doi.org/10.1016/j.toxlet.2017.05.009 |
||||
| 17 Doodnauth SA, Grinstein, Maxson ME: Constitutive and stimulated macropinocytosis in macrophages: roles in immunity and in the pathogenesis of atherosclerosis. Philos Trans R Soc Lond B Biol Sci 2019;374:20180147. https://doi.org/10.1098/rstb.2018.0147 |
||||
| 18. Hinze C, Boucrot E: Local actin polymerization during endocytic carrier formation. Biochem Soc Trans 2018;46:565-576. https://doi.org/10.1042/BST20170355 |
||||
| 19 Kittl M, Jakab M, Steininger TS, Ritter M, Kerschbaum HH: A Swelling-Activated Chloride Current in Microglial Cells is Suppressed by Epac and Facilitated by PKA - Impact on Phagocytosis. Cell Physiol Biochem 2019;52:951-969. https://doi.org/10.33594/000000066 |
||||
| 20 Mandrekar S, Jiang Q, Daniel Lee CYD, Koenigsknecht-Talboo J, Holtzman DM, Landreth GE: Microglia mediate the clearance of soluble Abeta through fluid phase macropinocytosis. J Neurosci 2009;29:4252-4262. https://doi.org/10.1523/JNEUROSCI.5572-08.2009 |
||||
| 21 Oberhammer FA, Pavelka M, Sharma S, Tiefenbacher R, Purchio AF, Bursch W,Schulte-Hermann R: Induction of apoptosis in cultured hepatocytes and in regressing liver by transforming growth factor beta 1. Proc Natl Acad Sci U S A 1992;89:5408-5412. https://doi.org/10.1073/pnas.89.12.5408 |
||||
| 22 Koivusalo M, Welch C, Hayashi H, Scott CC, Kim M, Alexander T, Touret N, Hahn KM, Grinstein S: Amiloride inhibits macropinocytosis by lowering submembranous pH and preventing Rac1 and Cdc42 signaling. J Cell Biol 2010;188:54763. https://doi.org/10.1083/jcb.200908086 |
||||
| 23 Harrisson F, Callebaut M, Vakaet L: Microspectrographic analysis of trypan blue-induced fluorescence in oocytes of the Japanese quail. Histochemistry 1981;72:563-578. https://doi.org/10.1007/BF00493276 |
||||
| 24 Dutta AK, Okada Y, Sabirov RZ: Regulation of an ATP-conductive large-conductance anion channel and swelling-induced ATP release by arachidonic acid. J Physiol 2002;542:803-816. https://doi.org/10.1113/jphysiol.2002.019802 |
||||
| 25 Nilius B, Droogmans G: Amazing chloride channels: an overview. Acta Physiol Scand 2003;177:119-147. https://doi.org/10.1046/j.1365-201X.2003.01060.x |
||||
| 26 Nilius B, Prenen J, Wissenbach U, Bödding M, Droogmans G: Differential activation of the volume-sensitive cation channel TRP12 (OTRPC4) and volume-regulated anion currents in HEK-293 cells. Pflugers Arch 2001;443:227-233. https://doi.org/10.1007/s004240100676 |
||||
| 27 Sabirov RZ, Dutta AK, Okada Y: Volume-dependent ATP-conductive largeconductance anion channel as a pathway for swelling-induced ATP release. J Gen Physiol 2001;118:251-266. https://doi.org/10.1085/jgp.118.3.251 |
||||
| 28 Strange K, Yamada T, Denton JS: A 30-year journey from volume-regulated anion currents to molecular structure of the LRRC8 channel. J Gen Physiol 2019;151:100-117. https://doi.org/10.1085/jgp.201812138 |
||||
| 29 Busetto S, Trevisan E, Patriarca P, Menegazzi R: A single-step, sensitive flow cytofluorometric assay for the simultaneous assessment of membrane-bound and ingested Candida albicans in phagocytosing neutrophils. Cytometry A 2004;58:201-206. https://doi.org/10.1002/cyto.a.20014 |
||||
| 30 Illien F, Rodriguez N, Amoura M, Joliot A, Pallerla M, Cribier S, Burlina F, Sagan S: Quantitative fluorescence spectroscopy and flow cytometry analyses of cellpenetrating peptides internalization pathways: optimization, pitfalls, comparison with mass spectrometry quantification. Sci Rep 2016;6:36938. https://doi.org/10.1038/srep36938 |
||||
| 31 Loike, JD, Silverstein, SC: A fluorescence quenching technique using trypan blue to differentiate between attached and ingested glutaraldehyde-fixed red blood cells in phagocytosing murine macrophages. J Immunol Methods 1983;57:3739. https://doi.org/10.1016/0022-1759(83)90097-2 |
||||
| 32 Saunders NR, Dreifuss JJ, Dziegielewska KM, Johansson PA, Habgood MD, Møllgård K, Bauer HC: The rights and wrongs of blood-brain barrier permeability studies: a walk through 100 years of history. Front Neurosci 2014;8:404. https://doi.org/10.3389/fnins.2014.00404 |
||||
| 33 Espada J, Stockert JC: Fluorescence of bisazo dye reaction products from the coupled tetrazolium method for proteins. Acta Histochem 1994;96:315-324. https://doi.org/10.1016/S0065-1281(11)80042-5 |
||||
| 34 Huerta S, Goulet EJ, Huerta-Yepez S, Livingston EH: Screening and detection of apoptosis. J Surg Res 2007;139:143-156. https://doi.org/10.1016/j.jss.2006.07.034 |
||||
| 35 Majno G, Joris I: Apoptosis, oncosis, and necrosis. An overview of cell death. Am J Pathol 1995;146:3-15. | ||||
| 36 Wyllie AH, Kerr JF, Currie AR: Cell death: the significance of apoptosis. Int Rev Cytol 1980;68:251-306. https://doi.org/10.1016/S0074-7696(08)62312-8 |
||||
| 37 Epelman S, Lavine K J, Randolph G J: Origin and Functions of Tissue Macrophages. Immunity 2014;41:21-35. https://doi.org/10.1016/j.immuni.2014.06.013 |
||||
| 38 Phan AT, Goldrath AW, Glass CK: Metabolic and epigenetic coordination of T cell and Macrophage immunity. Immunity 2017;46:714-729. https://doi.org/10.1016/j.immuni.2017.04.016 |
||||
| 39 Wynn TA, Vannella KM: Macrophages in tissue repair, regeneration, and fibrosis. Immunity 201;44:450-462. https://doi.org/10.1016/j.immuni.2016.02.015 |
||||
| 40 Simons ER: Measurement of phagocytosis and of the phagosomal environment in polymorphonuclear phagocytes by flow cytometry. Curr Protoc Cytom 2010; DOI: 10.1002/0471142956.cy0931s51. https://doi.org/10.1002/0471142956.cy0931s51 |
||||
| 41 Mosiman VL, Patterson BK, Canterero L, Goolsby CL: Reducing cellular autofluorescence in flow cytometry: an in situ method. Cytometry 1997;30:151-156. https://doi.org/10.1002/(SICI)1097-0320(19970615)30:3<151::AID-CYTO6>3.0.CO;2-O |
||||