×
![]()
Corresponding Author: Aneta Balcerczyk
Department of Molecular Biophysics, University of Lodz
141/143 Pomorska Street, Lodz, 90-236 (Poland)
Tel. +48 42 635 45 10, E-Mail aneta.balcerczyk@biol.uni.lodz.pl
The Role of Lysine-Specific Demethylase 1 (LSD1) in Shaping the Endothelial
Inflammatory Response
Martyna Wojtalaa Dorota Rybaczekb Ewelina Wielgusc Marta Sobalska-Kwapisd Dominik Strapagield Aneta Balcerczyka
aDepartment of Molecular Biophysics, University of Lodz, Lodz, Poland, bDepartment of Cytophysiology, University of Lodz, Lodz, Poland, cCentre of Molecular and Macromolecular Studies, Polish Academy of Sciences, Lodz, Poland, dDepartment of Molecular Biophysics, Biobank Lab, University of Lodz, Lodz, Poland
Introduction
Inflammation is a set of closely related processes in response to injuries caused by various biological, chemical and physical stimuli and is a fundamental cellular process in innate and adaptive immunity [1, 2]. At each stage of inflammation, i.e. initiation, amplification and resolution, vascular endothelial cells play a dynamic role [3]. Human endothelial cells (ECs) are multifunctional cells that form the interface between blood, lymph flow, and the vessel wall and are capable of secreting/responding to a variety of biologically active mediators including: interleukins, chemokines, haemopoietins, growth factors, lipid mediators or nitric oxide to maintain body homeostasis [4]. Under physiological conditions, endothelial cells are at rest and their activity profile is strongly anti-inflammatory. Only the inflammatory factor converts the ECs phenotype to an active state, leading to a rapid and transient inflammatory response independent of de novo gene expression (type 1 activation) or provides a more sustained inflammatory response by inducing gene expression of various proinflammatory cytokines and adhesion molecules (type 2 activation) [3].
The NF-κB family of transcription factors plays a central role in the induced expression of inflammatory genes during the immune response, and proper regulation of these genes is a critical factor in maintaining immune homeostasis. The chromatin environment in the NF-κB binding sites determines the transcription activation of many proinflammatory genes and the dynamic change of the chromatin architecture in order to facilitate the binding of the transcription factor is a key regulatory mechanism [5].
Changes in the chromatin conformation and the regulation of the availability of transcription factors for promoters at the epigenetic level are conditioned, inter alia, by post-translational modifications (PTMs) of highly basic amino acids located at the N-terminus of histone proteins [6]. A focal point of PTMs strongly involved in shaping the chromatin conformation is the methylation status of lysine residues, regulated by a number of methyltransferases and demethylases including lysine-specific demethylase 1 (LSD1) that catalyze removal of the methyl groups from mono- and di-methylated lysine 4 and 9 of histone H3 (H3K4me1/me2 and H3K9me1/me2, respectively). LSD1 was the first discovered histone demethylase to be classified as a member of the amine oxidase superfamily, using flavin adenine dinucleotide (FAD) as a cofactor [7]. The transcriptional consequences of LSD1 activity are difficult to predict due to incorporation of the enzyme into protein complexes such as NuRD or CoREST [8, 9]. The enzyme cannot proceed demethylation process by itself and depends on its interacting partners, e.g. MTA2 or RCOR1 in each respective complex. This protects LSD1 from proteasomal degradation, but also determines LSD1 activity profile, as an activator or repressor, e.g. the proximity of HDAC1 or HDAC2 in complex with LSD1 may remove local histone acetyl groups which inhibit the demethylase activity of LSD1 [10, 11].
Considerable efforts have been made to investigate the role of LSD1 in diverse biological processes and diseases. Increased levels of LSD1 have been found in many malignancies such as those of prostate, breast and neuroblastoma, and correlated with inferior prognosis in patients [12-14]. In parallel studies, a pivotal role of LSD1 in autophagy [15], cell motility and epithelial-to-mesenchymal transition was identified [16, 17]. Therefore the demethylase became a therapeutic target for anticancer therapy [18, 19]. It was also reported that LSD1 is involved in differentiation, stem cell proliferation and the maintenance of pluripotency [20-22] and neuronal development [23]. Our previous studies showed that LSD1 regulates proliferation of human endothelial cells, but is also involved in DNA repair processes [24]. Here, we focused on understanding the role of demethylase in the inflammatory response of endothelial cells, which is crucial in cardiovascular diseases, but also in many metabolic disorders, including cancer development and metastasis. Using the pharmacological and transcriptional model of LSD1 inhibition, we analyzed the consequences of impaired demethylase activity on the LPS-induced inflammatory response. In addition, we also looked at the behavior of NF-κB-p65 under the conditions tested, trying to determine potential interactions between the transcription factor and LSD1.
Materials and Methods
Cell culture and chemical substance
HMEC-1 (Human Microvascular Endothelial Cells-1) were obtained from the Centre for Disease Control and Prevention, Emory University (Atlanta, U.S.) and were cultured in MCDB 131 medium (Life Technologies, Carlsbad, California, U.S.) supplemented 10% heat-inactivated FBS (Life Technologies, Carlsbad, California, U.S.), 10 ng/ml EGF (Millipore, Burlington, Massachusetts, U.S.) and 10 mM glutamine (Invitrogen; Carlsbad, California, U.S.).
U-937 (ATCC, no. CRL-3253), human monocytic cell line was cultured in RPMI-1640 medium with 10% heat-inactivated FBS (Life Technologies, Carlsbad, California, U.S.) according to standard suspension cell culture protocol.
Lipopolysaccharide (LPS) from Escherichia coli O55:B5 (Prod. No.: L4524, Sigma-Aldrich, St. Louis, MO, U.S.) have been used for the stimulation of inflammatory reaction of endothelial cells.
2-PCPA, tranylcypromine hydrochloride, was purchased from Cayman Chemicals (Ann Arbor, Michigan, U.S.). 2-PCPA is an irreversible monoamine oxidases (MOA) A and B inhibitor, which LSD1 is a family member. Inhibition of MOA A and B catalytic sites is clinically used in the treatment of depression, anxiety and Parkinson’s disease [10]. Although not as selective, tranylcypromine is irreversible mechanism-based inhibitor of LSD1 with an IC50 value of 20.7 µM and a Ki value of 242.7 µM that effectively inhibits histone demethylation in vivo [25].
shRNA silencing expression of LSD1 in HMEC-1
The silencing of lysine-specific demethylase 1 was performed in HMEC-1 using an lentivirial inducible shRNA system, Inducible DharmaconTM TRIPZTM (Dharmacon, Lafayette, U.S.) taking into account the manufacturer’s instructions. Silencing efficiency was checked by four LSD1 shRNA sequences (#RHS4696-200767629, #RHS4696-200763212, #RHS4696-200695244, #RHS4696-200765304) purchased from Dharmacon, Lafayette, U.S. As a control for LSD1 DMT silencing, cells were transduced with an empty vector – nonTarget (non-silencing shRNA, #RHS4743; Dharmacon, Lafayette, U.S.). Upon addition of 1 µg/ml doxycycline (DOX) to HMEC-1 to induce LSD1 silencing, expression of the targeted gene was estimated by quantitative PCR and Western blotting (WB).
HMEC-1 viability by resazurin reduction assay
HMEC-1 viability after 2-PCPA treatment was estimated as described previously using resazurin and taking advantage of the ability of live cells to reduce non-fluorescent substrate to fluorescent product, rezorufin [26]. Cells were seeded onto 96-well plates at a density of 1.5×10⁴ cells/well. After 16-24 h cells were treated with the 2-PCPA at the indicated concentrations for 24 h. After incubation, cell culture medium containing the inhibitor was aspirated, wells were rinsed twice with PBS containing Ca2+/Mg2+, and incubated in reaction buffer: PBS containing Ca2+/Mg2+, 5.5 mM glucose and 0.0125 mg/ml resazurin. After 2 h incubation fluorescence was measured at: λex= 530 nm, λem= 590 nm using a Fluoroscan Ascent Microplate Reader (Labsystem Inc.).
Adhesion of monocytes to the activated endothelial cells
HMEC-1 were seeded onto 6-well plates at a density of 2×10⁶ cells/well. After 16-24h, when the cells reached 100% of confluency, formed paving stones, the medium was changed to fresh one, containing 100 μM 2-PCPA. After 2 h to the appropriate wells 100 ng/ml LPS was added and incubation was continued for next 4 h. Separately, U-937 cells were stained with Hoechst 33342 (1 μM), in dark, for 10 min and an excess of the fluorescent probe was removed by a series of RPMI medium washes. Then, incubation medium from ECs was removed and stained U-937 cells were added in fresh cell culture medium (1 mln monocytes per well). Incubation of monocytes with endothelial cells was performed at 37°C with agitation, in dark and lasted 1 h. After that time, the unbound monocytes were removed by aspiration. The monolayers of ECs were rinsed twice with PBS containing Ca2+/Mg2+. Finally, complexes of cells on the plate were fixed in 2% glutaraldehyde and stained monocytes were counted using fluorescence microscope Nikon.
Analysis of cytokine release from LPS-activated ECs
Test of cytokine and chemokine release by LPS-activated endothelial cells was performed as described previously [27] using Proteome Profiler Human Cytokine Array: Panel A and the XL option (R&D Systems, Mineapolis, US). Tests were performed on two experimental models: (i) pharmacological inhibition of LSD1 – where extracellular medium come from HMEC-1 activated by LPS (100 ng/ml, 4 h) and HMEC-1 pre-treated for 2 h with 2-PCPA (100 μM) and 4 h LPS (100 ng/ml) (6 h total incubation). In addition, we looked at the impact of only 2-PCPA (100 μM, 6 h) on the HMEC-1 secretory profile; (ii) transcriptional silencing of LSD1 – HMEC-1: nonT and LSD1 KD were treated with LPS (100 ng/ml, 4 h). In both models cell culture supernatants were collected after incubations, centrifuged, diluted and mixed with a cocktail of biotinylated detection antibodies supplied by manufacturer. Then, samples were incubated overnight on the cytokine assay kit membrane. Following a wash to remove unbound material, streptavidin-HRP and chemiluminescent detection reagent was added to quantify the cytokines levels.
Protein extraction
Total protein cellular extract from endothelial cells was prepared by using M-PER solution (Thermo Fisher Scientific, Massachusetts, U.S.) according to manufacturer’s instruction.
Nuclear and cytosol protein fractions were isolated using the NE-PER Nuclear and Cytoplasmic Extraction Reagent (Thermo Fisher Scientific, Massachusetts, U.S.) according to the protocol supplied with a producer. The reagent volumes was calculated relative to the volume of packed HMEC-1. Halt™ Protease Inhibitor Cocktail (Thermo Scientific™, Massachusetts, U.S.) and Phosphatase Inhibitor Cocktail 2 (Sigma Aldrich, St. Louis, MO, U.S.) were added to the reagents at each stage of protein fraction isolation.
Isolation of histones was carried out according to the acid extraction protocol as described previously [28]. Cells were subjected to a lysis buffer (10 mM HEPES, 1.5 mM MgCl2, 10 mM KCl, 0.5 mM DTT and 1.5 mM PMSF) and centrifuged (10,000 rpm, 20 min, 4°C). Then the samples acidified by incubation in lysis buffer containing 0,26 M sulphuric acid for 1 h, were vortexed every 15 min. After the incubation, the samples were centrifuged (13,000 rpm, 10 min, 4°C) and extraction of the proteins was performed by precipitation with acetone in -20°C. The obtained pellet of proteins was dissolved in buffer (20 mM TRIS pH 8.0, 100 mM KCl, 5% Tween, 10% glicerol, 0.2 mM EDTA, 1 mM DTT, 1.5 mM PMSF). All the histone isolation steps were performed on ice and all the reagents were cooled before use.
Western blotting
10 μg or 20 μg protein were separated by sodium dodecyl sulphate polyacrylamide gel electrophoresis (SDS-PAGE) and transferred to a polyvinylidene difluoride membrane according to the manufacturer’s protocols (Bio-Rad, Poland). After incubation with 5% non-fat milk in TBST (10 mM Tris, pH 8.0, 150 mM NaCl, 0.5% Tween 20) for 60 min, the blotted membranes were washed three times with TBST and incubated with monoclonal antibodies overnight at 4 °C with agitation. The next day, after washing off the primary antibodies, membranes were incubated with horseradish peroxidase-conjugated anti-rabbit or anti-mouse secondary antibodies for 2 h at room temperature with agitation. The signal from the membrane was visualised using ECL (WESTAR ETA C 2.0, Cyanagen, Italy) and the Alliance Mini HD4 CCD digital imaging system (UVItec, Cambridge, United Kingdom) or using X-ray film and manual imaging. Values for proteins were normalised to the loading control, GAPDH or PCNA, depend on the experimental analysis.
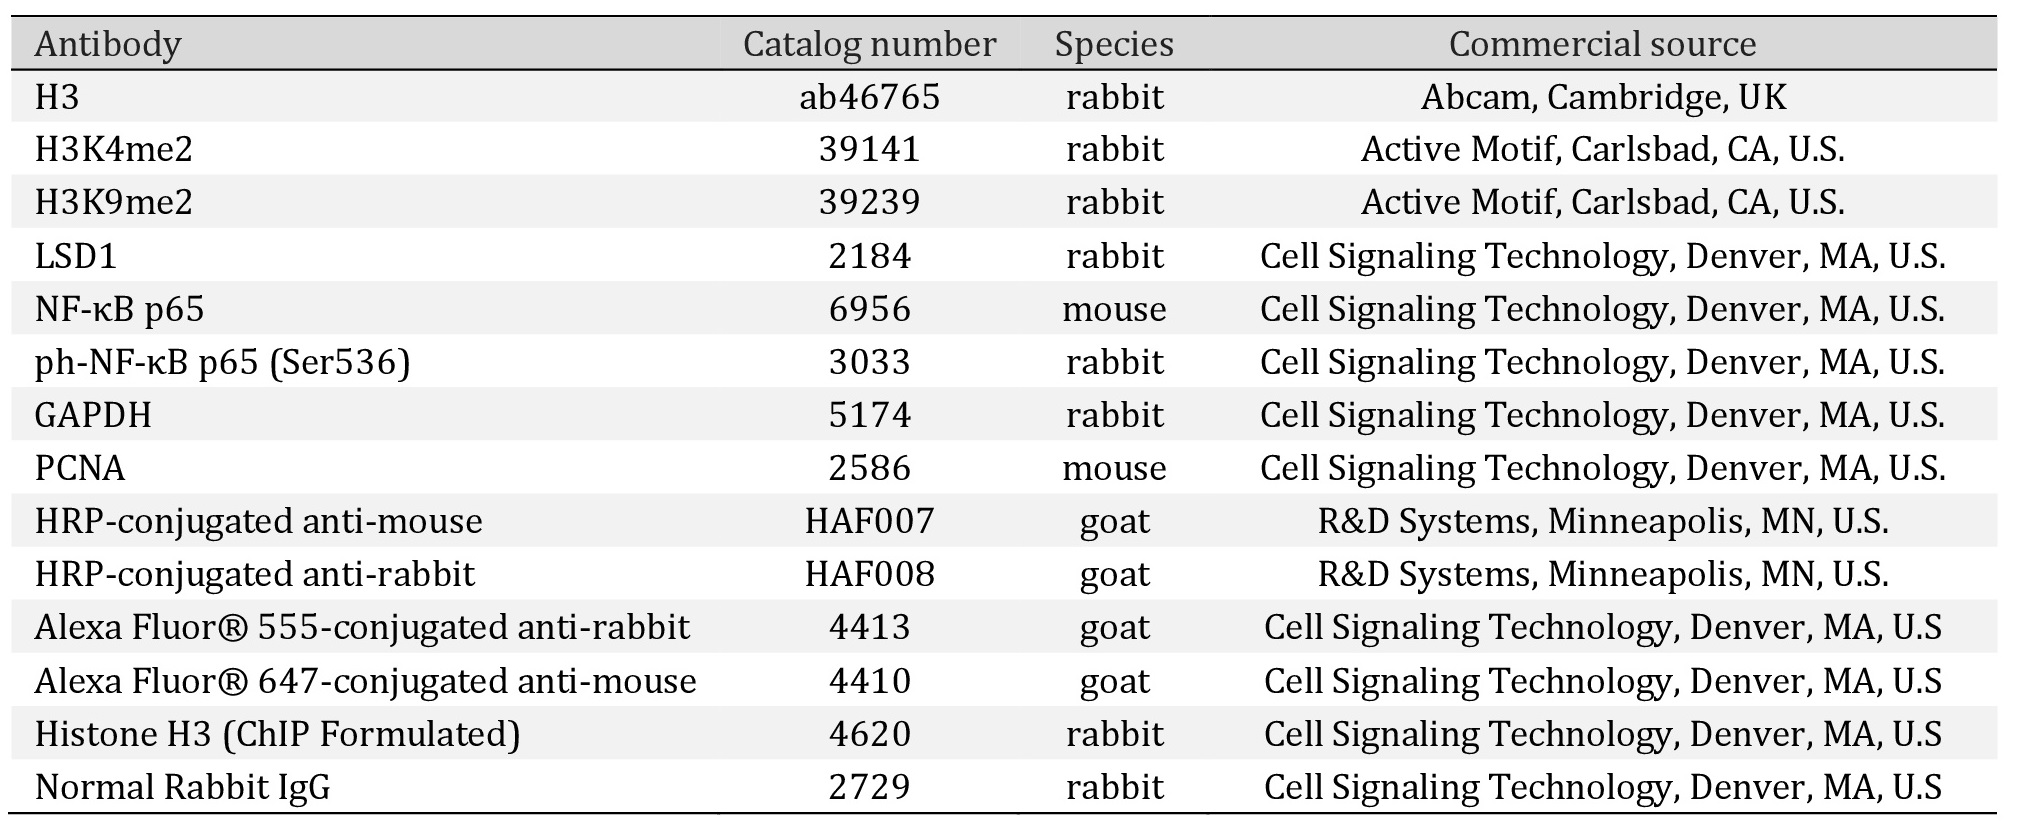
Antibodies. The list of primary and secondary antibodies used in the studies is presented in Table 1. This antibodies were diluted at 1:1,000 to 1:2,000 in 3% BSA solution.
Immunocytochemistry
Immunocytochemical detection of both total and phosphorylated form of p65 was performed with antibodies listed in the Table 1, using 8-well chamber slides dedicated to immunocytochemical staining, as described previously [24]. For the detection of total p65, ph-p65(Ser-536), cells were fixed for 45 min in 4% paraformaldehyde buffered with PBS. The cells were pre-treated in a blocking buffer (10% horse serum, 1% bovine serum albumin (BSA), 0.02% NaN3, PBS) for 1 h at room temperature to minimize the non-specific adsorption of antibodies to the coverslips and subsequently were incubated overnight at 4°C with primary antibodies (1:750). Cells were washed three times (5 min each) with PBS/0.2% Triton X-100 (PBT) prior to incubation with secondary antibodies (1:1,000) for 1 h at 37°C in the dark. Next, cells were washed 3 times with PBT (5 min each) and then for 5 min in PBS. Coverslips were covered by cover glass under 4 μl of Vectashield mounting medium (Vector Laboratories) containing DAPI or propidium iodide. Observations were made using an AxioImager A1 fluorescence microscope (Zeiss, Jena, Germany) equipped with Cy3, GFP and DAPI filters. Negative control sections incubated with non-immune serum in place of primary antibodies were free from immunostaining (data not shown); these negative control sections DAPI signals but completely lacked fluorescence in the wavelength of Alexa Fluor 488-conjugated secondary antibodies. Image data were collected at exactly the same exposure time on an AxioCam MRc5 CCD camera (Zeiss, Jena, Germany).
Data collection. Quantitative image analysis was performed on unedited images, converted to 8-bit grayscale in Fiji – an Open Source platform [29] based on ImageJ software (NIH and LOCI, University of Wisconsin, United States). Post-analytic image processing was performed in Affinity Photo 18.5 and Affinity Designer 18.5 (Serif Europe Ltd, Nottingham, England), based on the microscope images of real samples.
RNA extraction, cDNA synthesis and RT-qPCR
Total RNA were isolated from cells using InviTrap Spin Cell RNA Mini Kit (Stratec Molecular, Germany) according to the manufacturer’s protocol. RNA concentration and purity was verified by optical density (OD) measurement on BioTek Eon™ Microplate Spectrophotometer.
cDNA synthesis was performed with PrimeScript RT Master Mix (Perfect Real Time, Takara; Japan) according to the manufacturer’s instruction provided with the kit.
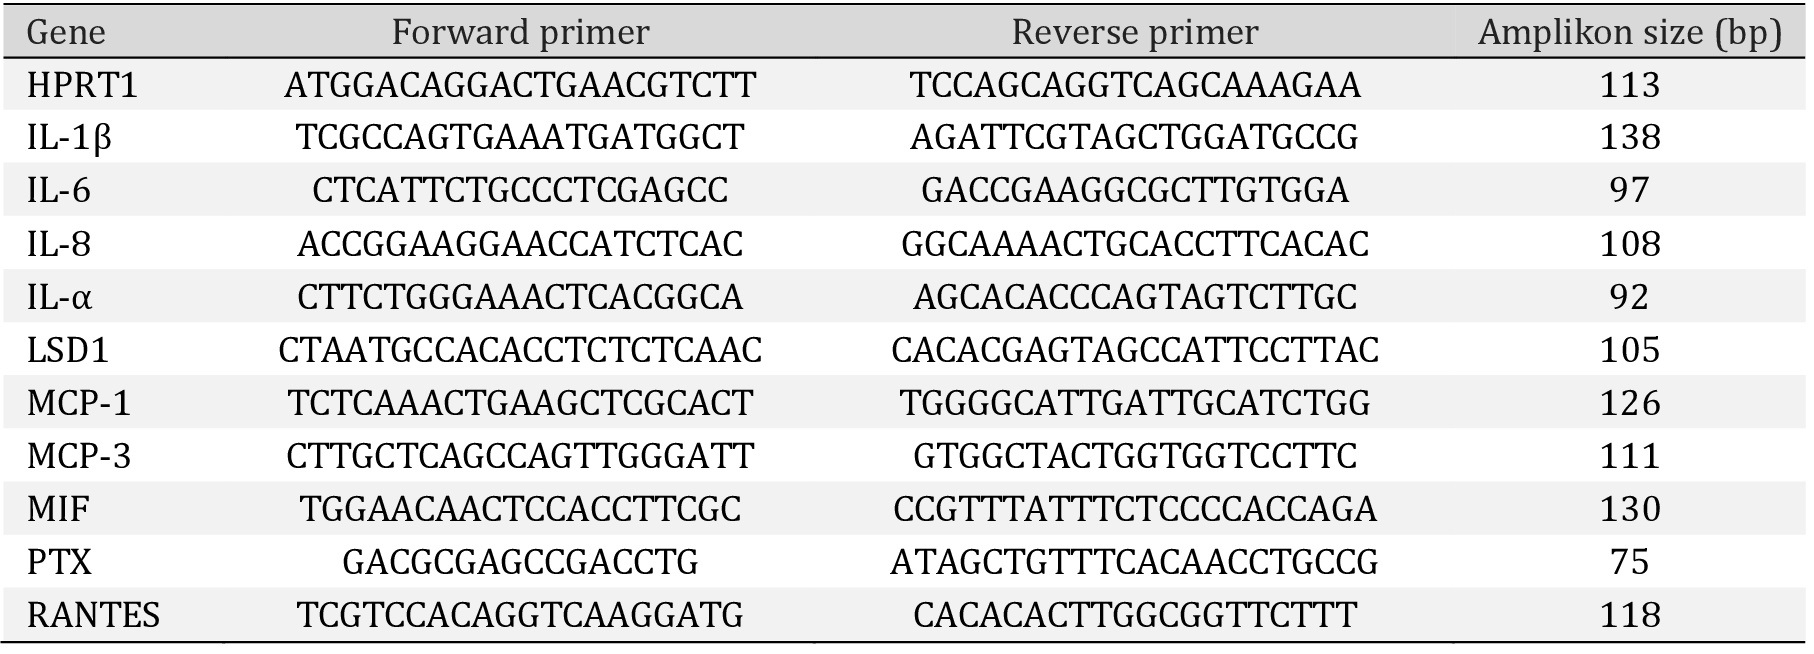
Quantitative Real-Time PCR was performed using an Eco Real-Time PCR System (Illumina; San Diego, California, U.S.). The total reaction volume (10 μl) consisted of: 0.2 nM of forward and reverse primers, cDNA template, 5 µl Takara BioSYBR Green Master Mix, and DNAase/RNAase free water. The amplification conditions were as follow: an initial step of 95°C for 30 s, then 40 cycles of 95°C for 5 s, 60°C for 15 s. The gene-specific primers that have been used are presented in the Table 2. HPRT1 was used as a reference for gene expression normalization, performed according to the 2− ΔΔCt method [30].
Gene profiling of HMEC-1 after LSD1 silencing
Transcriptomic analysis of nonTarget/LSD1 KD HMEC-1, unstimulated and stimulated with LPS (100 ng/ml for 4 h), was performed in triplicate on mRNA. The RNA integrity (RIN >8) and purity were assessed by Bioanalyzer (Agilent Technologies, Waldbronn, Germany) for twelve samples. Concentration of every sample was evaluated using Qubit® RNA HS Assay Kit (Invitrogen™, Carlsbad, CA, USA). Microarray hybridization was performed using TargetAmp Nano-g Biotin-aRNA Labeling Kit for the Illumina System (Epicentre, Madison, Wisconsin, USA), followed by HumanHT-12 v4 Expression BeadChip Kit (Illumina Inc., San Diego, CA, USA). All steps were performed according to the manufacturer’s instructions. Fluorescence signal was recorded by iScan Reader (Illumina Inc., San Diego, CA, USA). Obtained fluorescence intensities were preprocessed using the GenomeStudio Software v. 2011.1 (Illumina Inc., San Diego, CA, USA) with Gene Expression module v. 1.9.0 and then the data was exported from GenomeStudio using Sample Probe Profile format. Exported data was then analysed using GeneSpring GX (v. 14.5) (Agilent Technologies Inc., Santa Clara, CA). Significance analysis of every probe was tested using One-way ANOVA with Student-Newman-Keuls (SNK) post-hoc analysis with Benjamini-Hochberg multiple testing correction implemented in GeneSpring GX. To estimate the statistically significant expression differences between stimulated and unstimulated with LPS cells, the Moderated T-Test was used with Benjamini-Hochberg multiple testing correction after the fold-change (FC) threshold FC>1.5.
Chromatin immunoprecipitation (ChIP) and qPCR analysis
HMEC-1 were seeded onto 15 cm plates (1.5x10⁷ cells). Next day, the cells were treated in growth medium with (i) 2-PCPA (100 µM) for 2 hours, then LPS was added (100 ng/ml) for 4 hours or (ii) cells were only stimulated with LPS (100 ng/ml, 4 hours).
Chromatin fixation and shearing. After the incubation cells were fixed with 1% formaldehyde (10 minutes) followed by quenching in 125 mM glycine. Cells were washed with cold PBS and harvested by cell scraper using ice cold PBS with protease inhibitors (Thermo Fisher Scientific, Waltham, Massachusetts, United States). Then cells were resuspended in SDS Lysis Buffer (0.5% SDS, 10 mM EDTA, 50 mM Tris-HCl pH 8.1, with protease inhibitors). Chromatin was sheared by sonication (Bioruptor; Diagenode, Liège, Belgium) to generate fragments of 200-500 bp (45 min of sonication using a 30 s “on and off” cycle scheme; high power). Samples were centrifuged for 10 minutes at 4°C at 13 000 g to separate the sheared chromatin from the cell debris. The sonication efficiency was checked by DNA electrophoresis.
ChIP reaction. 25 µg of DNA (sheared chromatin) was taken to immunoprecipitation reaction, depends on the type of analyzed antigen (2% of chromatin was saved for qPCR reaction as an input). The chromatin samples were diluted with ChIP dilution buffer (0.01% SDS, 1.1% Triton X-100, 1.2 mM EDTA, 16.7 mM Tris-HCl pH 8.1, 167 mM NaCl, protease inhibitors cocktail) and precleared with washed beads for 2 hours at 4°C. Simultaneously, Dynabeads® magnetic beads (Thermo Fisher Scientific, Waltham, Massachusetts, United States) were washed with low salt buffer (0.1% SDS, 1% Triton X-100, 2 mM EDTA, 20 mM Tris-HCl pH 8.0, 150 mM NaCl) and preincubated with the appropriate antibodies (Table 1). The antibodies that did not bind to the beads were discarded and the purified chromatin was added to the beads. The samples were incubated overnight at 4°C, in slow rotation. Next day beads were washed sequentially with low-salt buffer (0.1% SDS, 1% Triton X-100, 2 mM EDTA, 20 mM Tris-HCl pH 8.0, 150 mM NaCl), high-salt buffer (0.1% SDS, 1% Triton X-100, 2 mM EDTA, 20 mM Tris-HCl pH 8.0, 500 mM NaCl), LiCl buffer (0.25 M LiCl, 1% Tergitol, 1% deoxycholic acid, 1 mM EDTA, 10 mM Tris-HCl pH 8.0 buffer), TE buffer (10 mM Tris- HCl pH 8, 0,1 mM EDTA pH 8.0) and TE + 0.01% SDS, for 5 min in each solution. Immuno-complexes were eluted from the beads using elution buffer (20mM Tris-HCl pH 7.5, 5 mM EDTA, 50 mM NaCl, 1% SDS). To reverse the protein-DNA cross-linking and recover the DNA, proteinase K (20 mg/ml) was added to the samples and mild heating was performed (2 h at 65°C). Next, all the samples (including input) were purified by Qiagen MinElute Reaction Cleanup Kits (Qiagen, Hilden, Germany).
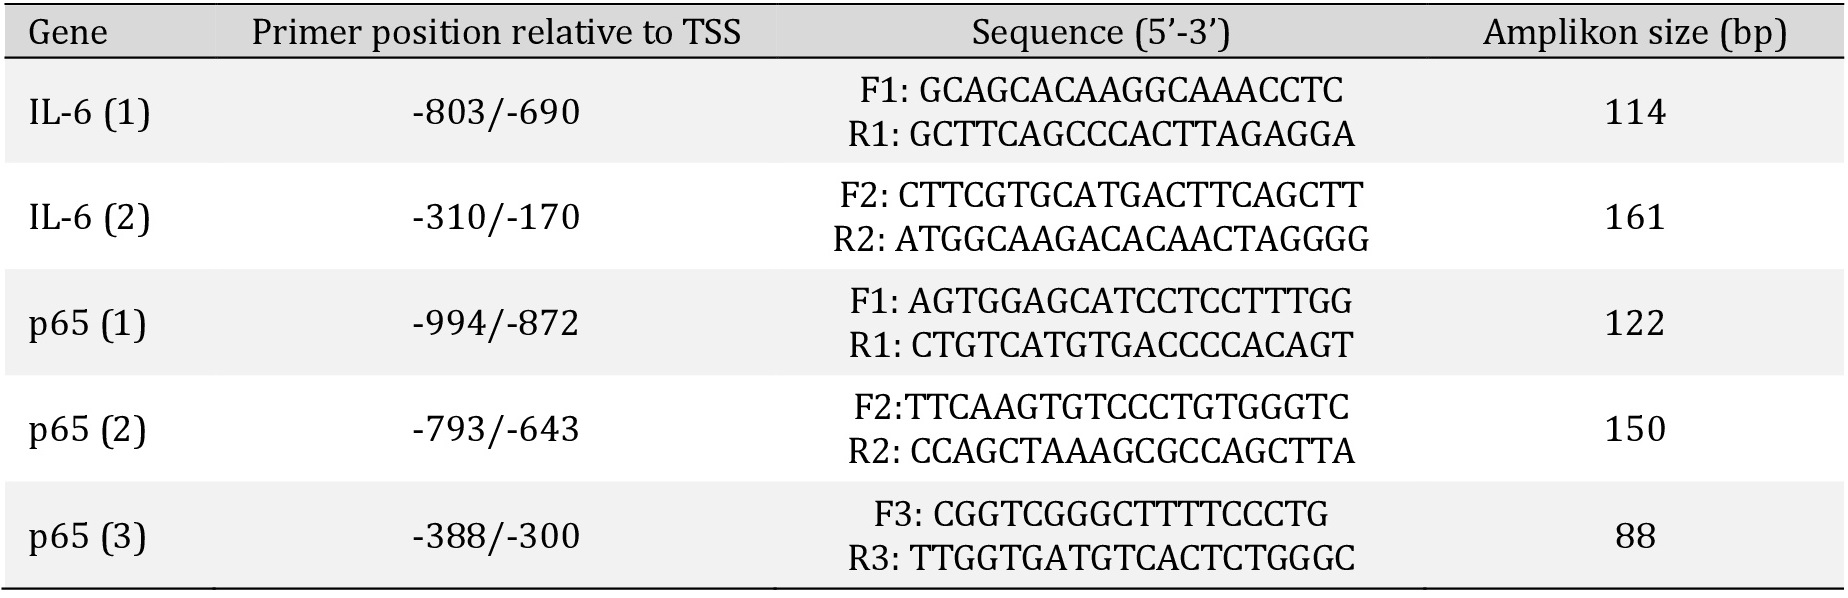
qPCR reaction. The ChIP samples were analyzed by Quantitative Real-Time PCR using Eco Real-Time PCR System (Illumina; San Diego, California, U.S.) and Takara BioSYBR Green Master Mix chemistry (Takara, Japan). The PCR reaction was as presented: an initial step of 30 s at 95°C, followed by 40 cycles of: 5 s at 95°C, 15 s at 60°C. PCR primers (Table 3) were designed via PrimerBlast software. The presence of single product was confirmed by melting-curve analysis, and data were analyzed to obtain enrichments relative to input. IgG and no antibody control were included in the analysis as an internal controls for binding reaction specificity.
Statistical analysis
Statistical analyses, unless otherwise indicated, were performed by means of STATISTICA 13.1 PL software (StatSoft INC, Tulsa, Oklahoma). All data are expressed as mean ± SD. Statistical significance between 2 groups (control vs treated) was assessed by the Student’s t-test for independent samples or the Welch’s test for normal distributions and the Mann-Whitney test for abnormal distributions. One-way ANOVA with Tukey’s post-hoc test was used for more comparisons. A probability p<0.05 was considered as statistically significant. In turn, microarray results were analysed using GeneSpring GX v. 14.5 statistical tools described in the section above.
Results
Inhibition of LSD1 activity reduces inflammatory reaction in response to lipopolysaccharide (LPS) treatment and diminish recruitment of monocytes to endothelial cells
To provide reliable evidence about the role of lysine-specific demethylase 1 in the inflammatory reaction of human endothelial cells, in parallel we examined response of cells to the inflammatory factor (100 ng/ml lipopolysaccharide) in two models: (i) pharmacological inhibition of LSD1 and (ii) transcriptional silencing of the enzyme.
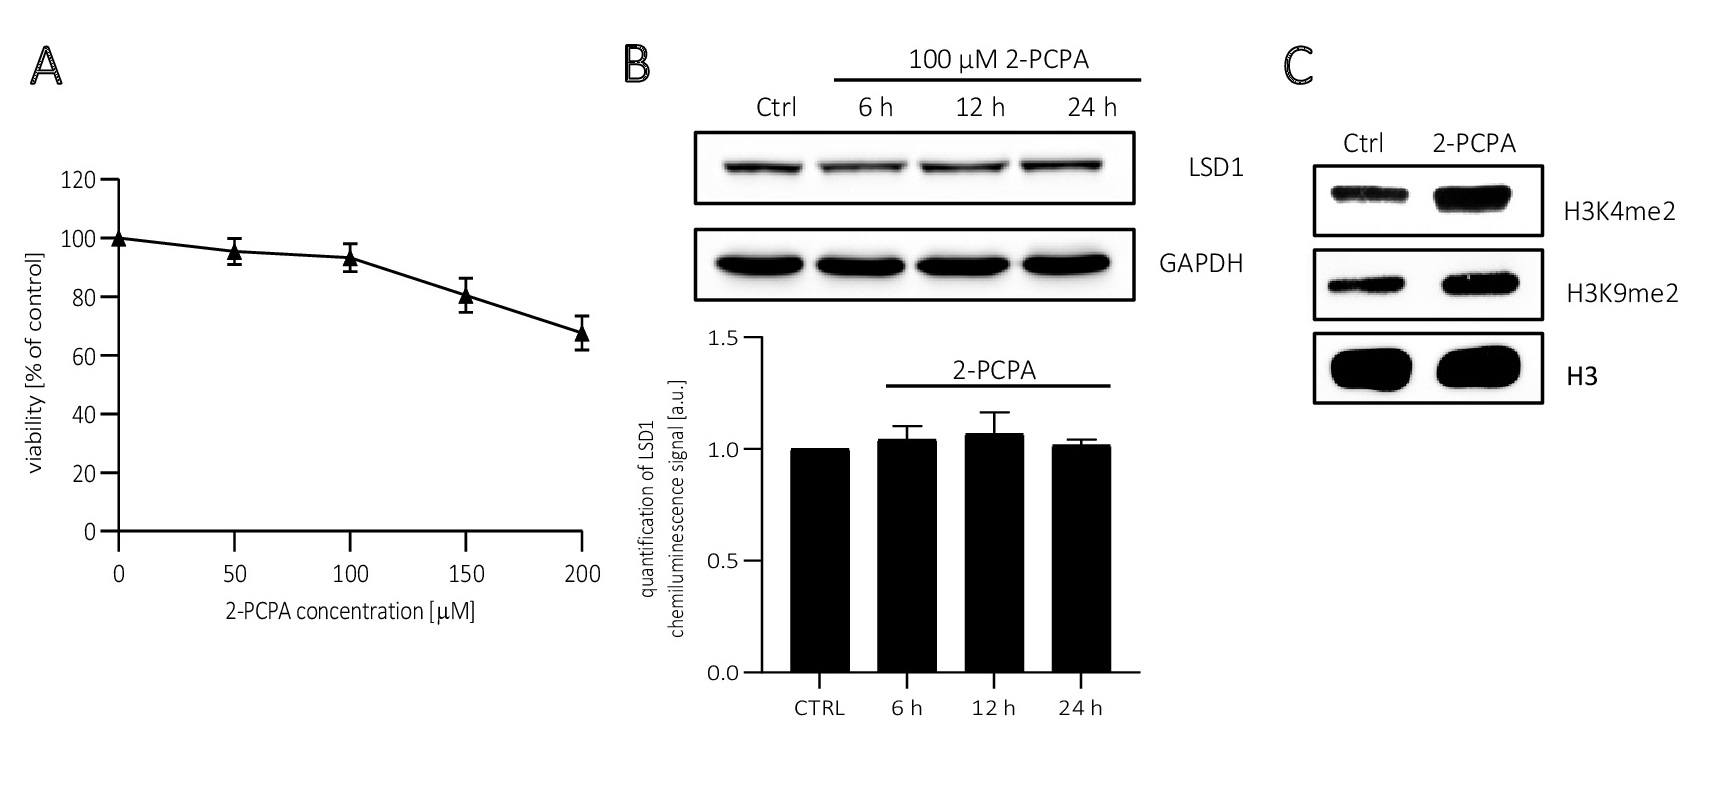
In the pharmacological model of LSD1 inhibition we used 2-PCPA (tranylcypromine chloride), an inhibitor of monoamine oxidases, of which LSD1 belongs. The inhibitor concentration (100 µM) was selected on the basis of cell viability assay (Fig. 1A) and changes in the methylation state of the LSD1 substrates: lysine K4 and K9 of histone H3, i.e. H3K4me2 and H3K9me2 (Fig. 1C). At the level of inhibitor testing, we also analyzed its effect on LSD1 protein expression and found no significant changes between control and inhibitor-treated samples (Fig. 1B).
The response of endothelial cells to inhibited activity of lysine-specific demethylase 1
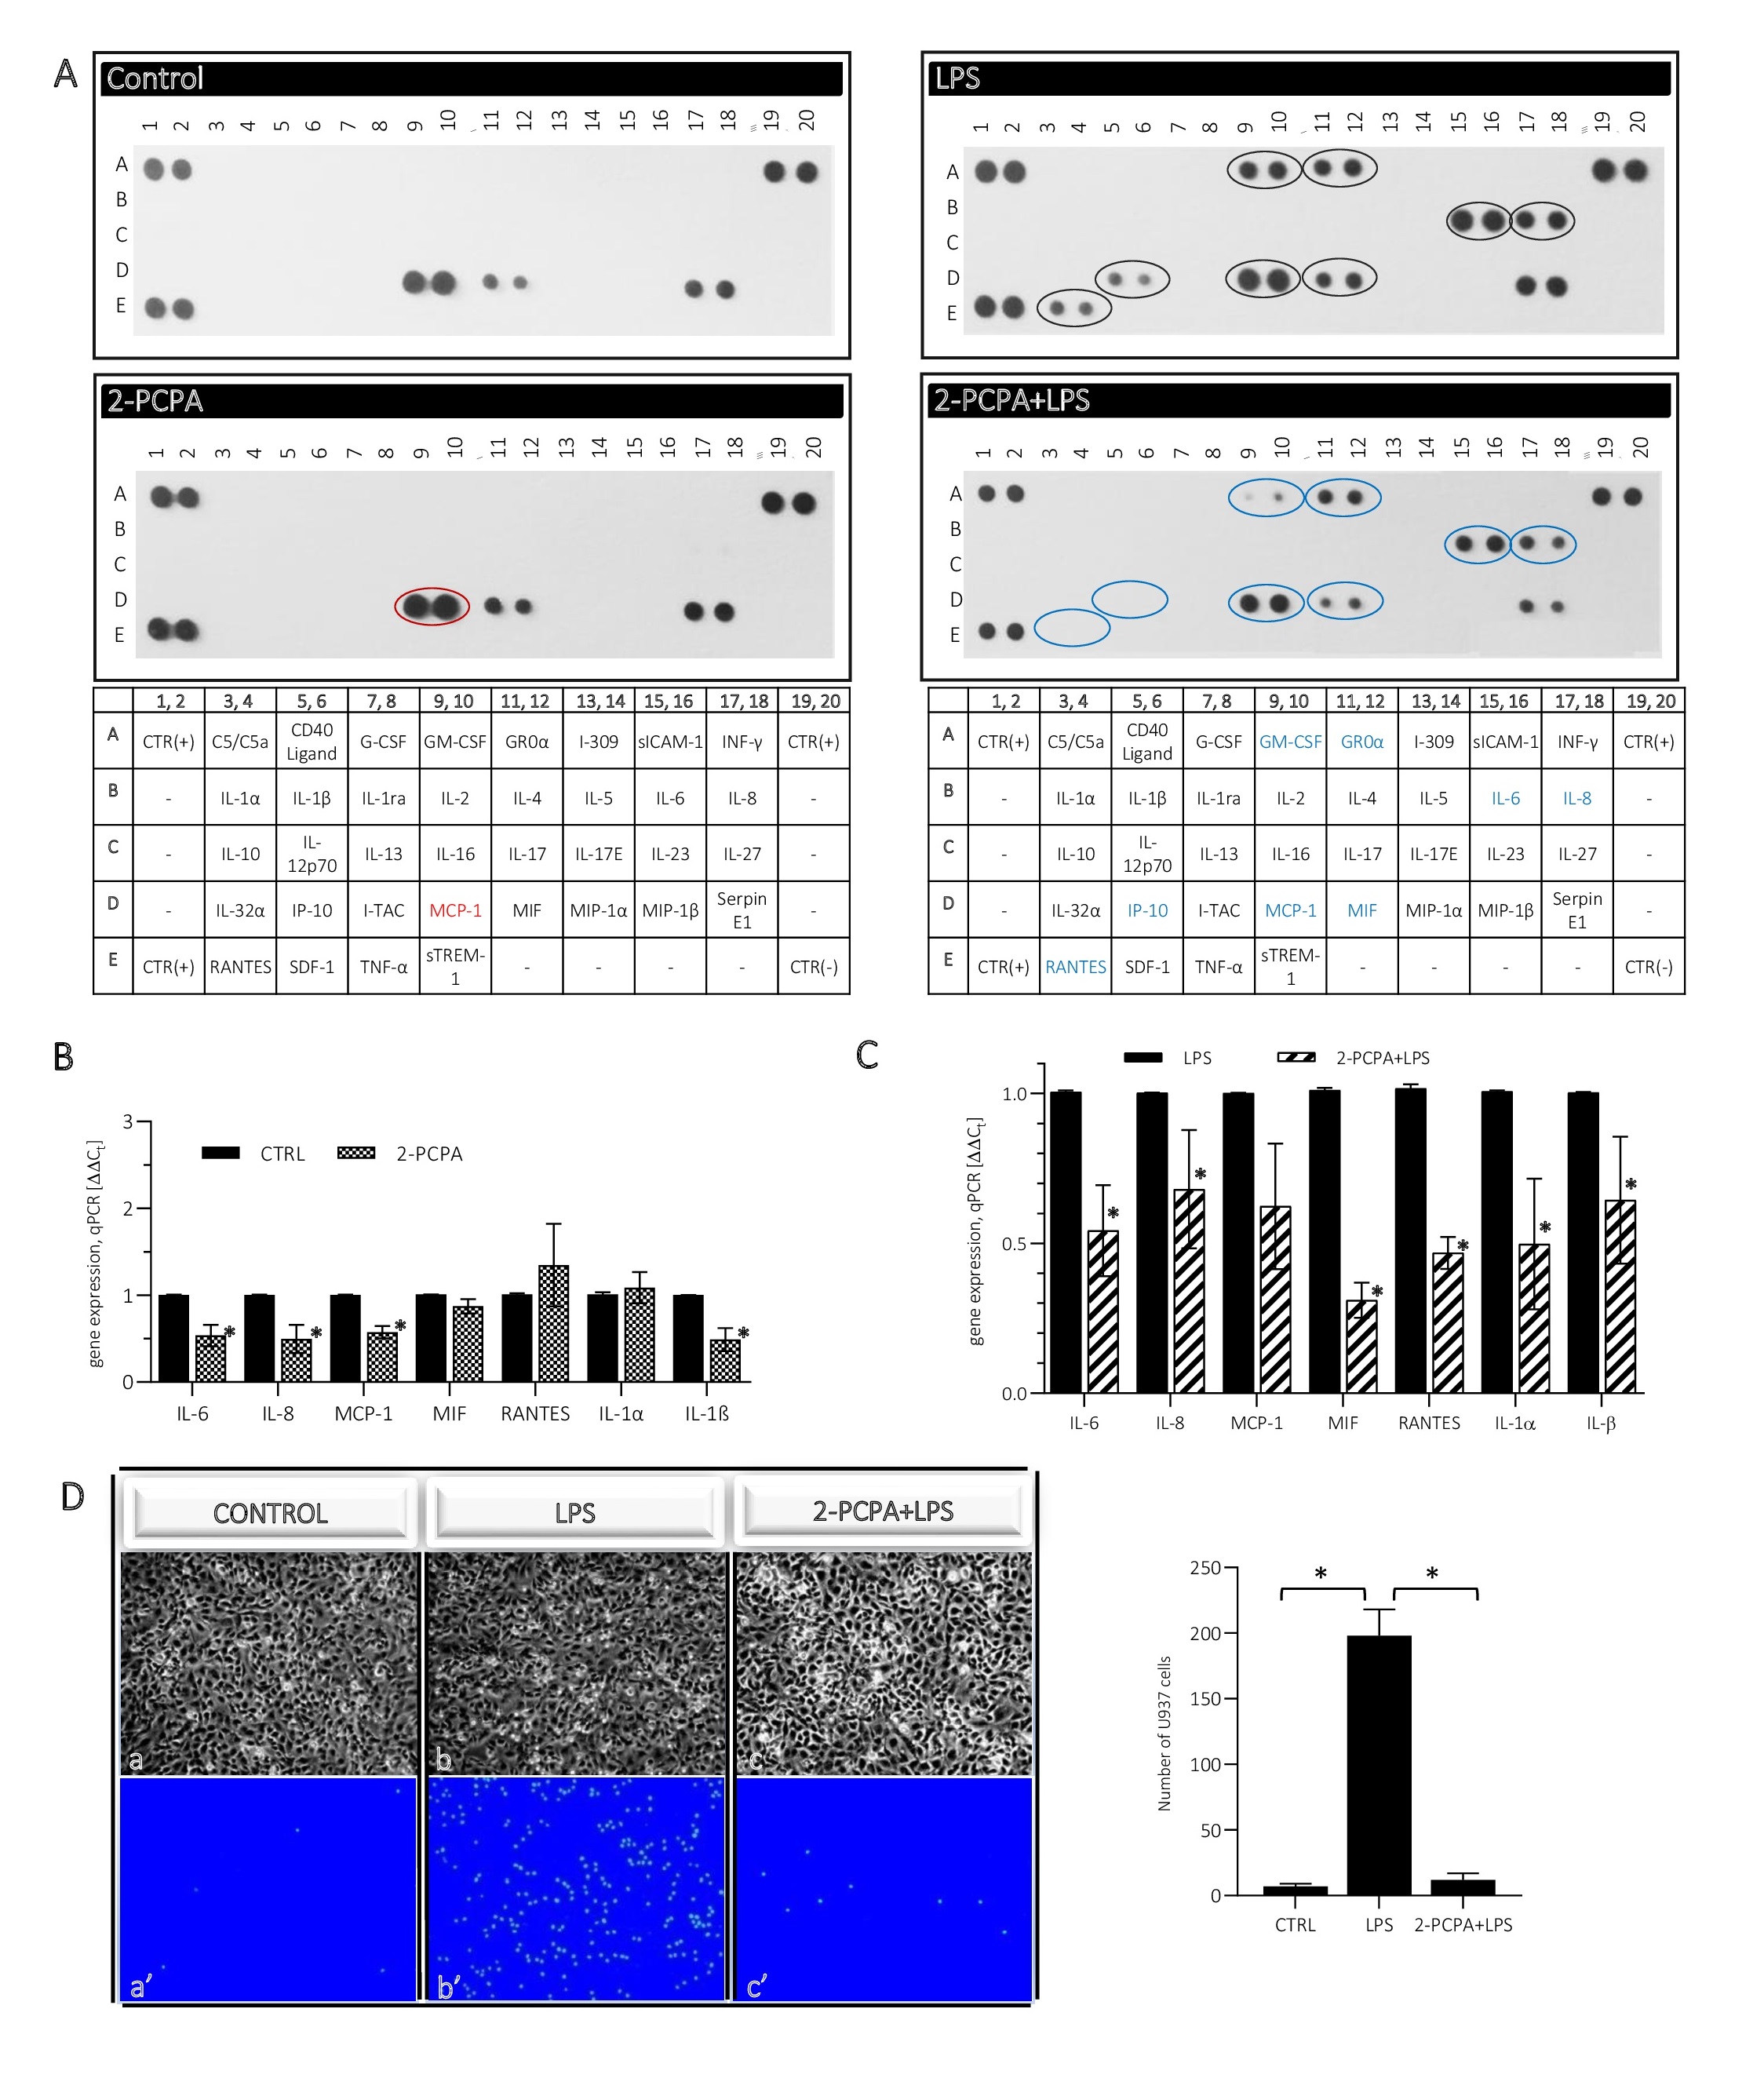
was studied at several levels: (i) release of inflammatory mediators to the cell culture medium, and (ii) analysis their expression level, but also by (iii) checking the recruitment of lymphocytes to activated ECs. We found that 2 h pre-treatment of ECs by 100 µM 2-PCPA followed by 4 h incubation with (100 ng/ml LPS causes a decrease in secretion of IL-6 and IL-8 in comparison to cells treated only by 4 h with LPS (Fig. 2A, right panel, blue rings). Moreover, we noted a significant decrease in MIF level that is involved in the innate immune response and stimulating the secretion of, inter alia, IL-6, IL-1β. In addition, we found reduced secretion of MCP-1 (CCL2), RANTES (CCL5) and IP-10 (CXCL10), the chemokines that are involved in the recruitment of leukocytes to the foci of inflammation (Fig. 2A).
The decreased response to the inflammatory factor in ECs with decreased LSD1 activity, was confirmed by analysis of the interactions between endothelial cells and monocytes (Fig. 2D). Microscope observations of Hoechst 33342-stained lymphocytes showed that U-937 monocytes recruited to the ECs stimulated for 4 h with 100 ng/ml LPS (Fig. 2D: b, b’), however, this effect was almost completely inhibited in the ECs pre-incubated for 2 h with 100 µM 2-PCPA (then the number of lymphocytes attached to the ECs oscillated at the level of control; Fig. 2D: a, a’; c, c’).
The immunodetection results have been successfully validated by qRT-PCR (Fig. 2C). Decreased expression of IL-6, IL-8, MCP-1, MIF and RANTES was found at the transcript level and also IL-1α and IL-1β, however was not identified in the dot-blot assay. At the same time we did not find any changes in the release of inflammatory mediators between control and cells stimulated for 6 h with 2-PCPA only (Fig. 2A, left panel), but at the mRNA level the inhibitor reduced the expression of cytokines: IL-6, IL-8, MCP-1 and IL-1β, other did not change (Fig. 2B).
Silencing of LSD1 suggests proinflammatory profile of activity of the enzyme in endothelial cells
Transcriptional silencing of LSD1 was performed by the lentiviral transduction of
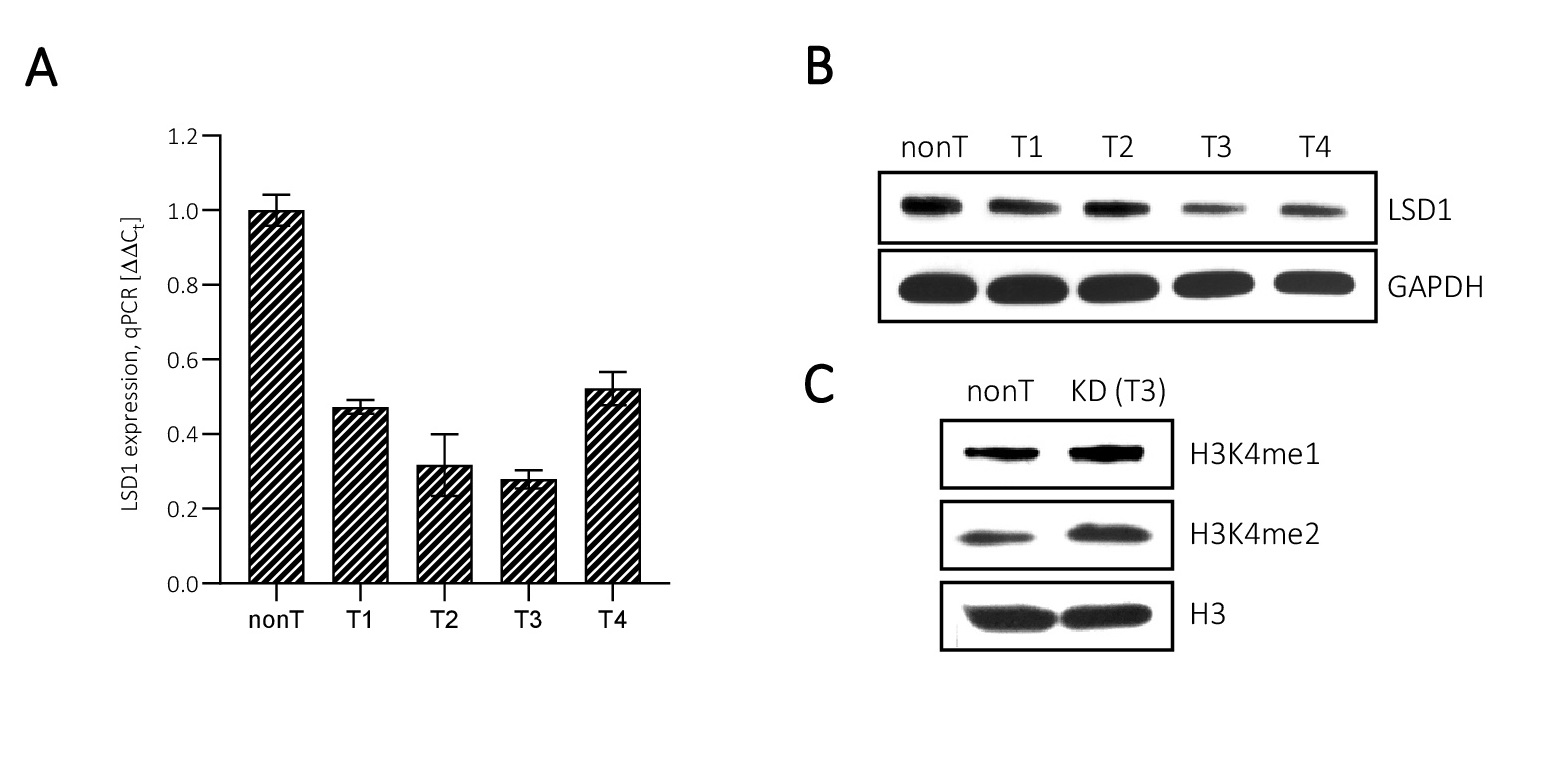
HMEC-1. We used several LSD1 shRNA sequences and for the further analysis clone #T3 was chosen that characterized the highest level of LSD1 downregulation, up to 30% of control, means LSD1 KD vs nonT (Fig. 3A). Changes in the expression of the targeted gene were analysed at the level of transcript, protein and also functionally, as we checked the level of methylation of LSD1 substrates: H3K4me1 and H3K4me2 (Fig. 3A, B, C).
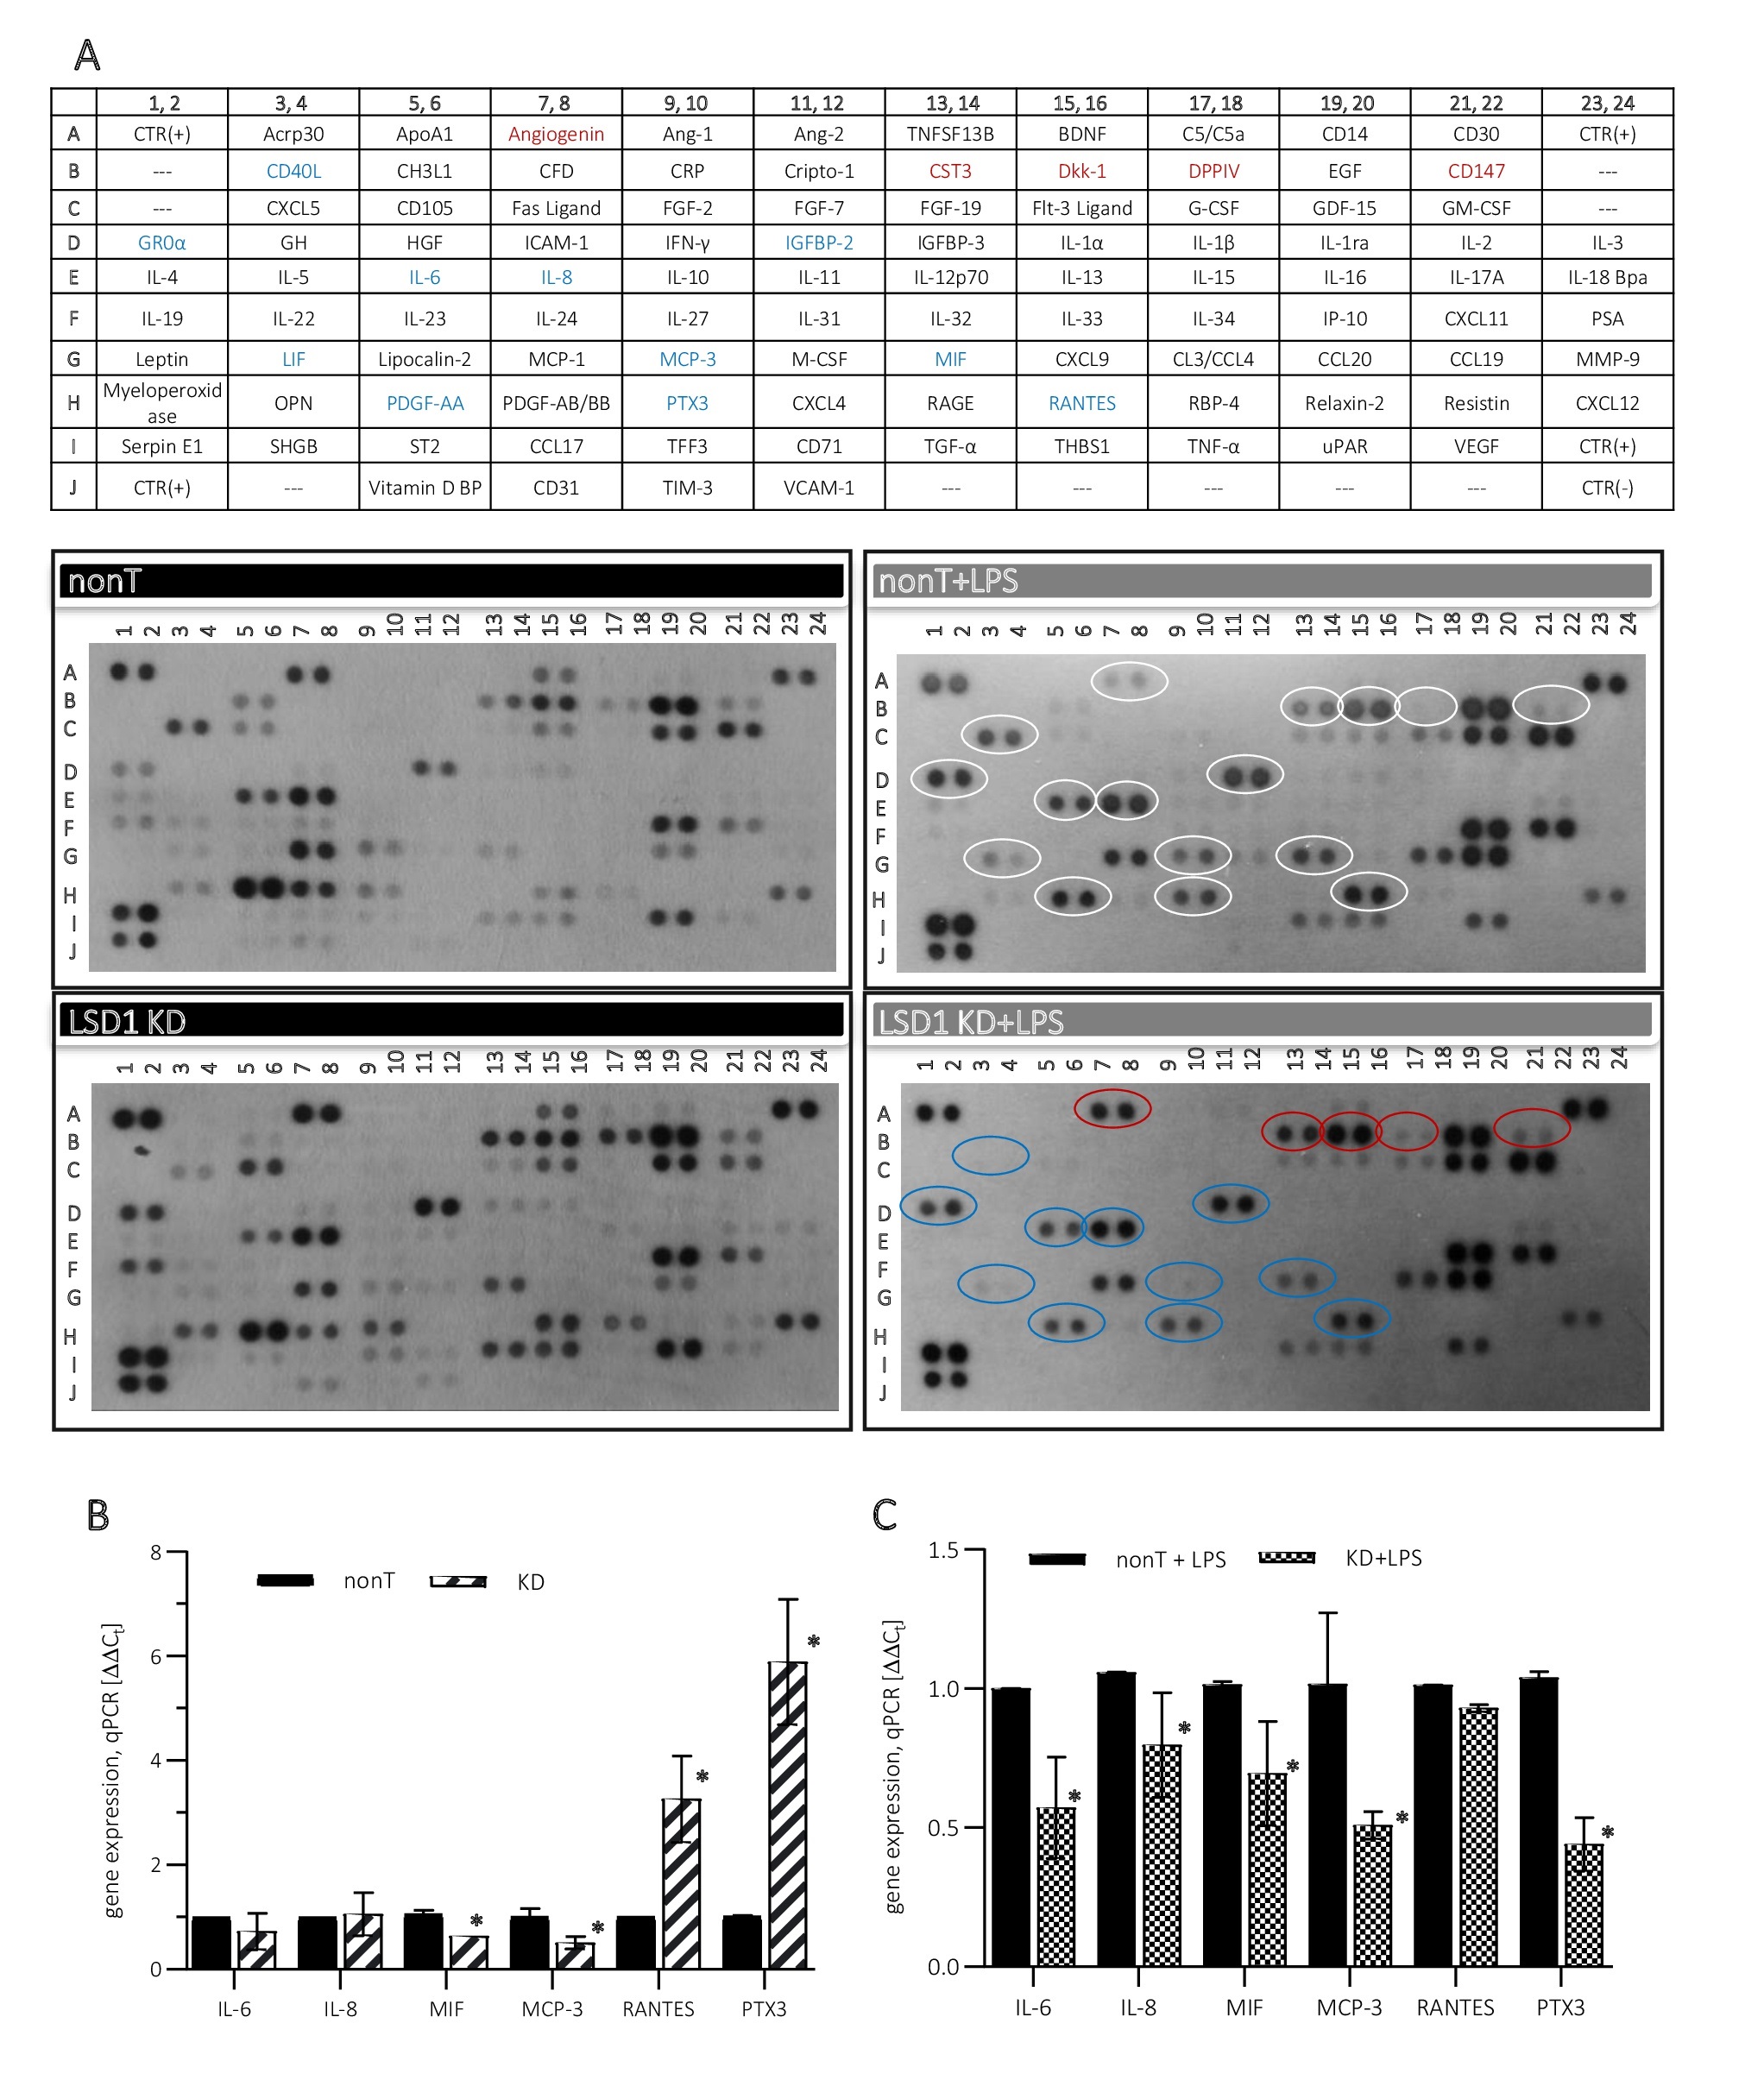
Proinflammatory properties of LSD1 that we observed in the pharmacological model of LSD1 inhibition (Fig. 2) we also confirmed on the transcriptional model of the demethylase silencing. Performing expanded dot-blot screening assay (Proteome Profiler Human XL Cytokine Array Kit) gave us more detailed overview into the involvement of LSD1 in the regulation of the inflammatory response in ECs. Looking at the release of cytokines from LPS-stimulated HMEC-1 LSD1 KD in comparison to HMEC-1 nonT, as IL-6, IL-8 or MIF (Fig. 4A right panel, blue rings; Fig. 4C), we found a coherent direction of changes with previous observations (Fig. 2). Moreover, enhanced release of other signalling molecules and chemotactic agents was observed from LPS-stimulated HMEC-1 LSD1 KD, e.g. MCP-3, LIF, CD40L, PTX3, PDGF-AA, IGFBP-2 (Fig. 4A right panel, blue rings). Changes identified in the secreted cytokines corresponded with their transcriptional level (Fig. 4C). At the same time, the immunoassay also showed increased extracellular amount of factors involved in regulation of capillaries formation and proliferation process, as angiogenin, CST3, Dkk-1, DPPIV, CD147 (Fig. 4A right panel, red rings).
As the immunoassay results show, the secretory profile of HMEC-1 that were transduced with lentiviral particles: nonT as well as LSD1 KD (Fig. 4A left panel) is different from cells that have not been exposed to viruses (Fig. 2A left panel). This dot blots analysis shows that viral transfection of cells induces inflammatory response, and is stronger in LSD1 KD than control cells (nonT), (Fig. 4A left panel). At the transcriptional level, the same as in case of HMEC-1 treated with 2-PCPA, downregulation of selected proinflammatory cytokines was found, i.e. MIF, MCP-3 (Fig. 4B), the other, as IL-6 and IL-8 were not affected by the LSD1 silencing. On the other hand, upregulation of RANTES and PTX3 has been detected, the molecules indicated in the literature also as the biomarkers of vascular inflammation, (Fig. 4B), however, both molecules were downregulated in response to LPS treatment (Fig. 4C).
Transcriptional consequences of LSD1 gene expression silencing
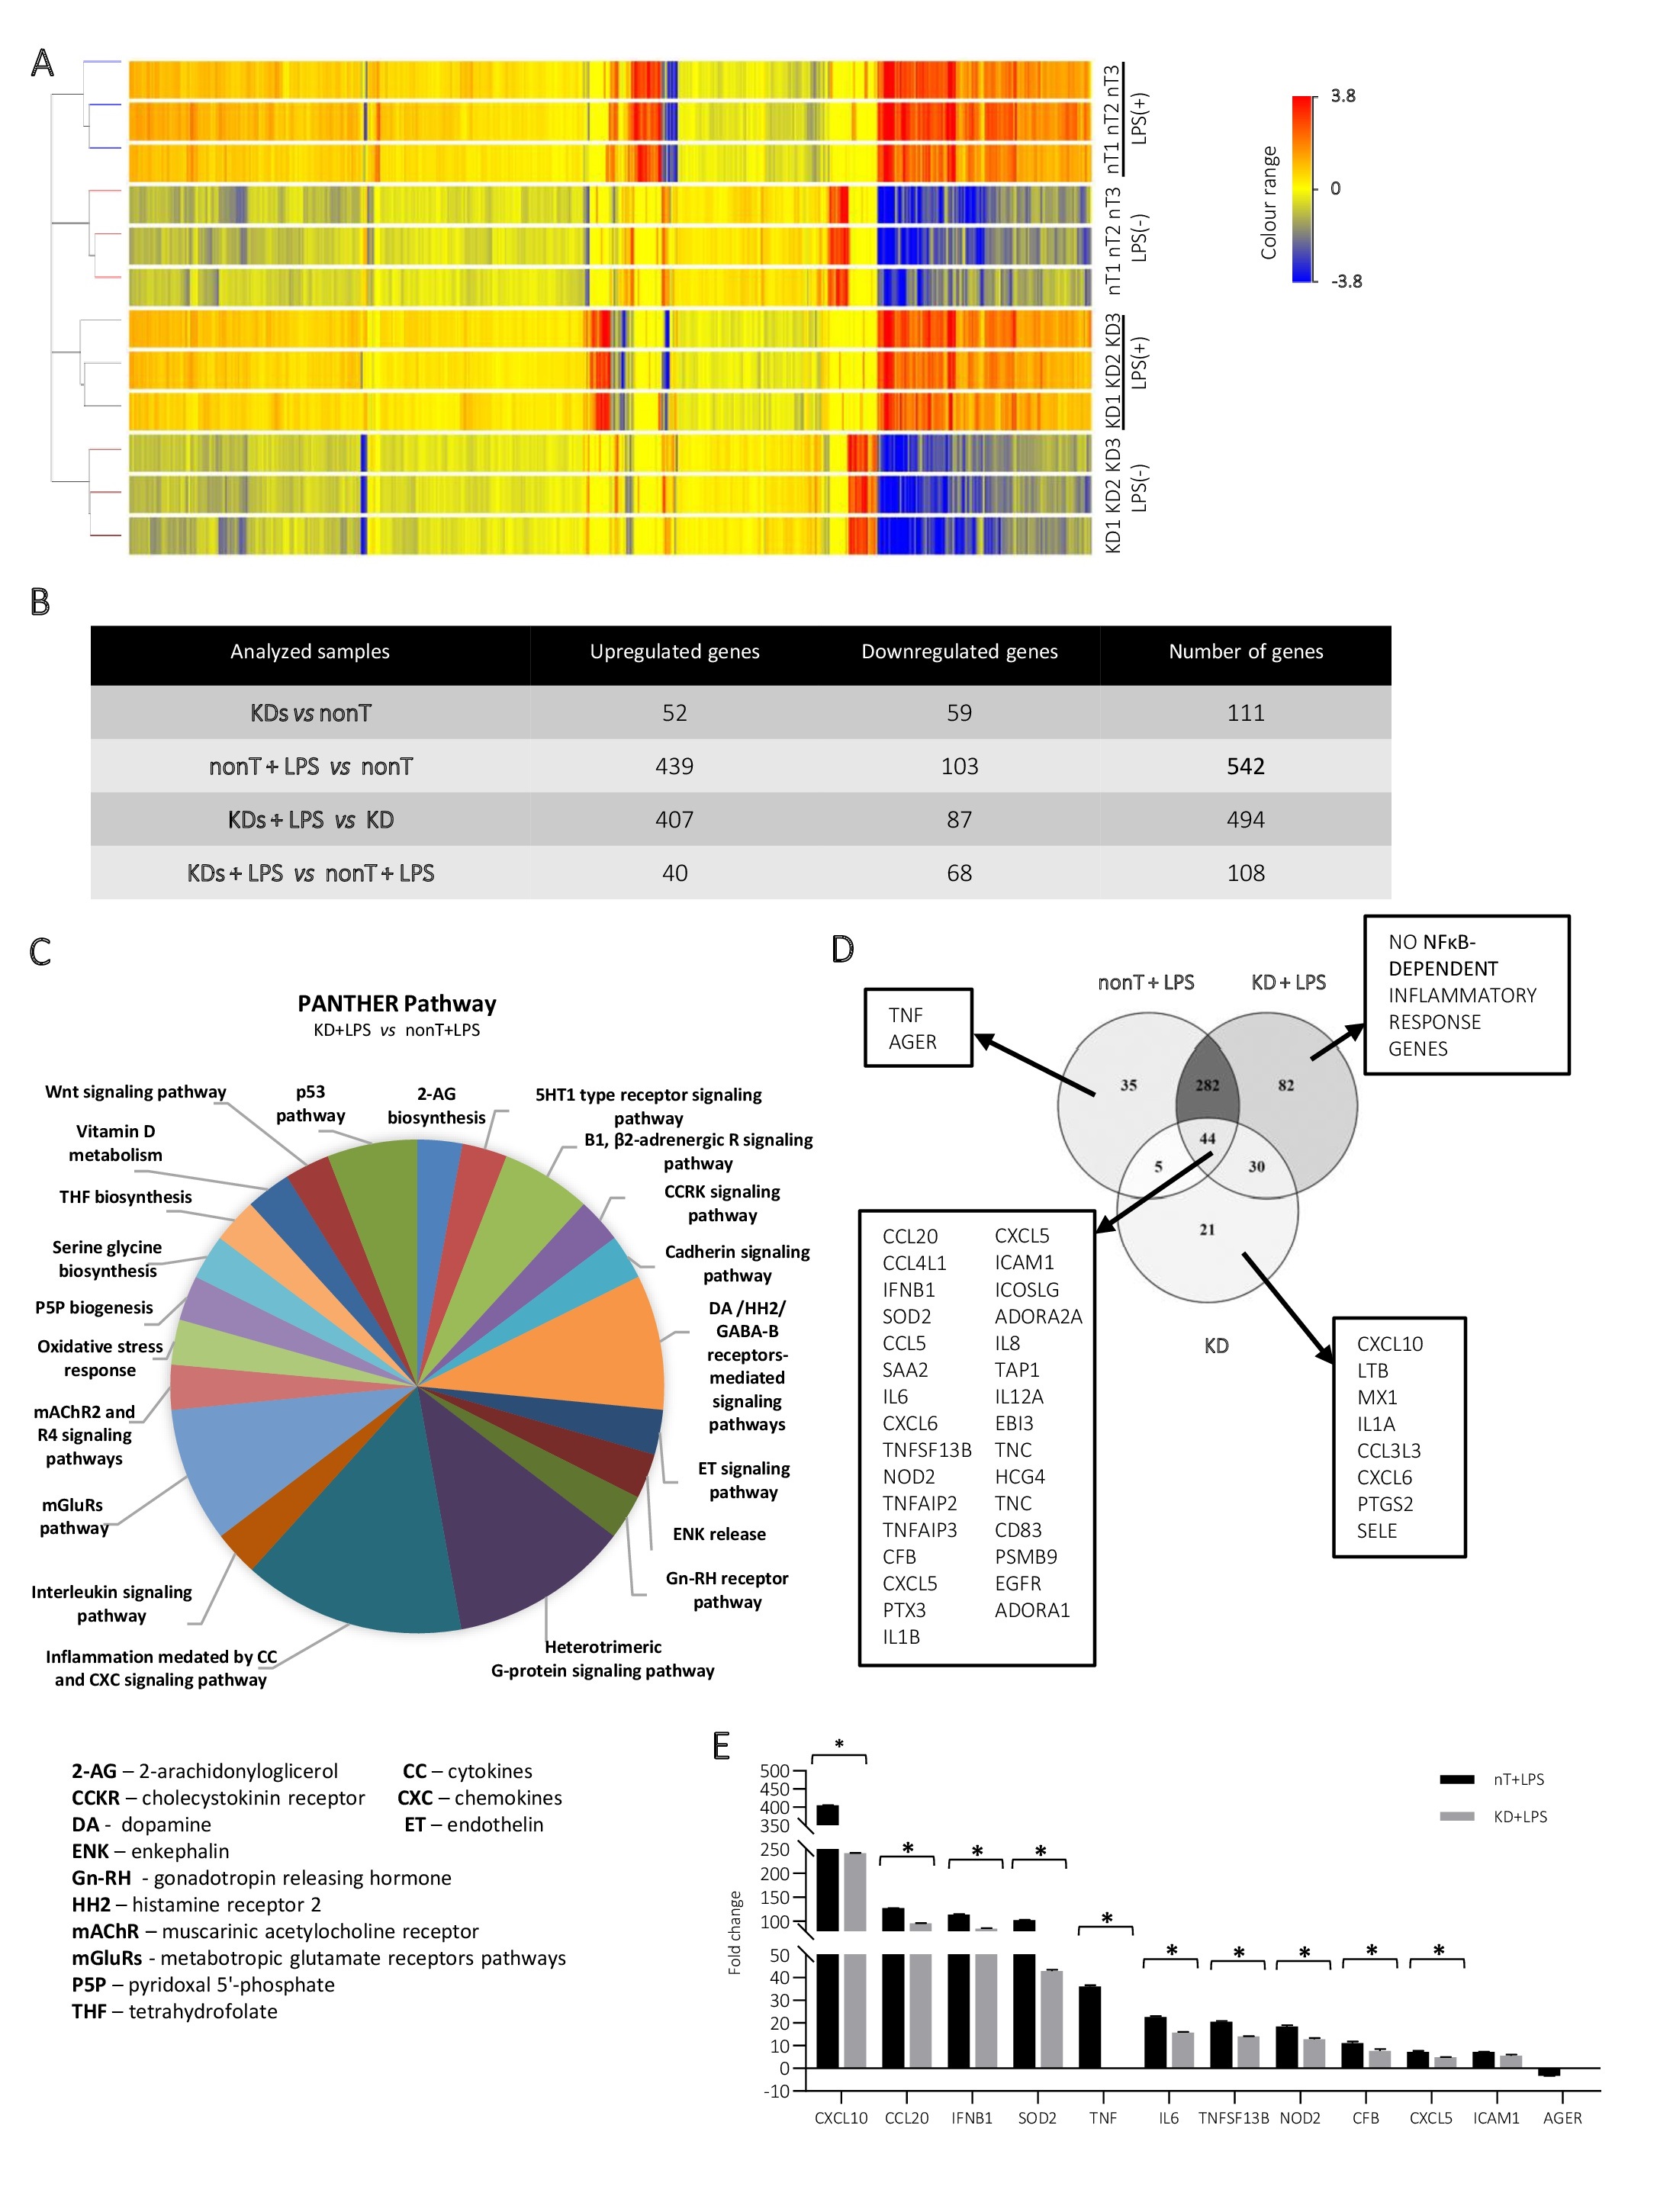
The prepared LSD1 knockdown cells were analysed at the transcript level. Performed RNA microarray analysis of the nonT/LSD1 KD HMEC-1 by using GeneSpring GX (v. 14.5) gave us an opportunity to look more broadly at the role of LSD1 in regulation of endothelial cell metabolism (Fig. 5). Given the fold change of 1.5 and -1.5 (Fig. 5A), we distinguished 111 genes, which expression shifted due to LSD1 silencing, including 52 genes upregulated genes (FC>1.5) and 59 downregulated genes (FC<-1.5) (Fig. 5B). PANTHER software (v. 16.0) analysis showed that the altered genes are involved in multiple biological/metabolic processes, including pathways: (i) directly related to immune reactions (inflammation CC/CXC-mediated reactions, interleukin signalling pathway, oxidative stress response, endothelin signalling pathway), (ii) indirectly related to immune reactions (heterotrimeric G-protein signaling pathway, PLP biogenesis, THF/serine glycine biosynthesis, 2-AG biosynthesis) and others as transducer activity (mAChR2 and R4 signaling pathways, mGluRs pathway, Β1, β2-adrenergic receptors signaling pathway) (Fig. 5C). According to our expectations stimulation of cells with 100 ng/ml LPS resulted in stronger response given by nonT in comparison to the LSD1 KD (Fig. 5B), 542 vs 494; respectively. Analysis of more than 10,000 genes revealed further inflammatory profile genes, previously not seen in other tests, which expression decreased by more than 20% in LSD1 knockdown cells due to LPS treatment, i.a. CXCL10, CCL20, IFNB1, SOD2. Grouping of gene lists after cleavage of FC>1.5 presented in Venn Diagram (Fig. 5D) showed that after silencing of the LSD1 due to LPS stimulation, no additional NF-κB-dependent proinflammatory genes are expressed which is in accordance with our previous findings.
Changes in the LSD1 expression and activity alters the classical activation of the NF-κB pathway
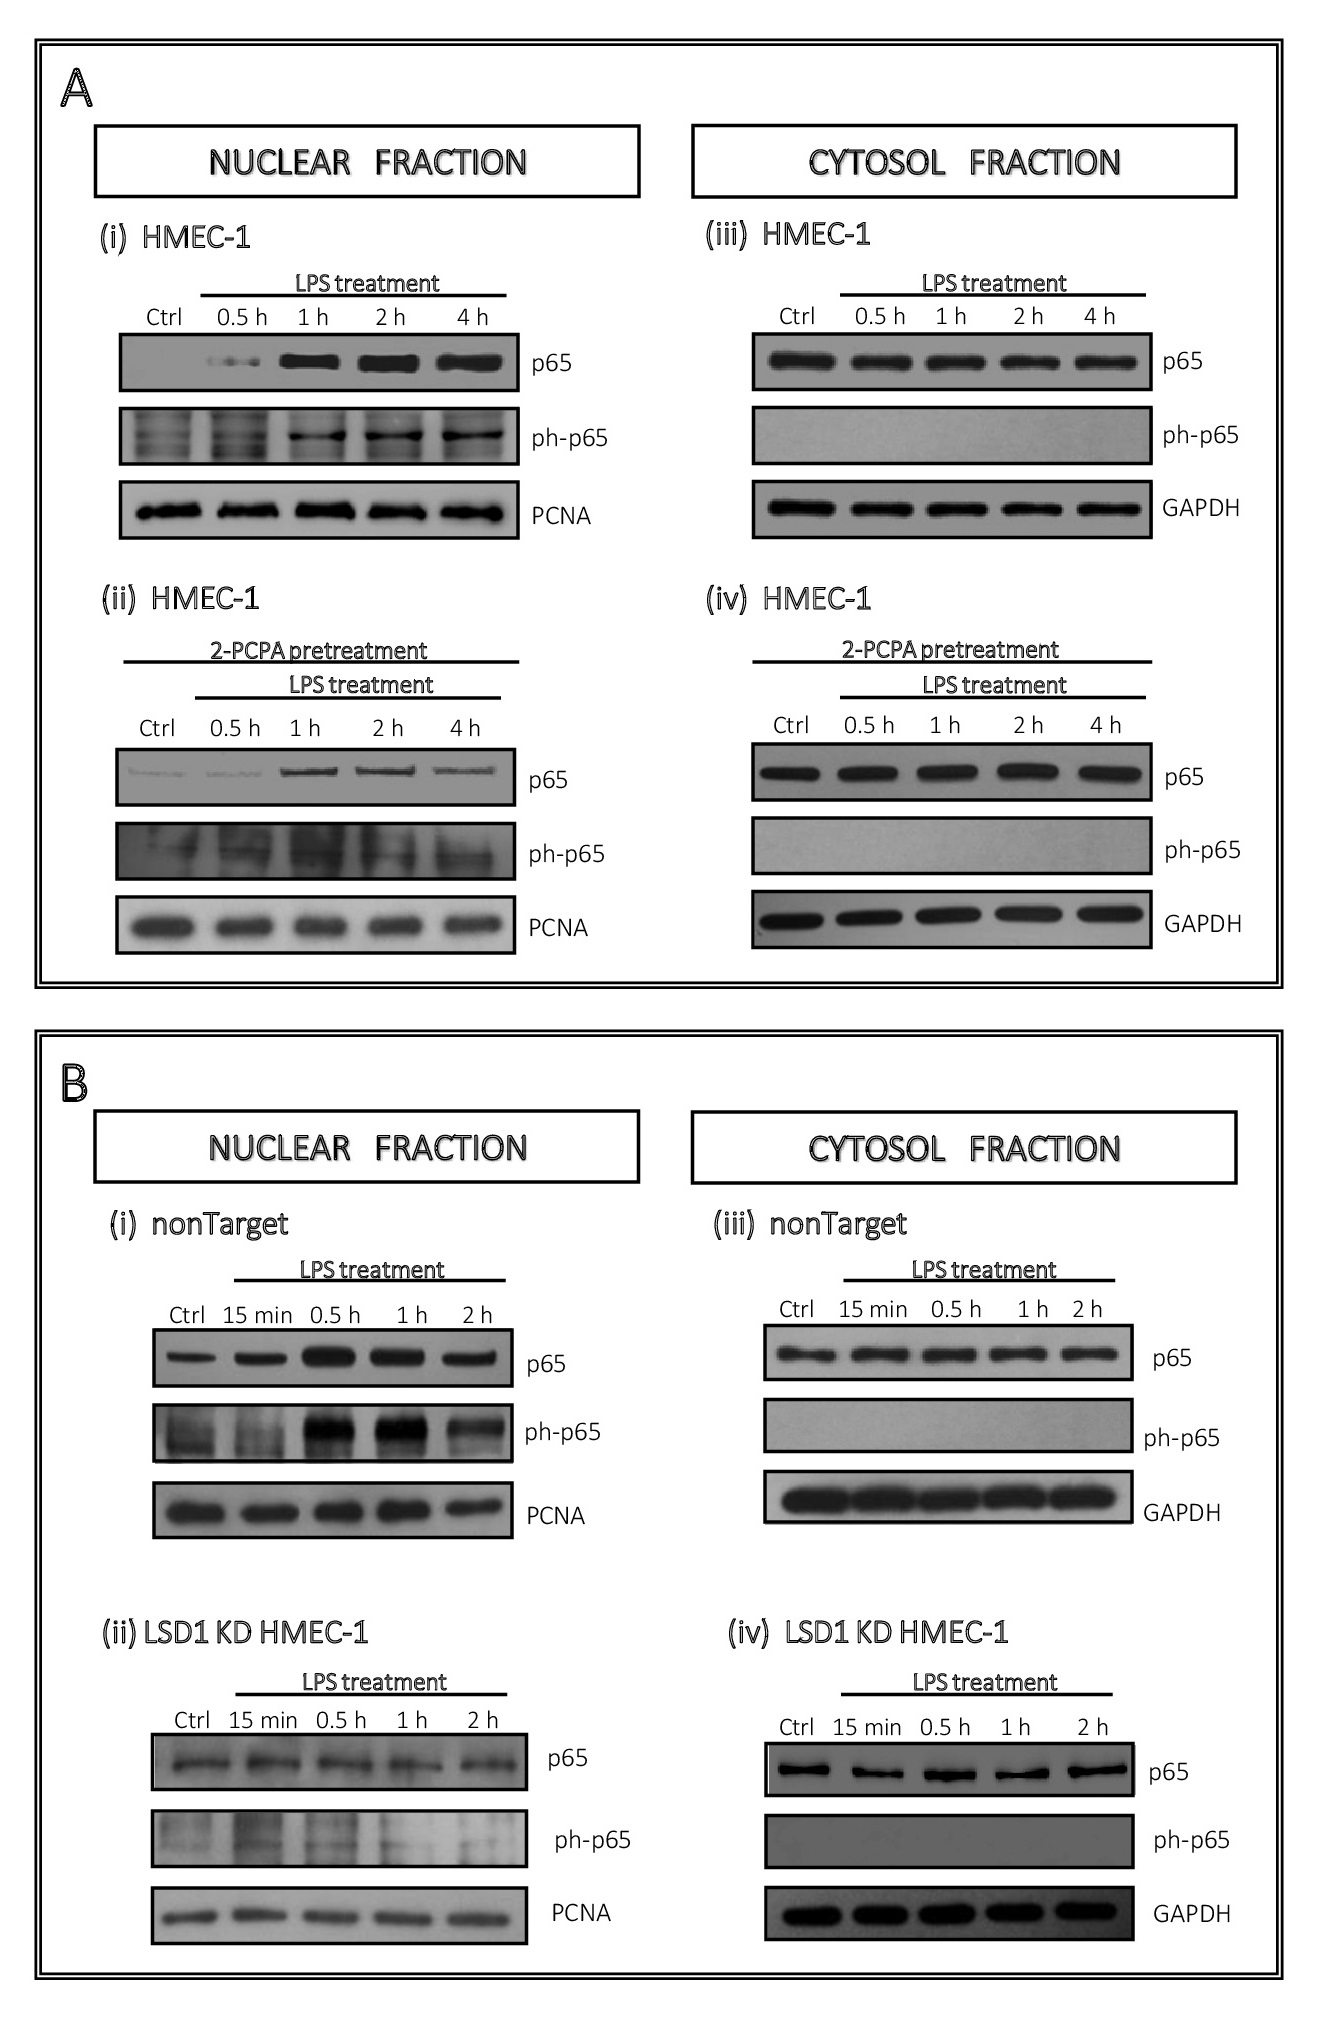
Based on the identified changes in the response of LSD1-deficient HMEC-1 to the inflammatory stimuli, we analysed the effect of demethylase downregulation on NF-κB activation, known as responding to endotoxins. To this end, we evaluated the level of total p65 and its phosphorylated form at the position of transactivation domain, Ser-536, associated with nuclear localization and transcriptional activity. Using both pharmacological and transcriptional model we monitored administration of the protein to the nucleus by
(i) Western blotting as well as (ii) immunofluorescence staining.
Using nuclear and cytosol protein fractions we found that treatment of endothelial cells with LPS results in an increase of active and total p65 in the nucleus within the first hour and remains constant at a high level for the next 3 hours (6Ai). Similar data we obtained on the transcriptional model (control cells, i.e. nonTarget), and the biggest changes were observed within first hour of cells treatment with endotoxin (Fig. 6Bi). Inhibition of LSD1 by 100 µM 2-PCPA resulted in significant reduction in the p65 translocation into the nucleus, which in case of ph-p65 was maintained at the level of control (Fig. 6Aii). At the same time, no change in the p65 level was noted in the cytosol, at any time point (although 10 µg of cytosolic extract was used for WB) (Fig. 6Aiv). Translocation of ph-p65 to the nucleus in the LSD1 KD (Fig. 6Bii), corresponded to the inhibitor treatment model, however the changes were not as significant (Fig. 6Bii).
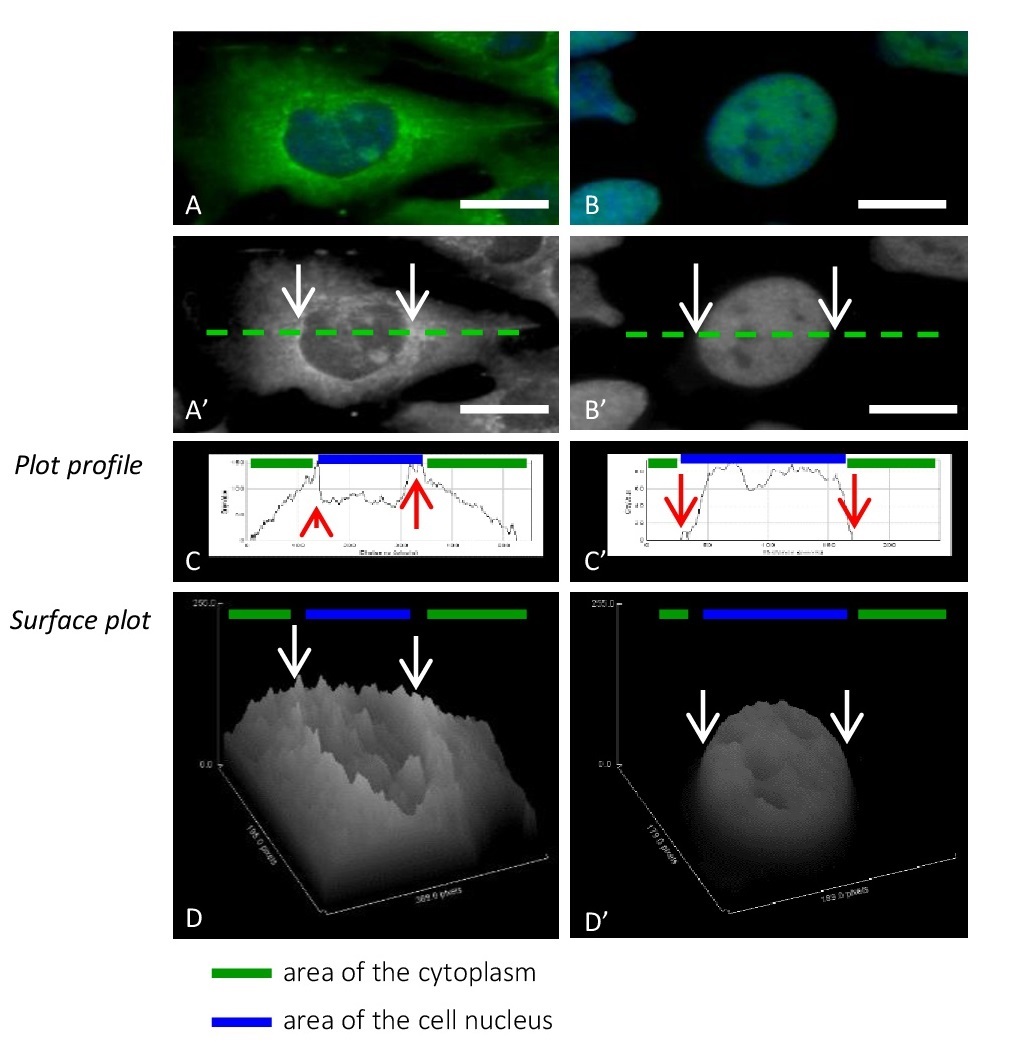
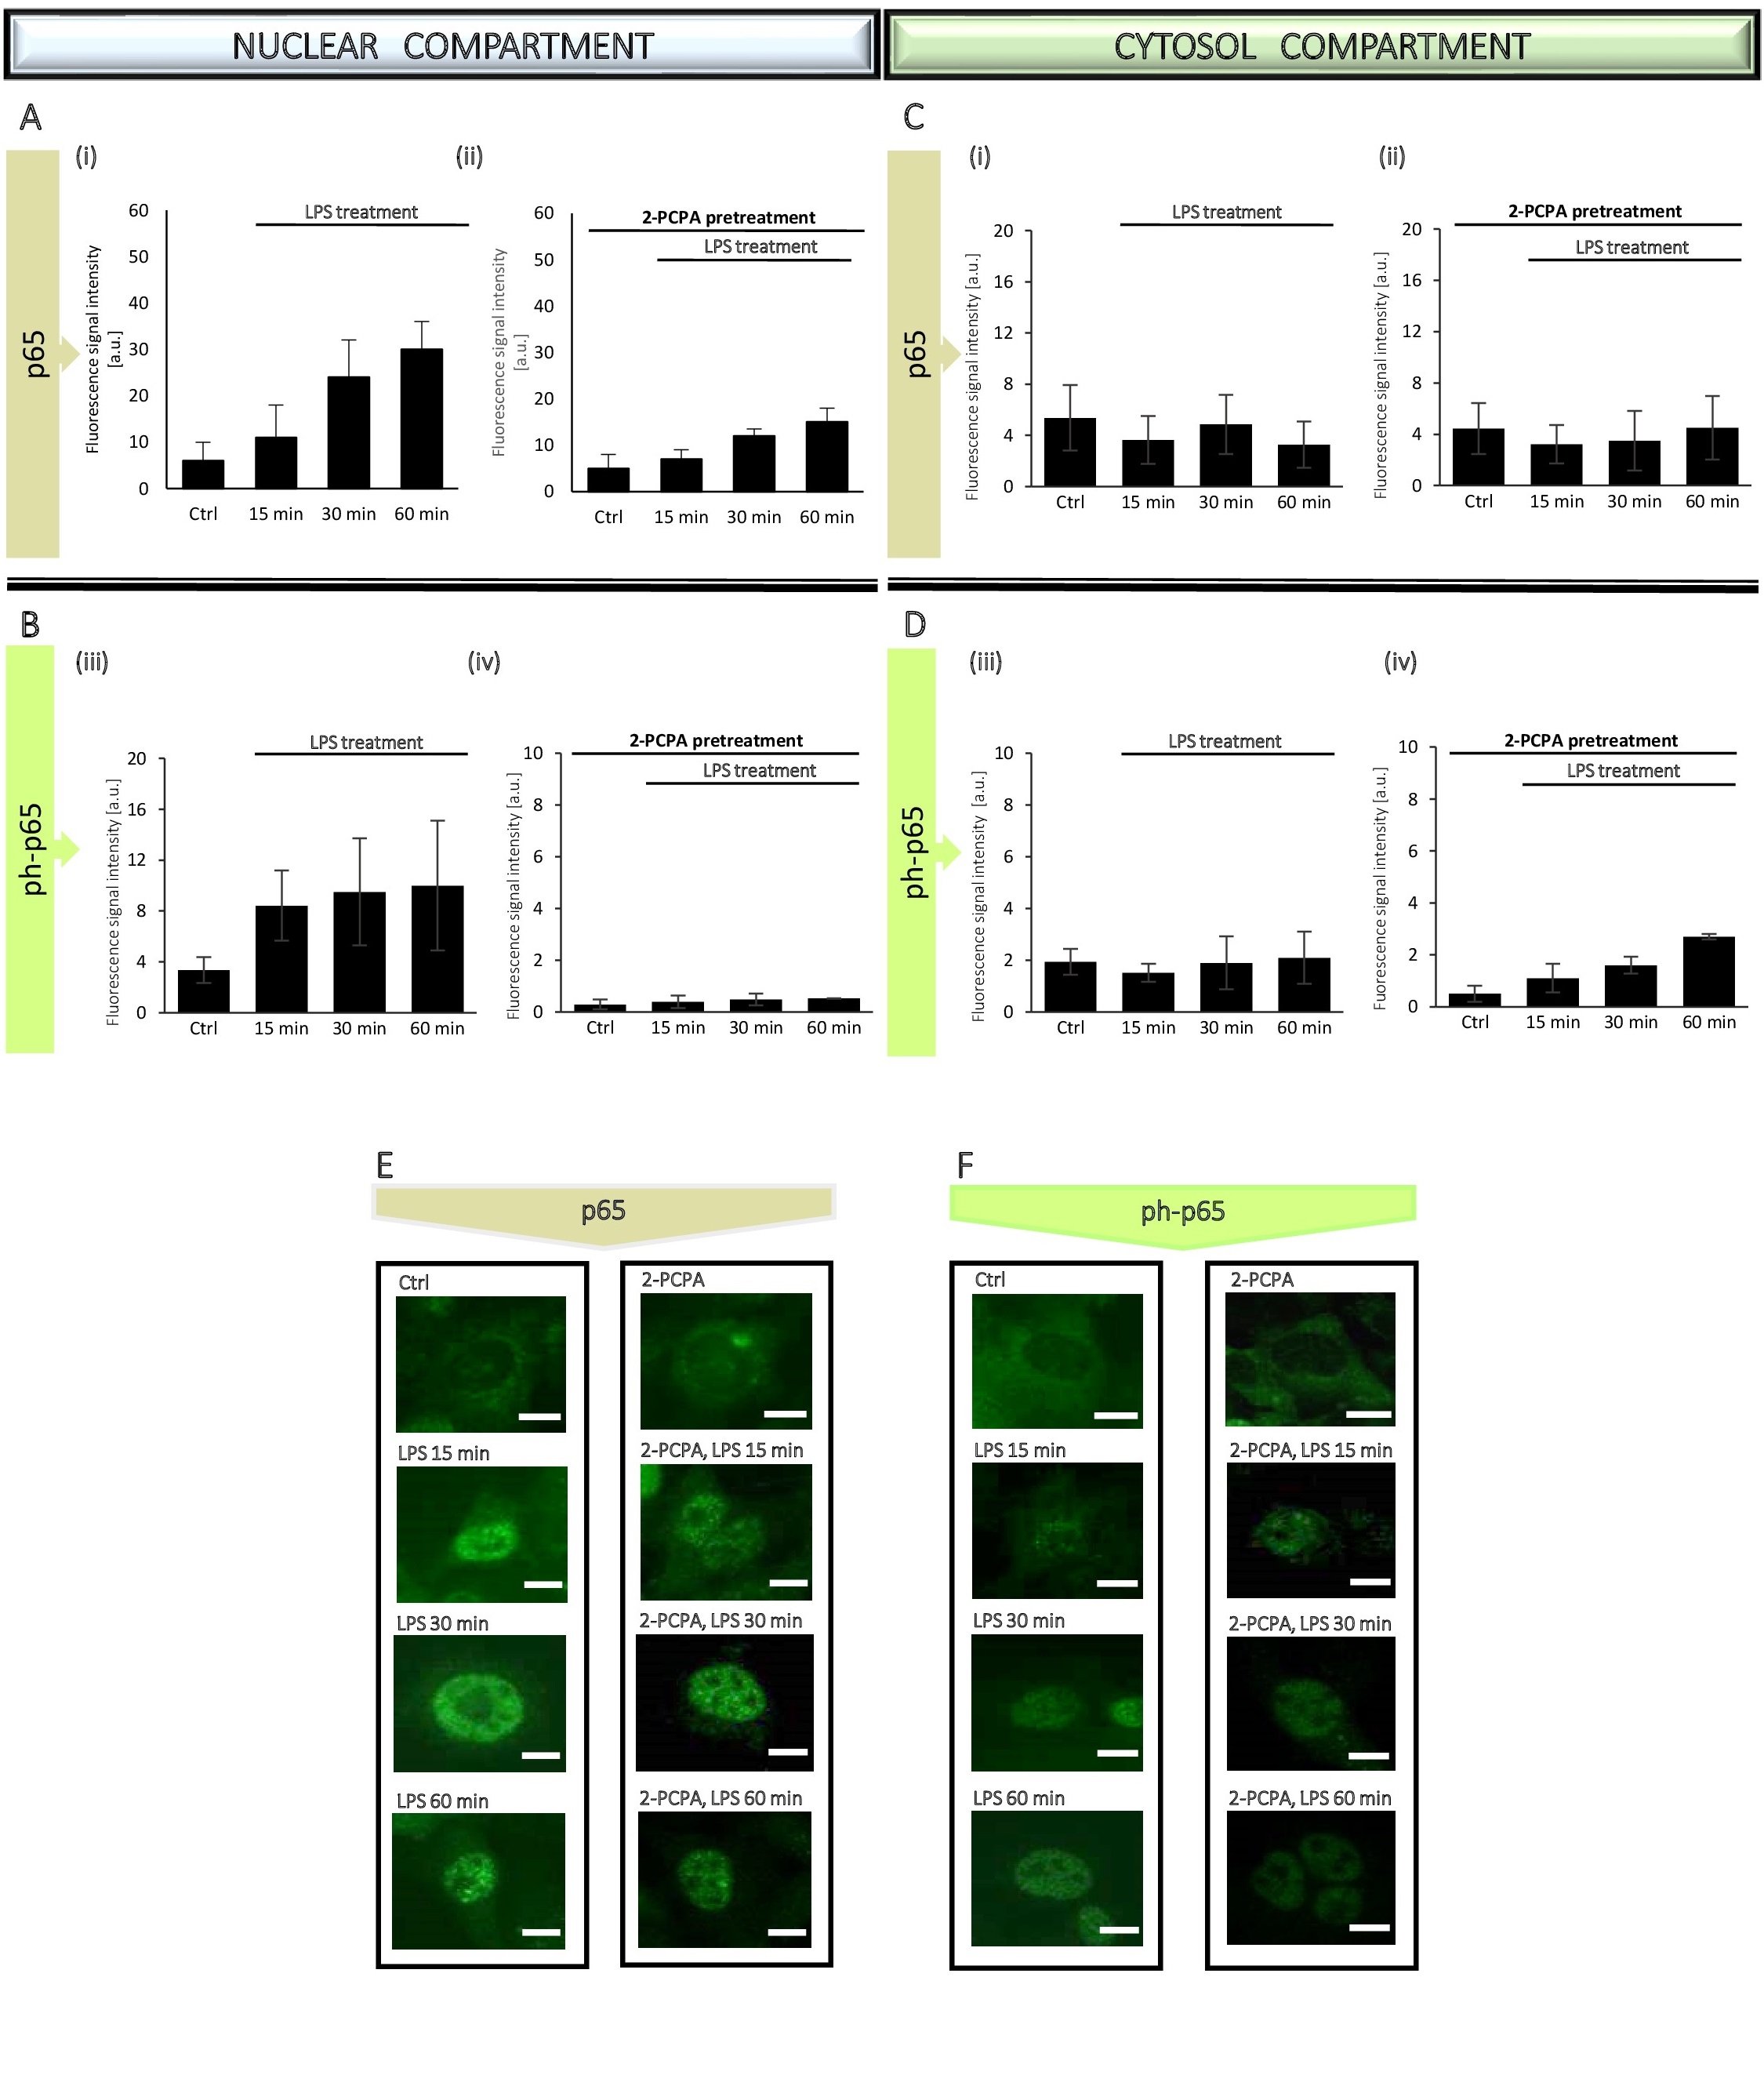
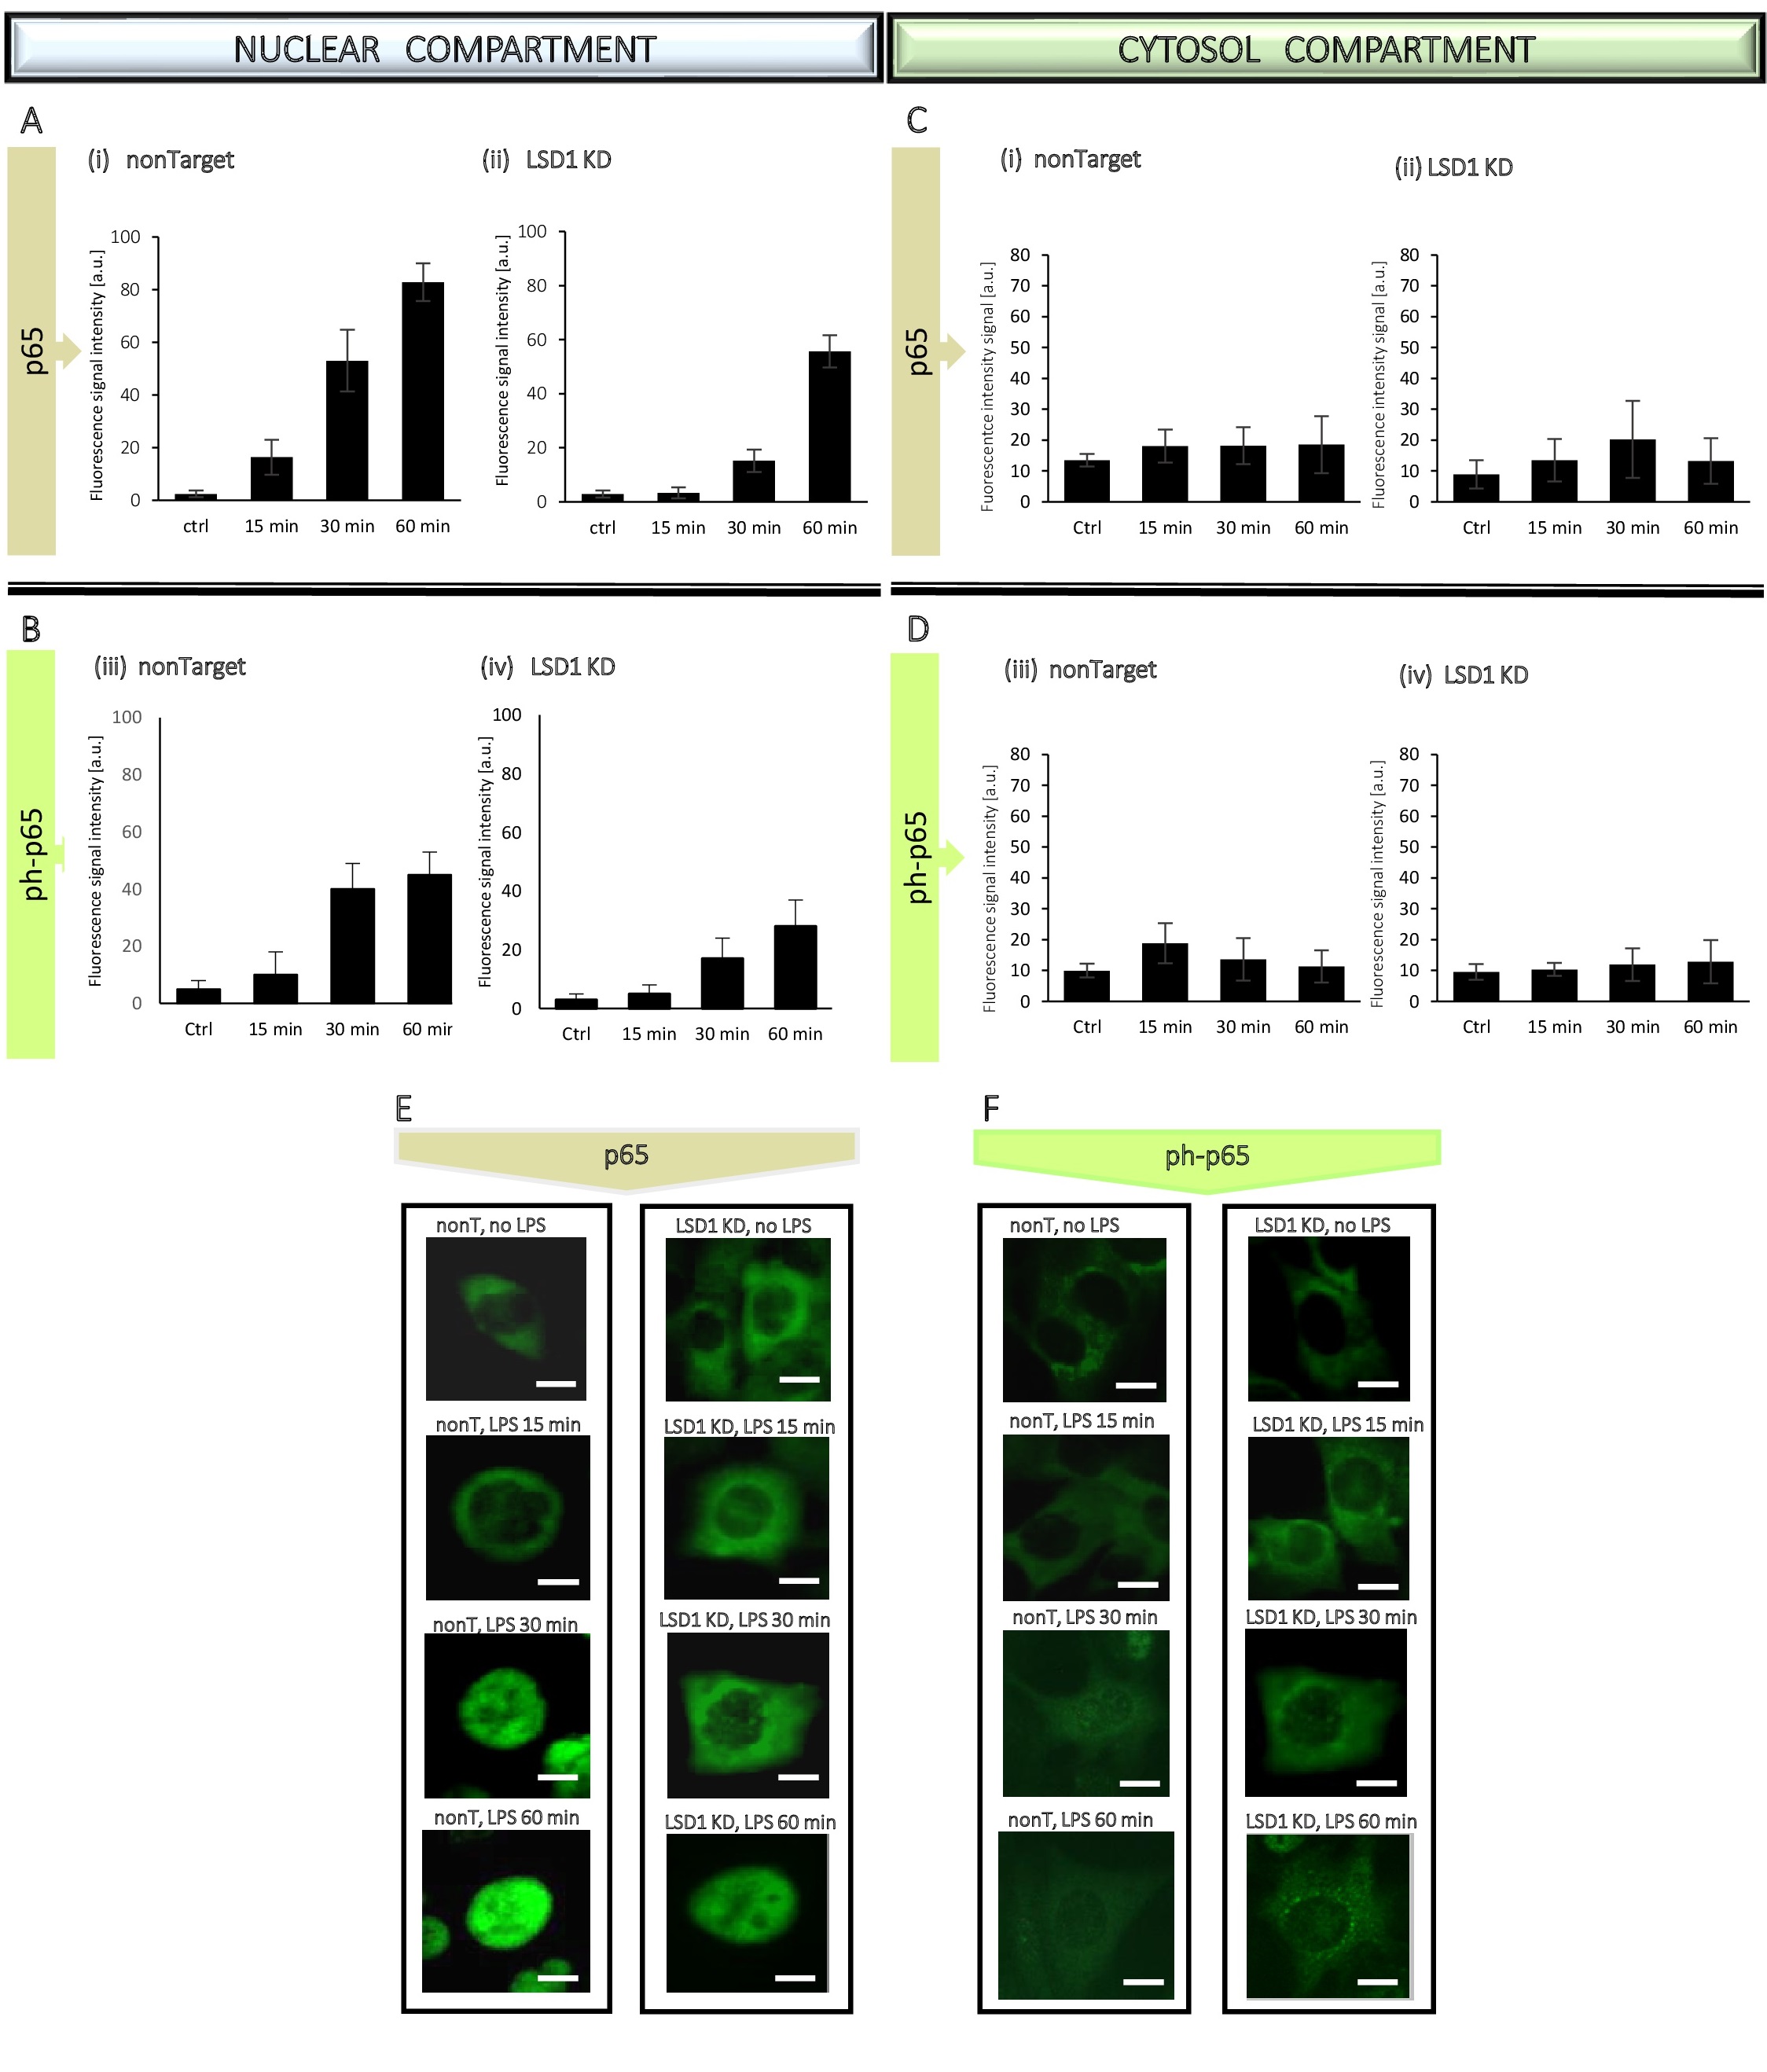
Based on the WB results, to better observe the dynamics of changes in p65 translocation, we narrowed the time to an hour only for the immunocytochemical tests (Fig. 7, Fig. 8, Fig. 9). The administration of p65 was imaged (Fig. 8E, 8F and Fig. 9E, 9F), followed by measurement of fluorescence signal intensity from the antigens by using ImageJ software. The analysis based on generation of the linear height maps reflecting to the activity of the p65 (Fig. 7C, 7C’).
The obtained data confirmed our previous findings from WB experiments, means lack of statistically significant changes in the p65 level and its phosphorylated form in the cytosol (Fig. 8C and Fig. 9C), whereas an increase of both, p65 total and ph-p65 level in the nuclear compartment due to LPS treatment, attenuated by inhibition/silencing of LSD1 (Fig. 8A, 8B and Fig. 9A, 9B).
To sum up, in response to the inflammatory factor in the endothelial cells nuclear recruitment of the NF-κB transcription factor occurs without significant loss in the cytosolic protein pool and LSD1 supports this process. However, pharmacological inhibition of LSD1 involving 2-PCPA had a stronger effect on the attenuation of the inflammatory response than LSD1 transcriptional inhibition, which was manifested by a significant reduction in proinflammatory cytokine expression due to the strong inhibition of NF-κB-p65 transcription factor transport from cytoplasm to the nucleus where it exhibits its transcriptional activity.
LSD1 alters inflammatory response of ECs but does not interact directly with NF-κB-p65
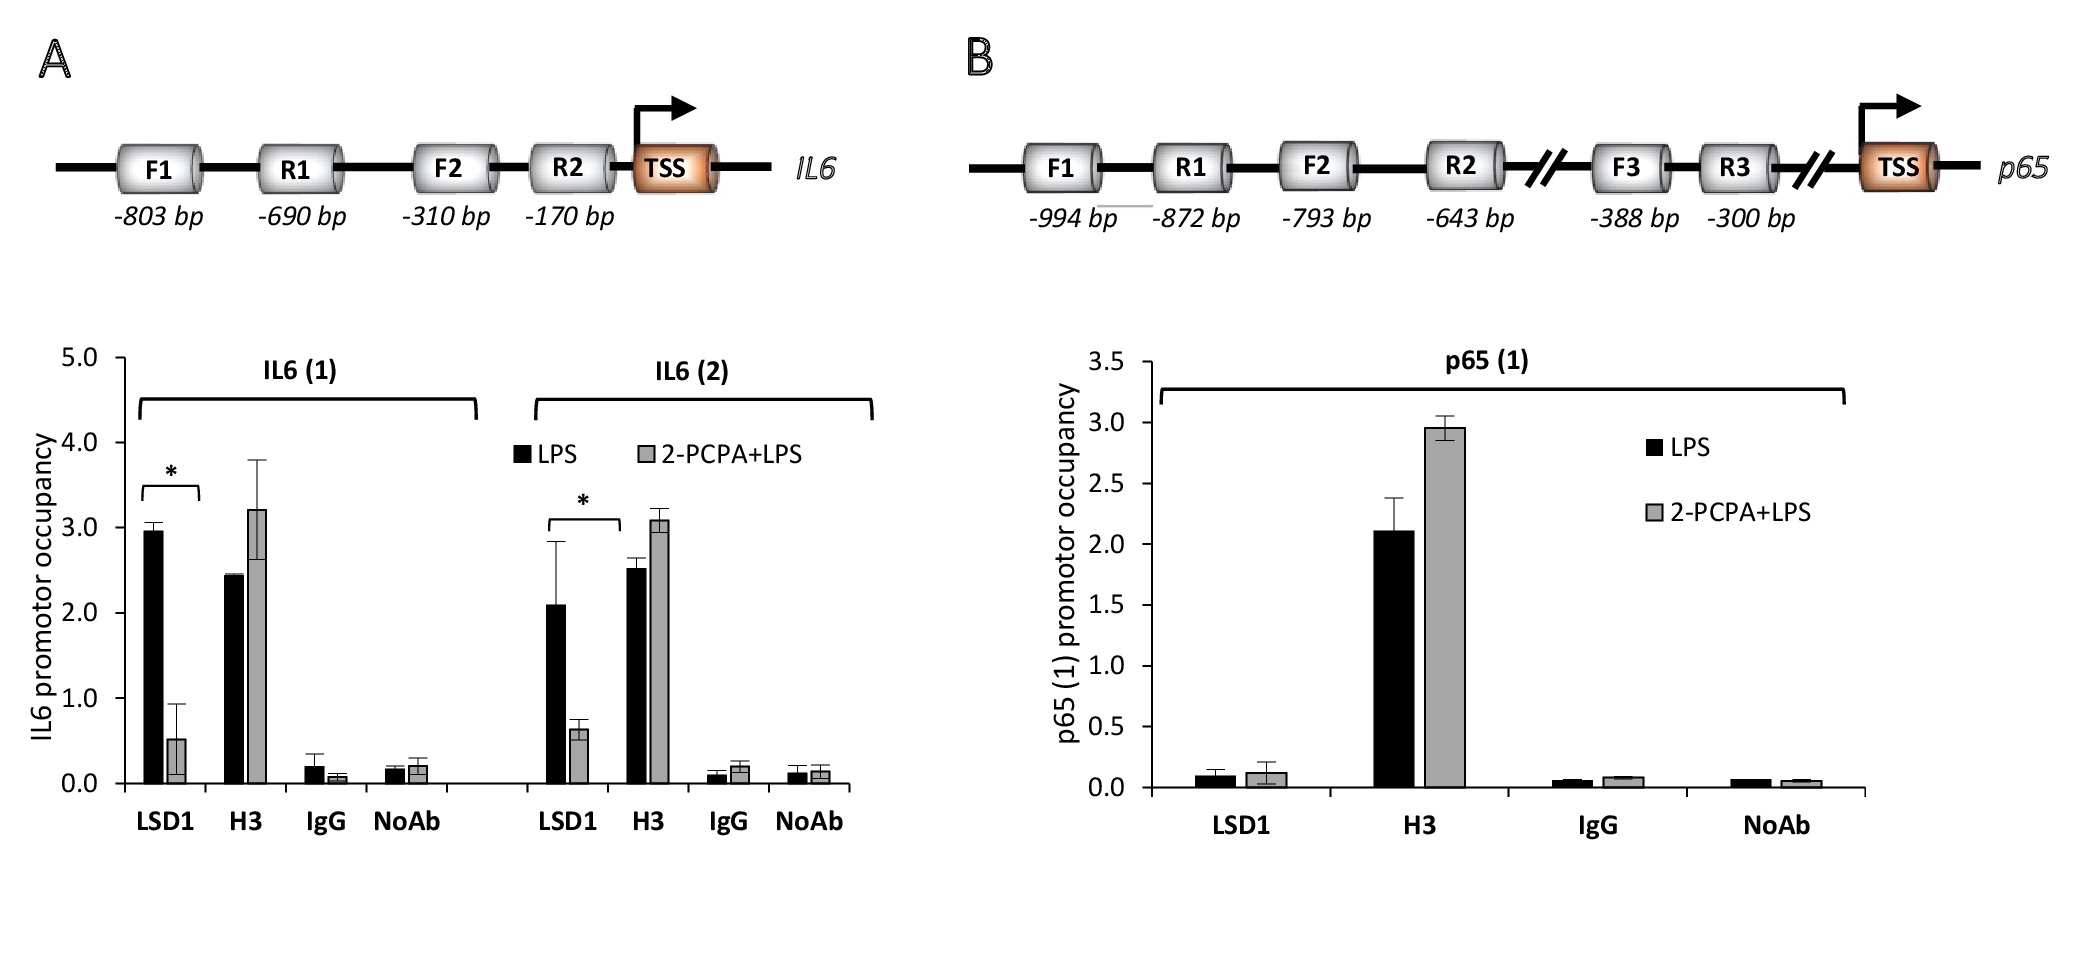
Based on the identified differences in administration of p65 and its phosphorylated form due to altered lysine specific demethylase 1 activity (Fig. 6, 8, 9), we analysed the direct interaction of the demethylase with NF-κB-p65 using chromatin immunoprecipitation assay (ChIP). We found that LPS increases LSD1 association with the IL-6 promoter, in both analysed promotor regions (Fig. 10A) and that 2-PCPA abolishes this effect. Although these data are in line with gene expression profile of IL-6 in the tested experimental conditions (Fig. 2B) and IL-6 is downstream NF-κB-p65 signalling pathway, we did not find direct interaction between LSD1 and NF-κB-p65 promoter (Fig. 10B). LSD1 binding to the NF-κB-p65 promoter region: -994 bp to -872 bp occurred unspecific as comparable to the IgG control and NoAb control. In other two analysed regions: -793 bp to -643 bp and -388 bp to -300 bp, apart from the H3 positive control, we did not get any amplification products indicative of LSD1 interaction with the NF-κB-p65 promoter.
Abbreviations
2-PCPA ((1R,2S)-rel-2-phenyl-cyclopropanamine; trans-2-Phenylcyclopropylamine); DOX (doxycycline); ECs (endothelial cells); EGF (epidermal growth factor); HDM (histone demethylase); HMEC-1 (human microvascular endothelial cells-1); IP-10/CXCL10 (Interferon gamma-induced protein 10/C-X-C motif chemokine ligand 10); LSD1 (lysine-specific demethylase 1); MCP-1 (monocyte chemoattractant protein-1); MIF (macrophage migration inhibitory factor); PCNA (proliferating cell nuclear antigen); RANTES (regulated on activation normal T-cell expressed and secreted).
Author Contributions
MW, DR, EW, MSK, DS and AB participated in experimental work and preparing the presented version of the manuscript. MW and AB raised the concept. MW was involved in performing most of the experiments including chromatin immunoprecipitation assay. DR was performing the immunofluorescence analysis, MSK and DS were responsible for conduction the microarray assay. EW and AB were involved in the biochemical analysis and preparation of knockdown cells. All authors revised and approved the final version of the manuscript.
Funding Source
This research was funded by the Polish National Science Centre, project grant number: PRELUDIUM 2016/23/N/NZ3/02435.
Statement of Ethics
The authors have no ethical conflicts to disclose.
The authors have no conflicts of interest to declare.
| 1 Coggins M, Rosenzweig A: The fire within: cardiac inflammatory signaling in health and disease. Circ Res 2015;110:116 -125. https://doi.org/10.1161/CIRCRESAHA.111.243196 |
||||
| 2 Sutton NR, Baek A, Pinsky DJ. Endothelial Cells and Inflammation, in: Mackay IR, Rose NR, Diamond B, Davidson A (eds): Encyclopaedia of Medical Immunology. Springer, New York, NY, 2014. DOI: 10.1007/978-0-387-84828-0_184. https://doi.org/10.1007/978-0-387-84828-0_184 |
||||
| 3 Xiao L, Liu Y, Wang N: New paradigms in inflammatory signaling in vascular endothelial cells. Am J Physiol Heart Circ Physiol 2014;306:H317-H325. https://doi.org/10.1152/ajpheart.00182.2013 |
||||
| 4 Pate M, Damarla V, Chi DS, Negi S, Krishnaswamy G: Endothelial cell biology: role in the inflammatory response. Adv Clin Chem 2010;52:109-130. https://doi.org/10.1016/S0065-2423(10)52004-3 |
||||
| 5 Bhatt D, Ghosh S: Regulation of the NF-κB-Mediated Transcription of Inflammatory Genes. Front Immunol 2014;5:71. https://doi.org/10.3389/fimmu.2014.00071 |
||||
| 6 Bannister AJ, Kouzarides T: Regulation of chromatin by histone modifications. Cell Res 2011;21:381-395. https://doi.org/10.1038/cr.2011.22 |
||||
| 7 Zheng YC, Ma J, Wang Z, Li J, Jiang B, Zhou W, Shi X,Wang X, Zhao W, Liu HM: A Systematic Review of Histone Lysine‐Specific Demethylase 1 and Its Inhibitors. Med Res Rev 2015;35:1032-1071. https://doi.org/10.1002/med.21350 |
||||
| 8 Lee MG, Wynder C, Cooch N, Shiekhattar R: An essential role for CoREST in nucleosomal histone 3 lysine 4 demethylation. Nature 2005;437:432-435. https://doi.org/10.1038/nature04021 |
||||
| 9 Wang Y, Zhang H, Chen Y, Sun Y, Yang F, Yu W, Liang J, Sun L, Yang X, Shi L, Li R, Li Y, Zhang Y, Li Q, Yi X, Shang Y: LSD1 is a subunit of the NuRD complex and targets the metastasis programs in breast cancer. Cell 2009;138:660-672. https://doi.org/10.1016/j.cell.2009.05.050 |
||||
| 10 Lee MG, Wynder C, Schmidt DM, McCafferty DG, Shiekhattar R: Histone H3 Lysine 4 Demethylation Is a Target of Nonselective Antidepressive Medications. Chem Biol 2006;13:563-567. https://doi.org/10.1016/j.chembiol.2006.05.004 |
||||
| 11 Forneris F, Binda C, Battaglioli E, Mattevi A: LSD1: oxidative chemistry for multifaceted functions in chromatin regulation. Trends Biochem Sci 2008;33:181-189. https://doi.org/10.1016/j.tibs.2008.01.003 |
||||
| 12 Sehrawat A, Gao L, Wang Y, Bankhead A 3rd, McWeeney SK, King CJ, Schwartzman J, Urrutia J, Bisson WH, Coleman DJ, Joshi SK , Kim DH, Sampson DA, Weinmann S, Kallakury BVS, Berry DL, Haque R, Van Den Eeden SK, Sharma S, Bearss J, et al.: LSD1 activates a lethal prostate cancer gene network independently of its demethylase function. Proc Natl Acad Sci U S A 2018;115:E4179-E4188. https://doi.org/10.1073/pnas.1719168115 |
||||
| 13 Nagasawa S, Sedukhina AS, Nakagawa Y, Maeda I, Kubota M, Ohnuma S, Tsugawa K , Ohta T, Roche-Molina M , Bernal JA, Narváez AJ, Jeyasekharan AD, Sato K: LSD1 overexpression is associated with poor prognosis in basal-like breast cancer, and sensitivity to PARP inhibition. PLoS One 2015;10:e0118002. https://doi.org/10.1371/journal.pone.0118002 |
||||
| 14 Schulte JH, Lim S, Schramm A, Friedrichs N, Koster J, Versteeg R, Ora I, Pajtler K, Klein-Hitpass L, Kuhfittig-Kulle S, Metzger E, Schüle R, Eggert A, Buettner R, Kirfel J: Lysine-specific demethylase 1 is strongly expressed in poorly differentiated neuroblastoma: implications for therapy. Cancer Res 2009;69:2065-2071. https://doi.org/10.1158/0008-5472.CAN-08-1735 |
||||
| 15 Ambrosio S, Ballabio A, Majello B: Histone methyl-transferases and demethylases in the autophagy regulatory network: The emerging role of KDM1A/LSD1 demethylase. Autophagy 2019;15:187-196. https://doi.org/10.1080/15548627.2018.1520546 |
||||
| 16 Lin T, Ponn A, Hu X, Law BK, Lu J: Requirement of the histone demethylase LSD1 in Snai1-mediated transcriptional repression during epithelial-mesenchymal transition. Oncogene 2010;29:4896-4904. https://doi.org/10.1038/onc.2010.234 |
||||
| 17 Ambrosio S, Saccà CD, Majello B: Epigenetic regulation of epithelial to mesenchymal transition by the Lysine-specific demethylase LSD1/KDM1A. Biochim Biophys Acta Gene Regul Mech 2017;1860:905-910. https://doi.org/10.1016/j.bbagrm.2017.07.001 |
||||
| 18 Pirola L, Ciesielski O, Balcerczyk A: The Methylation Status of the Epigenome: Its Emerging Role in the Regulation of Tumor Angiogenesis and Tumor Growth, and Potential for Drug Targeting. Cancers (Basel) 2018;10:268. https://doi.org/10.3390/cancers10080268 |
||||
| 19 Chen K, Cai Y, Cheng C, Zhang J, Lv F, Xu G, Duan P, Wu Y, Wu Z: MYT1 attenuates neuroblastoma cell differentiation by interacting with the LSD1/CoREST complex. Oncogene 2020;39:4212-4226. https://doi.org/10.1038/s41388-020-1268-6 |
||||
| 20 Adamo A, Sesé B, Boue S, Castaño J, Paramonov I, Barrero MJ, Belmonte JCI: LSD1 regulates the balance between self-renewal and differentiation in human embryonic stem cells. Nat Cell Biol 2011;13:652-659. https://doi.org/10.1038/ncb2246 |
||||
| 21 Whyte WA, Bilodeau S, Orlando DA, Hoke HA, Frampton GM, Foster CT, Cowley SM, Young RA: Enhancer decommissioning by LSD1 during embryonic stem cell differentiation. Nature 2012;482:221-225. https://doi.org/10.1038/nature10805 |
||||
| 22 Sun G, Alzayady K, Stewart R, Ye P, Yang S, Li W, Shi Y: Histone demethylase LSD1 regulates neural stem cell proliferation. Mol Cell Biol 2010;30:1997-2005. https://doi.org/10.1128/MCB.01116-09 |
||||
| 23 Ballas N, Grunseich C, Lu DD, Speh JC, Mandel G: REST and its corepressors mediate plasticity of neuronal gene chromatin throughout neurogenesis. Cell 2005;121:645-657. https://doi.org/10.1016/j.cell.2005.03.013 |
||||
| 24 Wojtala M, Dąbek A, Rybaczek D, Śliwińska A, Świderska E, Słapek K, El-Osta A, Balcerczyk A: Silencing lysine-specific histone demethylase 1 (LSD1) causes increased HP1-positive chromatin, stimulation of DNA repair processes and dysregulation of proliferation by Chk1 phosphorylation in human endothelial cells. Cells 2019;8:1212. https://doi.org/10.3390/cells8101212 |
||||
| 25 Schmidt DMZ, McCafferty DG: trans-2-Phenylcyclopropylamine Is a Mechanism-Based Inactivator of the Histone Demethylase LSD1. Biochemistry 2007;46:4408-4416. https://doi.org/10.1021/bi0618621 |
||||
| 26 Wojtala M, Macierzyńska-Piotrowska E, Rybaczek D, Pirola L, Balcerczyk A: Pharmacological and transcriptional inhibition of the G9a histone methyltransferase suppresses proliferation and modulates redox homeostasis in human microvascular endothelial cells. Pharmacol Res 2018;128:252-263. https://doi.org/10.1016/j.phrs.2017.10.014 |
||||
| 27 Balcerczyk A, Rybaczek D, Wojtala M, Pirola L, Okabe J, El-Osta A: Pharmacological inhibition of arginine and lysine methyltransferases induces nuclear abnormalities and suppresses angiogenesis in human endothelial cells. Biochem Pharmacol 2016;121:18-32. https://doi.org/10.1016/j.bcp.2016.09.013 |
||||
| 28 Okabe J, Fernandez AZ, Ziemann M, Keating ST, Balcerczyk A, El-Osta A: Endothelial Transcriptome in Response to Pharmacological Methyltransferase Inhibition. ChemMedChem 2014;9:1755-1762. https://doi.org/10.1002/cmdc.201402091 |
||||
| 29 Schindelin J, Arganda-Carreras I, Frise E, Kaynig V, Longair M, Pietzsch T, Preibisch S, Rueden C, Saalfeld S, Schmid B, Tinevez JY, White DJ, Hartenstein V, Eliceiri K, Tomancak P, Cardona A: Fiji: an open-source platform for biological-image analysis. Nat Methods 2012;9:676-682. https://doi.org/10.1038/nmeth.2019 |
||||
| 30 Livak KJ, Schmittgen TD: Analysis of Relative Gene Expression Data Using Real-Time Quantitative PCR and the 2−ΔΔCT Method. Methods 2001;25:402-408. https://doi.org/10.1006/meth.2001.1262 |
||||
| 31 Gu F, Lin Y, Wang Z, Wu X, Ye Z, Wang Y, Lan H: Biological roles of LSD1 beyond its demethylase activity. Cell Mol Life Sci 2020;77:3341-3350. https://doi.org/10.1007/s00018-020-03489-9 |
||||
| 32 Konovalov S, Garcia-Bassets I: Analysis of the levels of lysine-specific demethylase 1 (LSD1) mRNA in human ovarian tumors and the effects of chemical LSD1 inhibitors in ovarian cancer cell lines. J Ovarian Res 2013;6:75. https://doi.org/10.1186/1757-2215-6-75 |
||||
| 33 Agboyibor C, Dong J, Effah CY, Drokow EK, Pervaiz W, Liu HM: LSD1 as a Biomarker and the Outcome of Its Inhibitors in the Clinical Trial: The Therapy Opportunity in Tumor. J Oncol 2021;2021:5512524. https://doi.org/10.1155/2021/5512524 |
||||
| 34 Fu DJ, Li J, Yu B: Annual review of LSD1/KDM1A inhibitors in 2020. Eur J Med Chem 2021;214:113254. https://doi.org/10.1016/j.ejmech.2021.113254 |
||||
| 35 Liu W, Fan JB, Xu DW, Zhu XH, Hong Y, Cui SY, Zhang J, Cui ZM: Knockdown of LSD1 ameliorates the severity of rheumatoid arthritis and decreases the function of CD4 T cells in mouse models. Int J Clin Exp Pathol 2018;11:333-341. | ||||
| 36 Yu Z, Liu H, Fan J, Chen F, Liu W. MicroRNA-155participates in the expression of LSD1 and proinflammatory cytokines in rheumatoid synovial cells. Mediators Inflamm 2020;2020:4092762. https://doi.org/10.1155/2020/4092762 |
||||
| 37 Janzer A, Lim S, Fronhoffs F, Niazy N, Buettner R, Kirfel J: Lysine-specific demethylase 1 (LSD1) and histone deacetylase 1 (HDAC1) synergistically repress proinflammatory cytokines and classical complement pathway components. Biochem Biophys Res Commun 2012;421:665-670. https://doi.org/10.1016/j.bbrc.2012.04.057 |
||||
| 38 Yang YT, Wang X, Zhang YY, Yuan WJ: The histone demethylase LSD1 promotes renal inflammation by mediating TLR4 signaling in hepatitis B virus associated glomerulonephritis. Cell Death Dis 2019;10:278. https://doi.org/10.1038/s41419-019-1514-4 |
||||
| 39 Alsaqer SF, Tashkandi MM, Kartha VK, Yang YT, Alkheriji Y, Salama A, Varelas X, Kukuruzinska M, Monti S, Bais MV: Inhibition of LSD1 epigenetically attenuates oral cancer growth and metastasis. Oncotarget 2017;8:73372-73386. https://doi.org/10.18632/oncotarget.19637 |
||||
| 40 Bais MV: Targeting oral cancer epigenome via LSD1. Aging (Albany NY) 2017;9:2455-2456. https://doi.org/10.18632/aging.101343 |
||||
| 41 Kim D, Nam HJ, Lee W, Yim HY, Ahn JY, Park SW, Shin HJR, Yu R, Won KJ, Bae JS, Kim KI, Baek SH: PKCα-LSD1-NF-κB-Signaling Cascade Is Crucial for Epigenetic Control of the Inflammatory Response. Mol Cell 2018;69:398-411.e6. https://doi.org/10.1016/j.molcel.2018.01.002 |
||||
| 42 Liang L, Sun M, Qi Z, Li W: Lysine demethylase 1A exacerbates LPS-induced inflammation of vascular smooth muscle cells through modulation of NF-κB activation. Trop J Pharm Res 2020;19:481-487. https://doi.org/10.4314/tjpr.v19i3.4 |
||||