×
![]()
Corresponding Author: Swapan Kumar Maiti
Division of Surgery, ICAR-Indian Veterinary Research Institute,
Izatnagar, Bareilly, Uttar Pradesh 243122 (India)
Tel. +919412049169, E-Mail swapanivri@gmail.com
Evaluation of Mesenchymal Stem Cells with Conditioned Media and m-EGF for Regeneration of Liver Tissue After Partial Hepatectomy in Wistar Rats
Divya Mohana Swapan Kumar Maitia Shivaraju Shivaramua Sangeetha Palakkaraa Kalaiselvan Elangovana Naveen Kumara Bindhuja Belluti Venkateshappaa Surendra Dunthuru Siddarajua Dinesh Muralib Sowbarenya Chelladuraia Ramith Kallahalli Rajannaa Jürgen Heschelerc
aDivision of Surgery, ICAR-Indian Veterinary Research Institute, Izatnagar, Bareilly, Uttar Pradesh, India, bDivision of Pathology, ICAR-Indian Veterinary Research Institute, Izatnagar, Bareilly, Uttar Pradesh, India, cInstitute of Neurophysiology, University of Cologne, Cologne, Germany
Introduction
The liver is an organ that plays a central role in maintaining metabolic homeostasis, in its functions of metabolism, synthesis and storage of nutrients. The cells in the liver are parenchymal cells and nonparenchymal cells. The former include hepatocytes (80% of the cell population) and the later, includes endothelial cells, Kupffer cells, lymphocytes and stellate cells. Liver dysfunction or failures are having different etiologies. Liver cancer has the fifth highest cancer incidence in the world, and is the third highest cause of cancer related deaths [1] with resection of the liver remaining the only curative option [2].
Hepatic resections are both associated with, and dependent on a rapid proliferation and regeneration of the remnant liver. But many patients experience temporary or permanent hepatic insufficiency after surgery, usually because they have factors potentially limiting liver regeneration, such as advanced age, steatosis, and liver cirrhosis [3]. Therefore, it is essential to optimize liver regenerative capacity in patients with suboptimal liver function or who are scheduled to undergo major hepatectomy. Exploring the newer scientific discoveries governing liver regeneration could contribute to enlightening our understanding of the mechanisms behind this process. This could offer new treatment strategies, not only to patients with advanced liver cancer, but also to patients suffering from acute and chronic liver failure, as the liver is the major detoxifying organ of the body and is likely to be injured by ingested toxins.
Orthotropic liver transplantation is a life-saving treatment for patients with end-stage liver disease, but it is limited by organ shortages, high expense, graft rejection, and the requirement for long-term immunosuppression and considerable long-term side effects that include chronic renal failure, post transplant lymphoproliferative disease, and cardiovascular complications [4].
The search for new therapies has been actively pursued for several decades, primarily in the form of artificial liver support devices and hepatocyte transplantation, yet both of these modalities remain experimental. During tissue injury, it has been suggested that bone marrow stem cells are mobilized and migrate to the injured organ to maintain physiologic hemostasis [5]. This theory has formed the basis for regenerative therapy whereby treatment with appropriate stem cells might ameliorate specific diseases. Eom et al. [6] has mentioned that mesenchymal stem cells (MSCs) can move toward areas of injury in response to signals of cellular damage, which are known as homing signals. This migration property of MSCs is important in regenerative medicine because various parenteral routes can be used depending on the damaged tissue or organ. Mesenchymal stem cells can be transplanted into the liver by intravenous, intraperitoneal, intrahepatic, intrasplenic, or portal-venous injection, however, the effects have differed based on their injection routes. MSC can differentiate into hepatocytes-like cells both in vitro and in vivo and can secrete trophic factors, including growth factors, cytokines and chemokines, which promote the regeneration of impaired liver [7].
The secretome or conditioned media is defined as the richly complex set of molecules secreted by stem cells or shed from their surface [8]. The idea of using stem cell secretome or conditioned media is based on the concept that the secretome is responsible for a considerable portion of the therapeutic potential of stem cells [9]. The MSC secretome contains a large number of growth factors and cytokines that are critical for the repair of injured tissues. Since paracrine factors released by stem cells can accumulate in the conditioned media (CM), it can be utilized as a cell-free therapy [10].
Epidermal growth factor (EGF) is a polypeptide produced in the submandibular glands, Brunner’s glands and kidneys [11]. It stimulates growth of many cells including liver parenchymal cells both in vivo and in vitro [12] and it is expressed under normal physiological conditions in the adult liver, and gets markedly upregulated during the process of regeneration after liver injury or partial hepatectomy. The administration of EGF accelerates the proliferation of hepatocytes, regardless of what recombinant protein or gene therapy strategy was used [13, 14].
Therefore, the study was intended to investigate the potential of MSCs, conditioned media and EGF in promoting liver regeneration following partial hepatectomy in rat model.
Materials and Methods
Experimental Design
The study was designed after getting permission from the Institute Animal Ethics Committee (IAEC). Eighty clinically healthy adult Wistar rats (Ratus norvegicus), weighing 200-300 gm) of either sex were utilized for this study. Animals were procured from the Laboratory Animal Resources (LAR) section of the Institute. The animals were acclimatized to their environment 10 days prior to the study. The experimental animal models of partial hepatectomy in these animals were prepared and randomly divided into 4 groups, viz., Groups A, B, C and D having 20 animals in each group. Animals of each group were given treatment according to Table 1.
The animals were sacrificed on 10th, 20th, 30th, 40th day and liver samples were collected for histopathology, immunohistochemistry and tracing of transplanted cells. The blood samples were also collected at similar time intervals; serum was separated from it and subjected to biochemical analysis. Clinico-physiological parameters were also recorded at the same time intervals.
Collection, isolation and cultivation of mesenchymal stem cells from rat
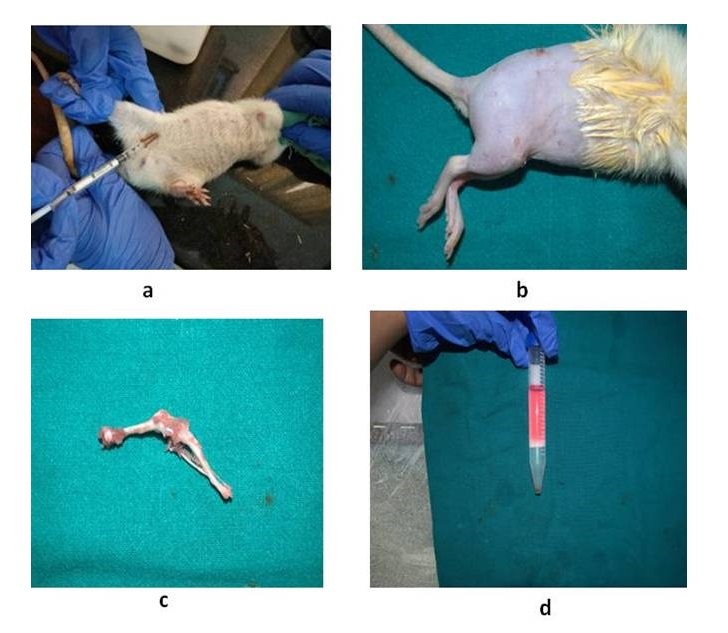
The bone marrow was obtained from femur and tibia of adult Wistar rat. After euthanizing the animal, the backside of the rats from the lumbar region to toes was shaved and prepared aseptically for dissection. The Skin incision was given on the lateral aspect of the thigh and both tibia and femur were exteriorized after removing the muscular and tendinous attachment. The femur and tibia were collected in a 50 ml tube containing Dulbecco’s Phosphate Buffered Saline (DPBS) and antibiotics. The tubes were opened in the laminar flow under strict aseptic conditions. The metaphyseal region of the bones was cut and the bone marrow was flushed out by inserting a hypodermic needle into the medullary cavity using Dulbecco’s Modified Eagles Media (DMEM) into a centrifuge tube. The bone marrow collected was then mixed with one volume of low glucose DMEM consisting of 10% fetal bovine serum (FBS), 1% penicillin-G, streptomycin sulphate and amphotericin B. The cell suspension was centrifuged at 980 rpm for 5 min to concentrate the cells. The cell pellet was resuspended in 5 ml of complete media and was layered over 5 ml of histopaque and then centrifuged at 2500 rpm for 30 min.
The nucleated cells were collected from the interface, washed with two volumes of DPBS and were then collected by centrifugation at 1500 rpm for 10 min. The cells were resuspended, counted and placed at 1×10⁶ cells/cm2 in T-75 flasks (Fig. 1). The adherent cells in the flask were maintained in Dulbecco’s Modified Eagle’s Medium-low glucose (DMEM-LG) containing 10% fetal bovine serum (FBS), 1% antibiotic mixture of 100 units/ml of penicillin and 100 μg/ml of streptomycin (Invitrogen/Gibco) at 37 °C in a humidified atmosphere of 5% CO2 and 95% air. After 4 days of primary culture, the non-adherent cells were removed by changing the medium. The medium was changed every 3 days thereafter until the flask showed confluency. After 18 days, the flask became 70-80% confluent and was passaged. Culture medium was removed, and cells were treated with Trypsin-EDTA solution (0.25% Trypsin and 1Mm EDTA (Gibco)) for 5 minutes at 37 °C to detach cells from the flasks. The Trypsin-EDTA activity was stopped by adding an equal volume of complete medium, and the medium with cells was collected in a centrifuge tube, centrifuged at 4 °C, 1500 rpm for 6 min. The supernatant was removed and the cell pellet was collected and placed in a T-75 flask. Third passage cells were used further for cell differentiation studies and in vivo experiments (Fig. 2).
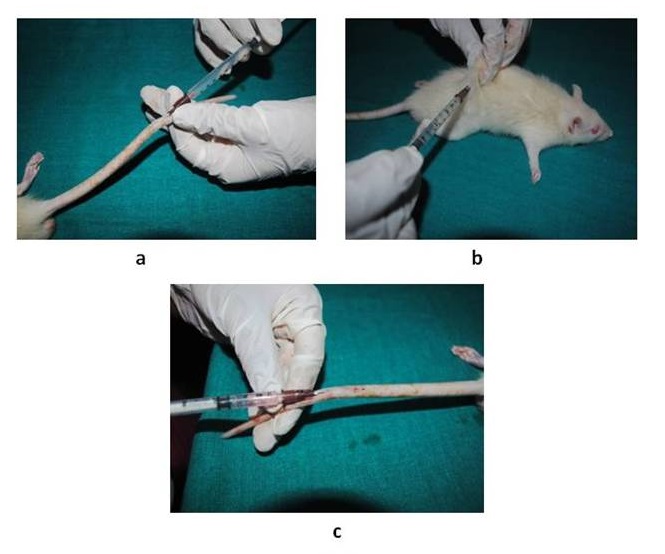
Preparation of rat model of partial hepatectomy
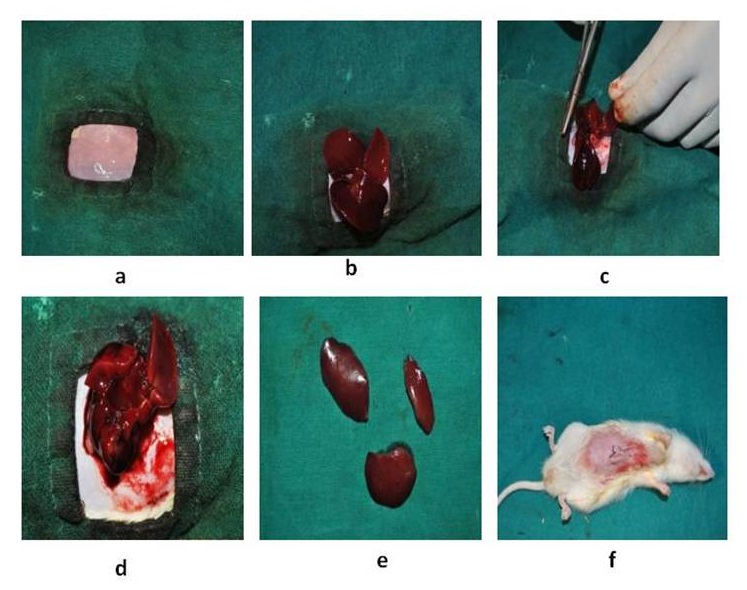
The animals were anaesthetized with Midazolam @5mg/kg and Ketamine @50mg/kg intravenously. The cranio-ventral abdomen of the rats were shaved and sterilized with 5% povidoneiodine. The animals were restrained in dorsal recumbency. A midline incision was made from the xiphoid cartilage to umbilicus and cranial abdomen was exposed. The liver was exteriorized and three-knot technique was used at the base of the lateral and median lobe of the liver (divided into two lobes). Then respective lobes were resected after proper ligation. Bleeding was checked and abdomen wall and skin were sutured routinely in layers (Fig. 3). Antibiotic ceftriaxone 5mg/10ml of water and anti-inflammatory drugs butorphanol 0.5 mg/kg subcutaneous route was given for 5 days postoperatively. The animals were given stem cells (1.5×10⁶, I/V), conditioned media (0.5ml, I/V), m-EGF (9µg, S/C) at three different intervals (Fig. 4).
Clinical parameters
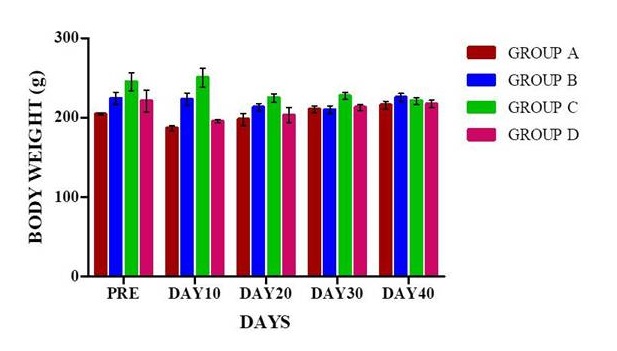
Clinico-physiological parameters include rectal temperature was recorded on the day of surgery and for five days continuously post-operatively. Bodyweight was recorded at 10th, 20th, 30th, and 40th days postoperatively in all the animals.
Biochemical parameters
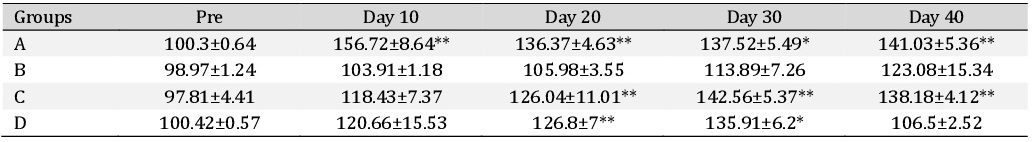
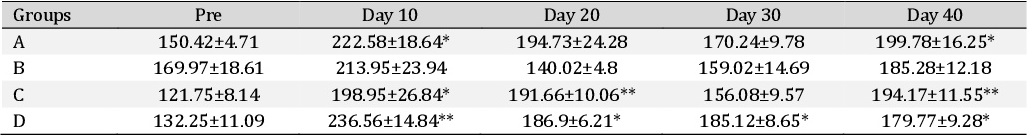
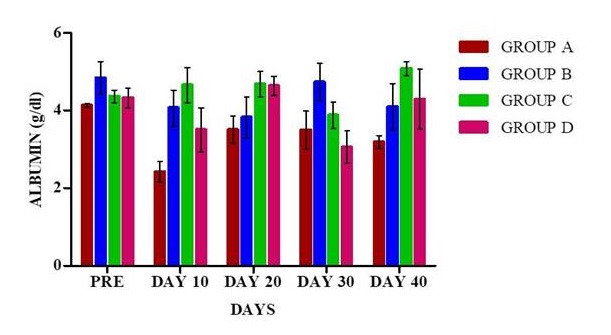
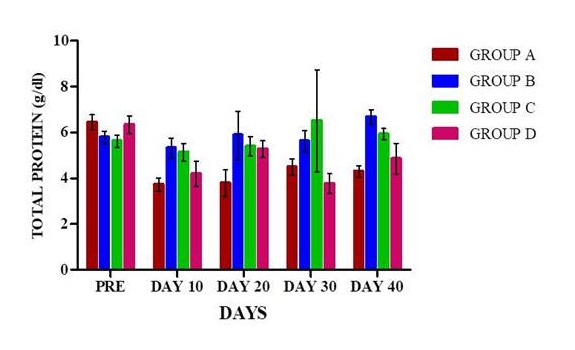
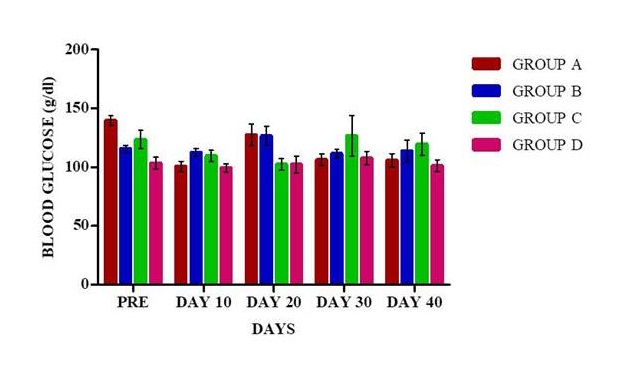
Two ml of blood was collected from the orbital plexus of rats with capillary tubes at 10th, 20th, 30th and 40th days post operatively. One ml of blood was utilized for serum separation for estimation of alanine transaminases (ALT), aspirate transaminases (AST), alkaline phosphatase (ALP), albumin, total protein, bilirubin, gamma-glutamyl trnsferase (GGT) using standard commercially available kits. Blood glucose was estimated in the blood collected from the tip of the tail using a glucometer (On-Call-Plus).
Hematological parameters
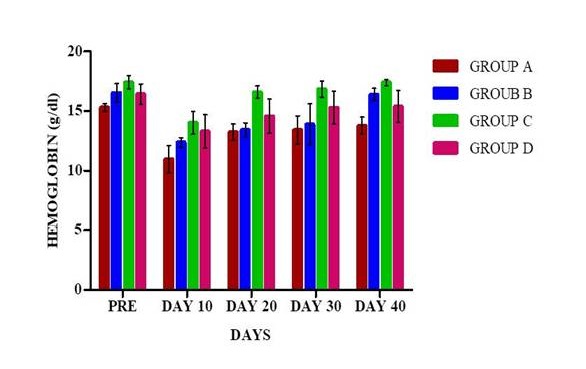
One ml of blood was used for estimation of hemoglobin and packed cell volume (PCV) at 10th, 20th, 30th and 40th days’ post-surgery.
Regeneration Coefficient
Regeneration coefficient was used for quantitative evaluation of the regeneration processes [15]. This Coefficient was calculated as follows:
K= (P1-P2) / P3
Where P1 is liver weight respective days after partial hepatectomy (measured directly), P2 weight of the liver remaining after hepatectomy and P3 weight of the removed liver (measured directly). P2 is calculated by subtracting the initial weight of the liver (P0) and the weight of the liver removed (P3). The initial weight of the liver was calculated based on the regression model and relationship between rat liver weight and body weight (y=0.0357x+1.7477), in this y is the liver weight and x is the body weight of the animal.
Enzyme linked immunosorbant assay
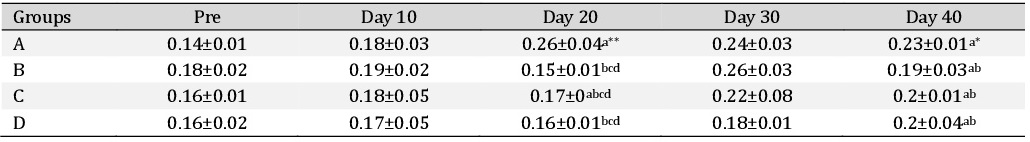
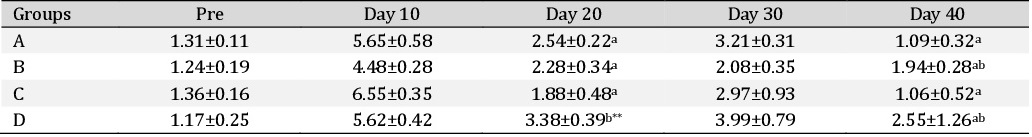
Matrix metalloproteinase-9 (MMP-9) was estimated by using enzyme linked immunosorbant assay (ELISA0 kit (Invitrogen Catalog # KHC3061) at 10th, 20th, 30th and 40th days postoperatively. Tissue inhibitors of matrix metalloproteinases-2 (TIMP-2) were estimated using rat TIMP-2, ELISA kit (Immuno Tag Catalog no: ITER0065) at 10th, 20th, 30th and 40th days postoperatively.
Histological observation
Liver tissues were collected on 10th, 20th, 30th and 40th day’s interval for histological evaluation. Liver specimens were fixed in 10% neutral buffered formalin. The samples were then processed for paraffin embedding technique to get 5 micron thick paraffin section. The section was stained by Hematoxylin and Eosin stain (HE) to evaluate the regeneration process of liver tissue. Sections were also stained with Masson’s Trichome for demonstration of collagen deposition in regenerated liver tissue at different intervals of an experiment.
Immunohistochemistry
Two hours before sacrifice, rats were administered 50 mg/kg 5-Bromo-2′-deoxyuridine (BrdU) intraperitoneal (Sigma-Aldrich, Catalog no: B5002). After being anaesthetized, liver tissues were removed and fixed with 10% neutral buffered formalin (NBF) for overnight, and then the tissues were shifted to fresh 10% NBF. Tissue sections 4 to 7μm thick were prepared. For immunohistochemical study Poly-L-Lysine (BOSTER Catalog no: AR0003) coated slides were used.
Tracing of transplanted cells
The confluence of BM-MSCs (third passage) when reached 60-70%, 4’,6-diamidino-2-phenylindole (DAPI; 1 μg/ml) (Invitrogen Catalog # D1306) was added to the medium and cells were cultured for 12 h. After incubation, cells were washed with PBS 6 times and the cell sample was examined by fluorescence microscopy. The DAPI stained BM-MSCs were trypsinized counted and about 1.5×10⁶ cells were injected intravenously through the tail vein. For identifying DAPI+ BM-MSCs in the liver, the liver was harvested on day 9 after surgery and frozen sections (5μ thickness) were prepared and observed under the fluorescence microscope.
Statistical analysis
The data were analyzed by using the Statistical Program for Social Sciences (SPSS 20 IBM). One way ANOVA was done to compare the means at different time intervals among different groups. Repeated measures ANOVA were performed for comparing the mean values between different time intervals within a group. A value of P˂0.05 (*) was considered to be statistically significant and at times P<0.01 (**) was considered to be statistically significant. All the graphs were prepared in Graph Pad Prism (Version 5).
Results
Clinical parameters
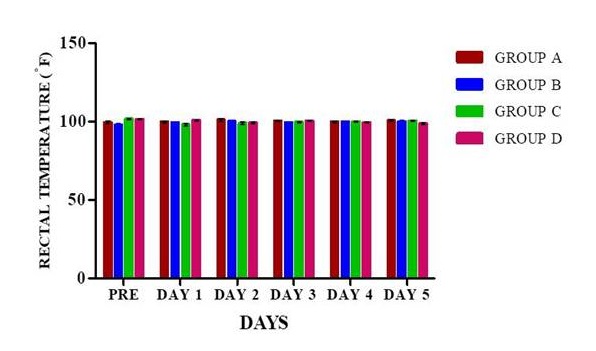
Rectal temperature. Rectal temperature was recorded for 6 days as it is depicted in Fig. 5. The rectal temperature was measured on the day of surgery before anaesthesia and then the temperature was recorded for 5 consecutive days postoperatively.
Haemato-Biochemical parameters
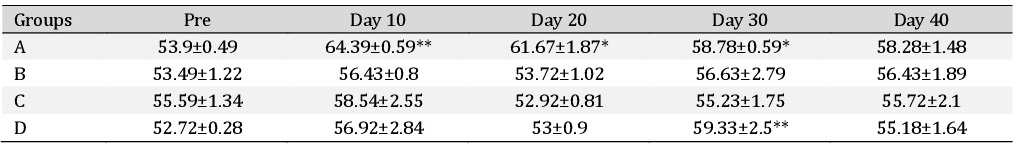
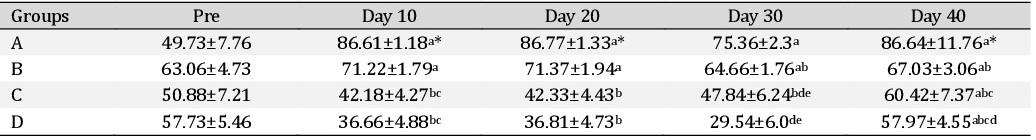
Alanine transaminase. The Alanine transaminase (ALT) values in different treatment groups are depicted in the Table 2. It was observed that ALT values did not significantly differ between groups at any time intervals. In group A there was significant (P<0.05) increase in ALT values on day 10, day 20 and day 30 compared to their basal values. In group D there was a significant (P<0.05) increase in ALT value on day 30 compared to its basal values. However, in other groups, no significant change was observed.
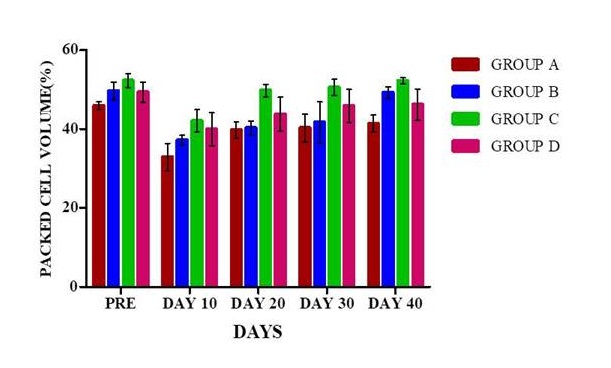
Packed cell volume
The packed cell volume (%) in different treatment groups are depicted in Fig. 11. The packed cell volume in animals in different treatment groups at various time intervals were recorded on the day of surgery and days 10, 20, 30 and 40 postoperatively. There was no significant variation in the packed cell volume among different groups at various time intervals. The PCV showed a decline in the values on 10th day post-surgery in all the groups but in group A, it was a significant (P<0.05) decrease compared to their base values.
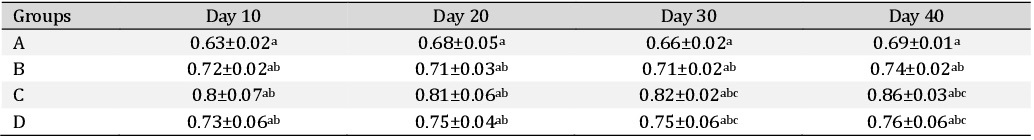
Regeneration Coefficient
The regeneration coefficients were calculated in all the groups and are displayed in Table 7. It was observed that regeneration coefficient did not show significant change within the groups at various time intervals, however, there was a non-significant increase in group C.
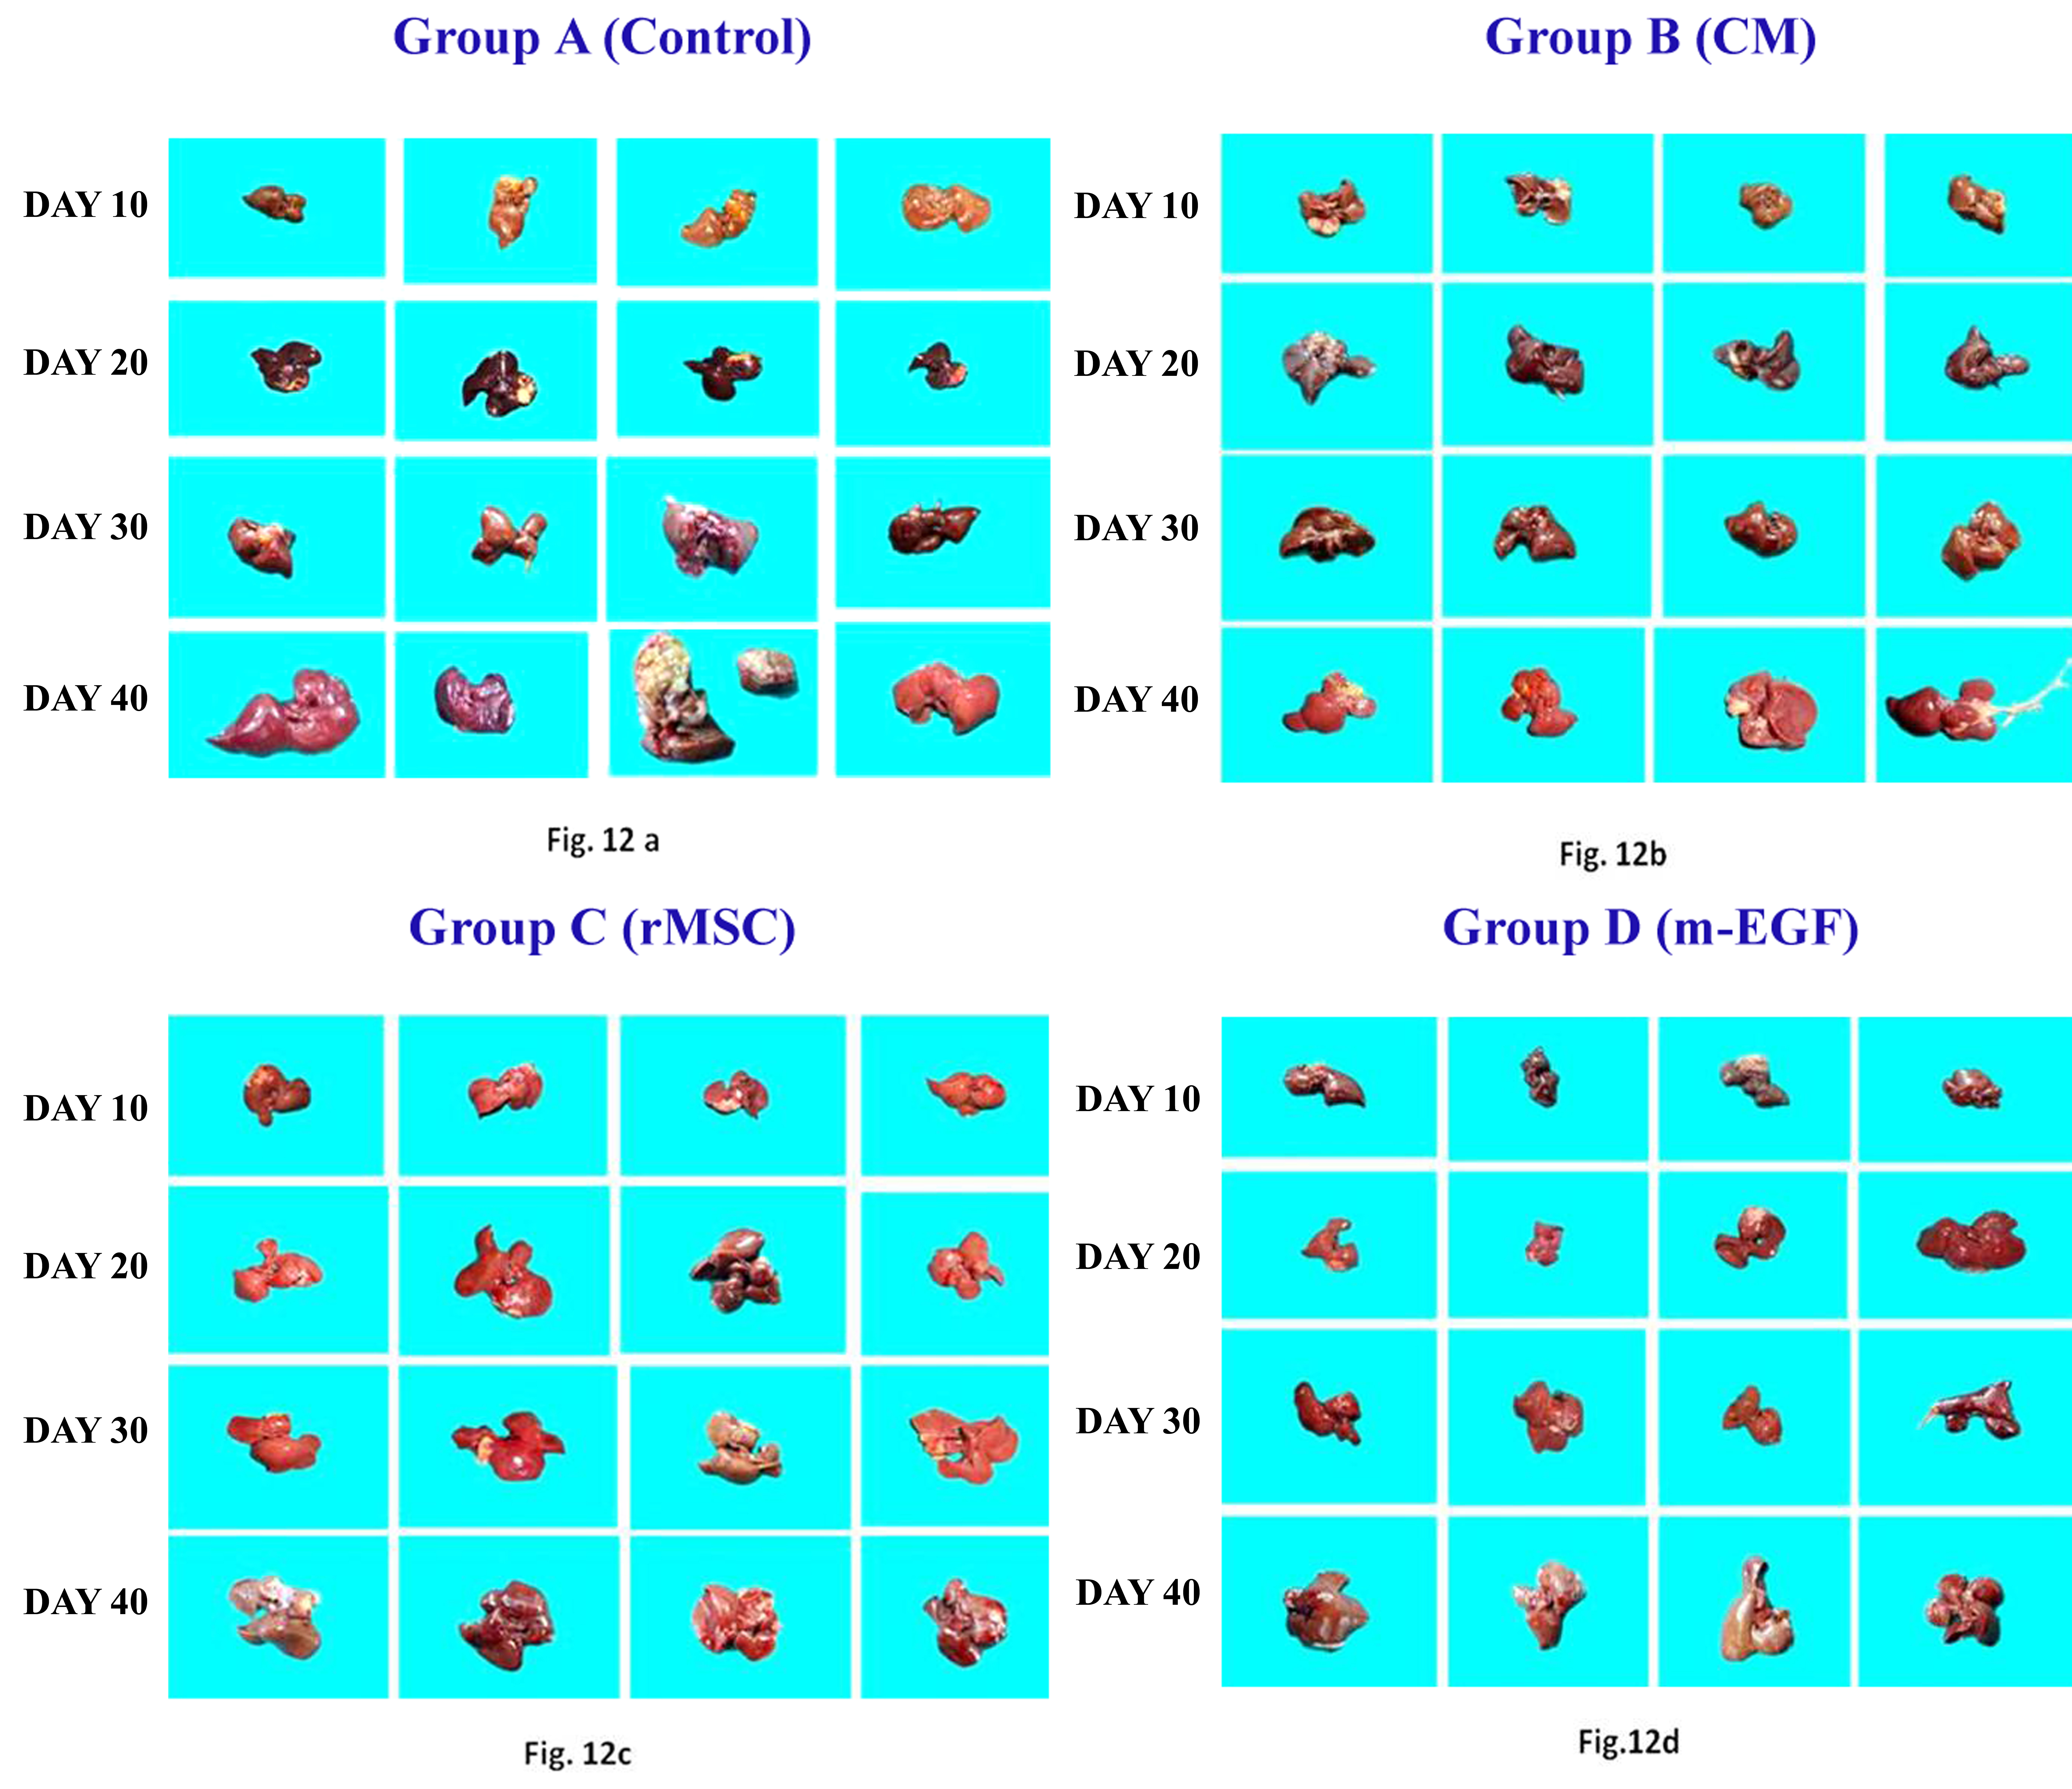
Colour digital imaging
In this study, colour photographs of the liver from different treatment groups at various time intervals were taken. This digital imaging was done to assess the gross changes in the size, shape and other changes in the liver. In group A, Fig. 12a depicts the colour images of the liver taken on days 10, 20, 30 and 40 postoperatively. It can be grossly observed that the size of the liver as such did not in increase much on day 10 while subsequently hypertrophy was observed in other lobes but the liver was comparatively paler in appearance. On the 40th day, the size of the liver comparatively increased concerning its day 10 size. In group B, Fig. 12b depicts the colour images of the liver taken on days 10, 20, 30 and 40 after treatment with conditioned media. It was observed that grossly the liver size in this group did not vary significantly compare to control group (A) on day 10, but subsequently on day 30 and 40 enlargement and hypertrophy in the liver lobes was observed. In group C, Fig. 12c displays the colour images of liver taken on days 10, 20, 30 and 40 postoperatively after treatment with bone marrow derived mesenchymal stem cells. It was noticed that there was a gross enlargement in the size of the liver from day 10 onwards, there was hypertrophy and the colour and texture of the liver was quite similar to its normal appearance. In group D, Fig. 12d depicts the colour images of the liver taken on day 10, 20, 30 and 40 postoperatively after treatment with epidermal growth factor. It was observed that on day 10 there was not much enlargement in the size of liver but was better than group A and group B, subsequently, there was enlargement and hypertrophy in the size of liver noticed on days 30 and 40.
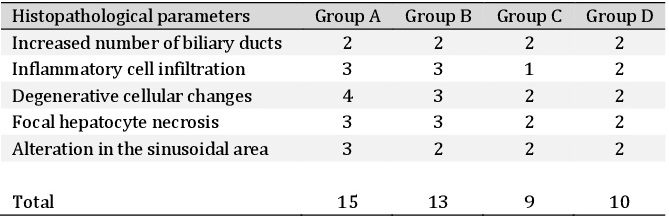
Histopathological observations
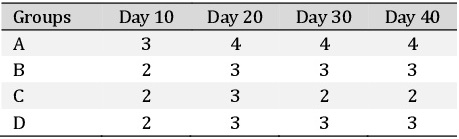
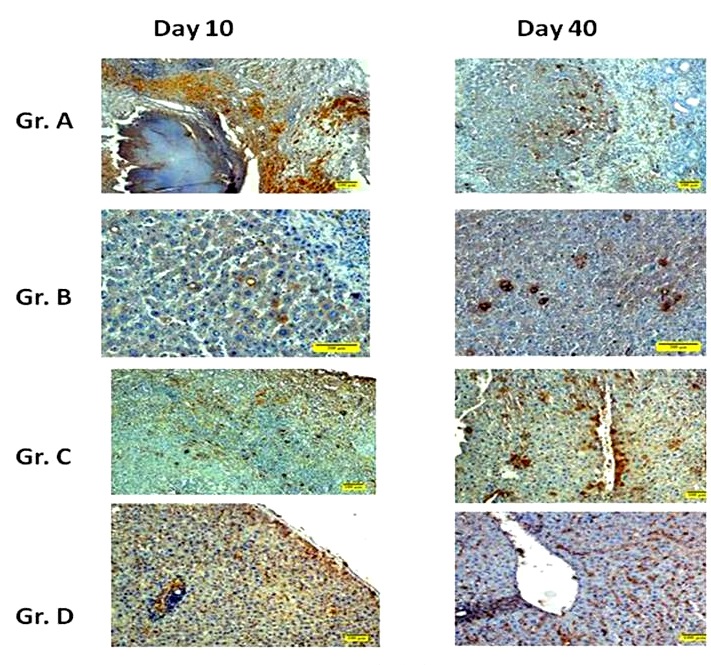
The histopathological examination of the liver samples collected in various treatment groups at different time interval was performed. Histopathological evaluation of rat liver at day 40 after partial hepatectomy is presented in Table 10. Various histopathological alterations were photographed using an upright microscope (Olympus, BX3, Japan). In group A, there was bile duct proliferation, lymphocyte infiltration and fibrous tissue proliferation on day 10 (Fig. 12a). On day 20, there was fibroblast proliferation, bile pigment deposition, lymphocyte reaction and coagulative necrosis. On day 30, it was observed that there was fibroblast proliferation, neovascularization, few newly formed hepatocytes. On day 40, few newly formed hepatocytes could be seen; enlarged cells with hyperchromatic nuclei and vacuolations were also observed. In group B, there was bile duct hyperplasia, bile pigment deposition, fibrous tissue proliferation on day 10 (Fig. 13b). On day 20, no distinct sinusoidal arrangements and fibrous tissues extension from portal triad were seen. On day 30, Kupffer cells were seen in the regenerated area, newly formed hepatocytes could be seen. On day 40, there was bile duct proliferation along with more number of Kupffer cells in the regenerated area, no distinct boundary of hepatocytes. In group C, bile duct proliferation and newly formed hepatocytes could be visualized in the regenerated area on day 10 (Fig. 13c). On day 20, newly formed hepatocytes, dividing hepatocytes and lymphocyte infiltration could be visualized. On day 30, newly formed hepatocytes and bile pigment deposition were noticed. On day 40, abundant dividing hepatocytes was found in the regenerated area, however, sinusoidal arrangement was not properly formed. In group D, dividing nuclei inside the hepatocytes and more number of Kupffer cells could be seen on day 10 (Fig 13d). On day 20, enlarged nuclei inside the hepatocytes, neovascularization and newly formed bile ducts could be seen. On day 30, newly formed hepatocytes and bile duct proliferation could be noticed. On day 40, more neovascularization, fatty changes and newly formed hepatocytes were noticed.
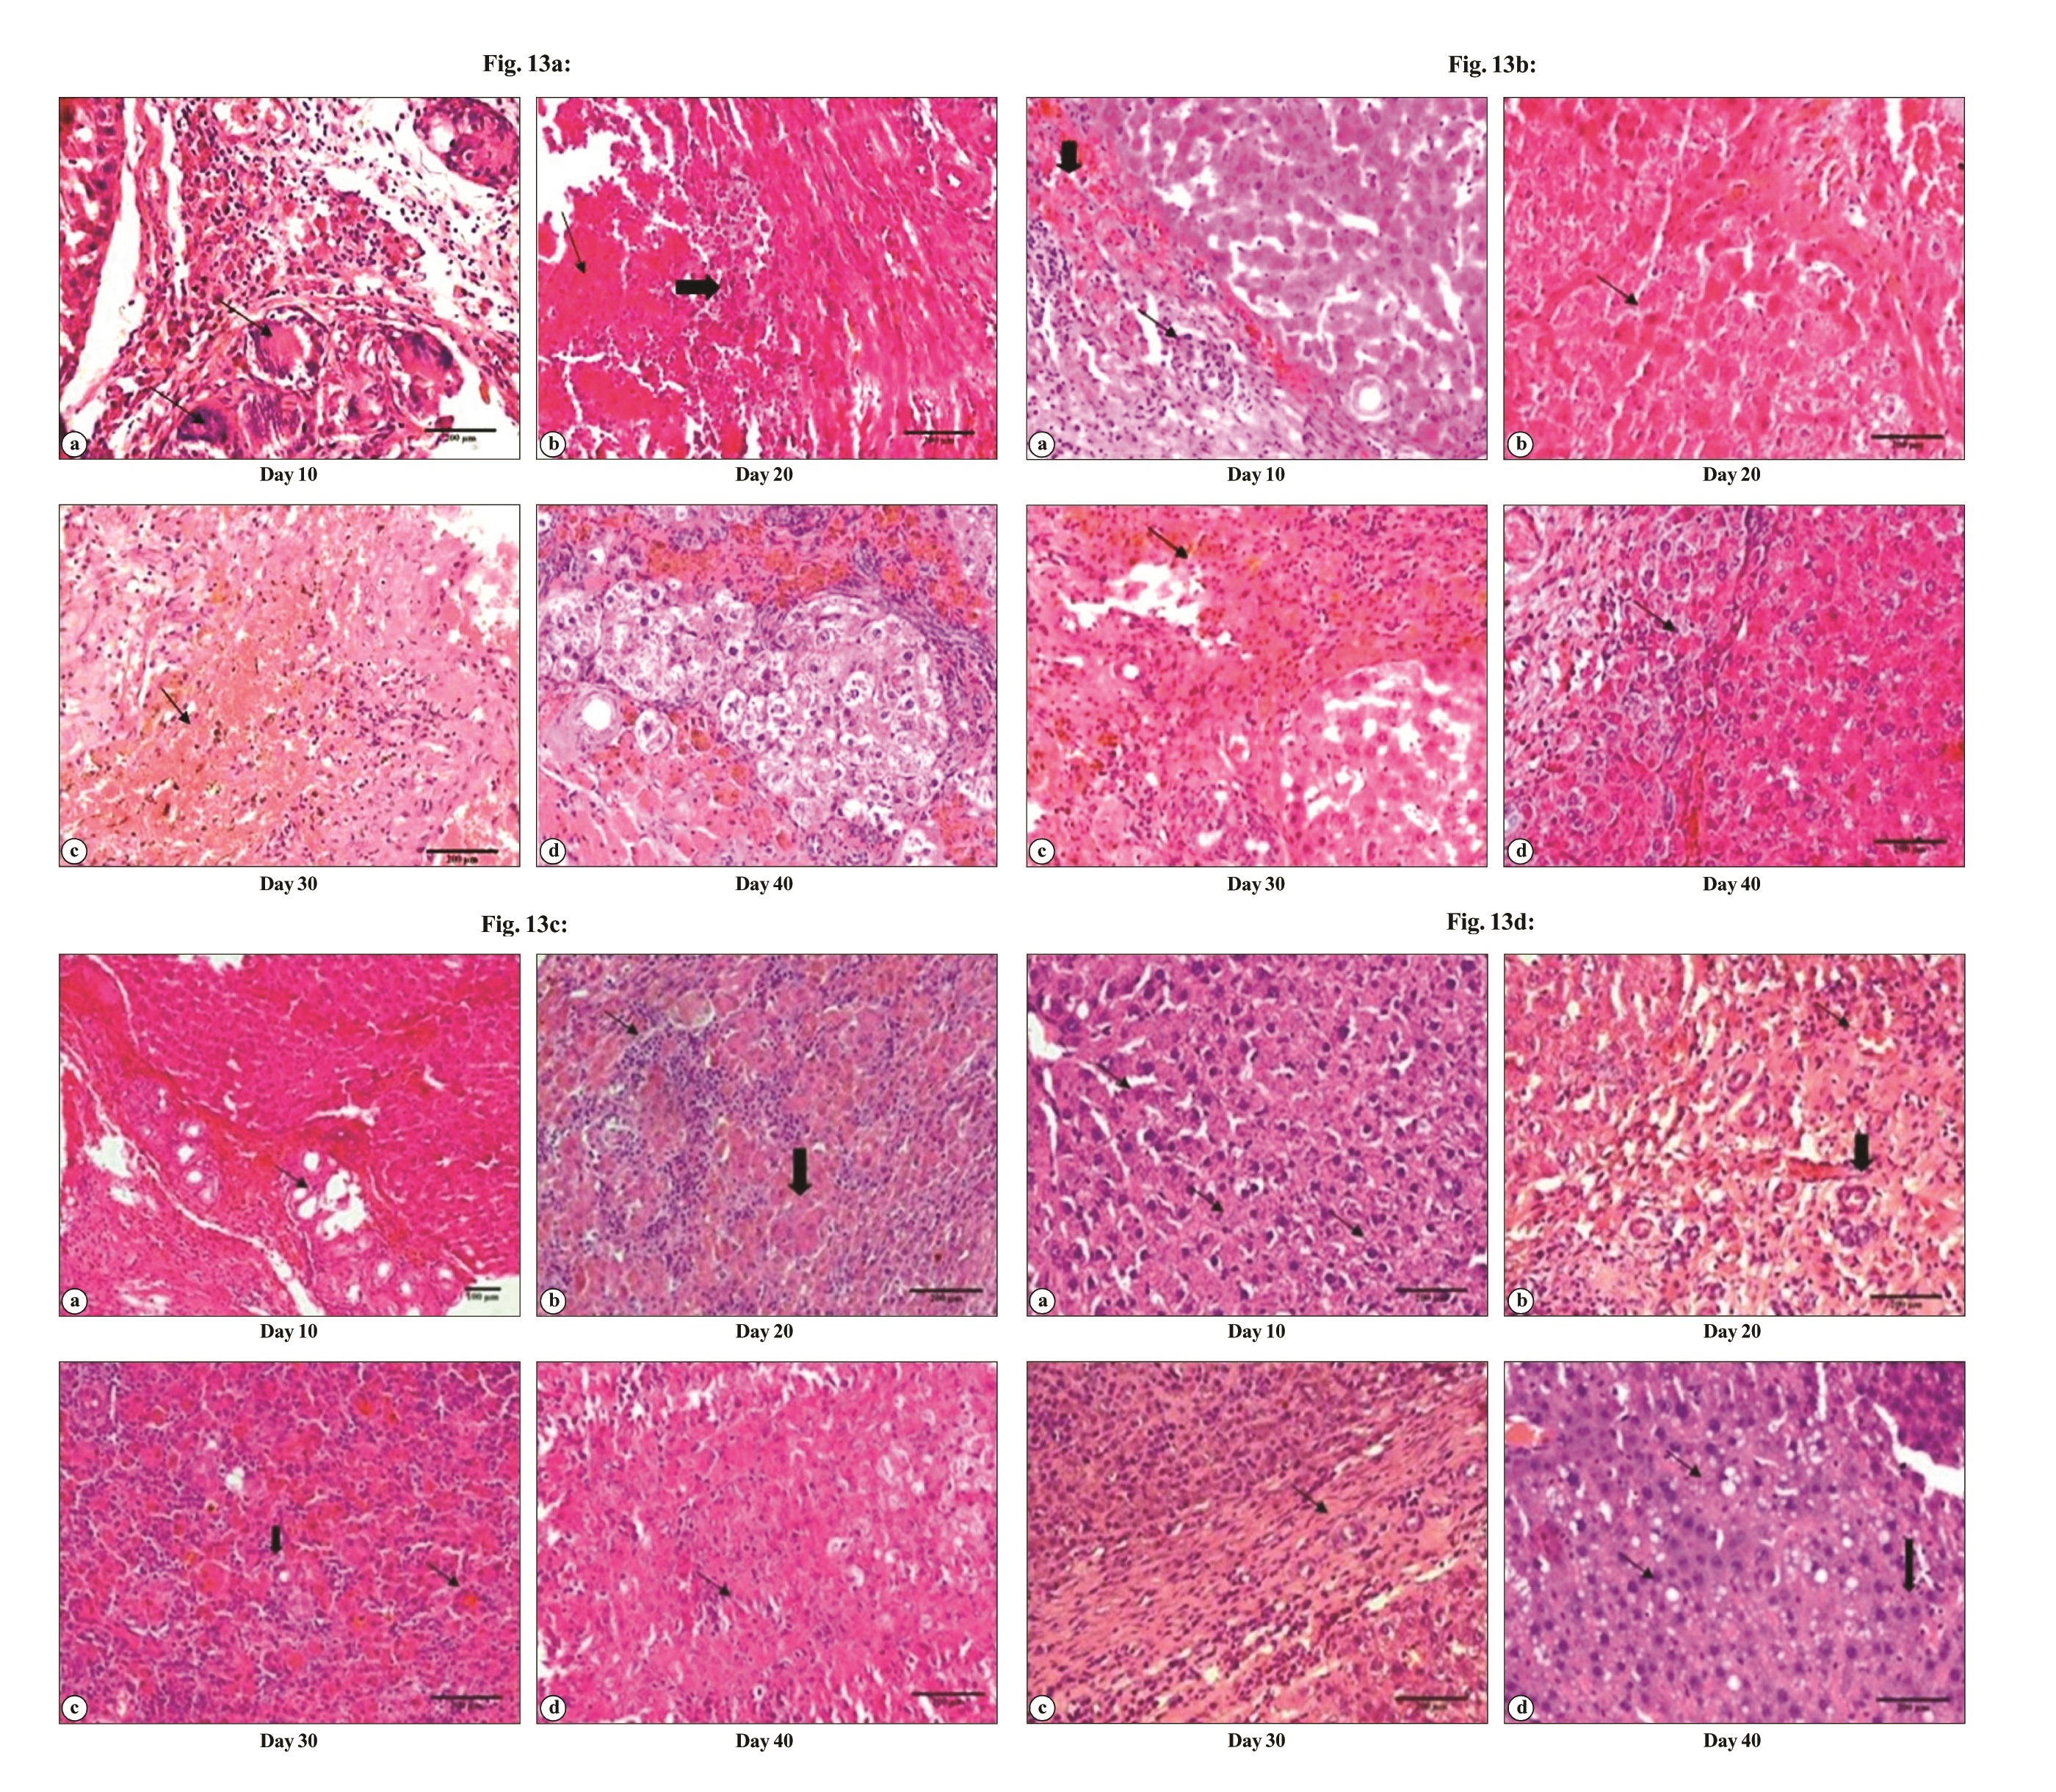
Masson’s Trichrome
Masson’s trichrome staining was performed to evaluate the fibrotic changes in the liver. Masson’s Trichrome staining in normal liver demonstrated hexagons with the delicate lining of connective tissue. In group A (Fig. 14a) there was collagen deposition in between the newly formed hepatocytes and around the proliferated bile duct which subsequently increased from day 10 onwards upto day 40. In group B (Fig. 14b) there was fibroblast proliferation in between the hepatocytes the broadening of fibroplasia subsequently got reduced and more organized. In group C (Fig. 14c) the fibrous tissue proliferation was very limited around the bile ducts and at the junction of regeneration, which was later reduced and was scanty. In group D (Fig. 14d) the fibrous tissue was noticed on day 10 which later got reduced and was more organized on subsequent days. Scoring based on Masson’s Trichrome staining of rat hepatic tissue after partial hepatectomy is depicted in Table 11.
Tracing of transplanted cells
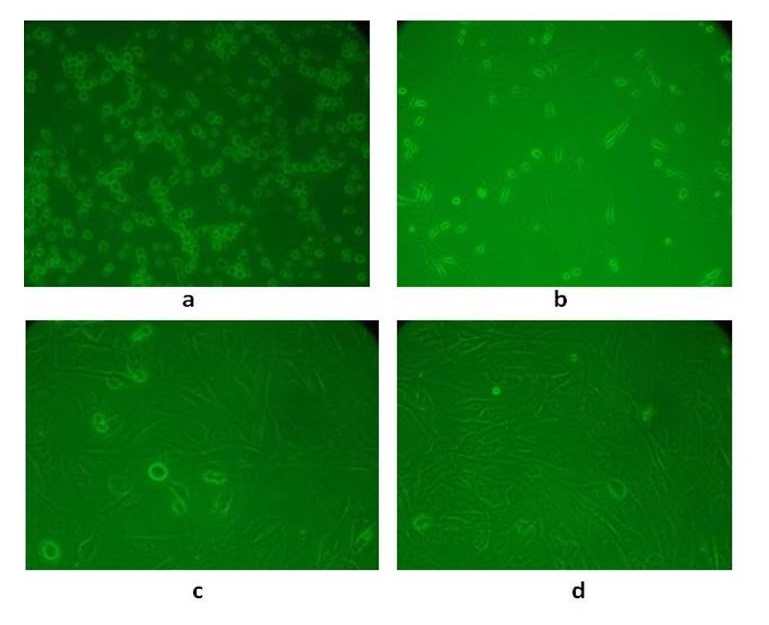
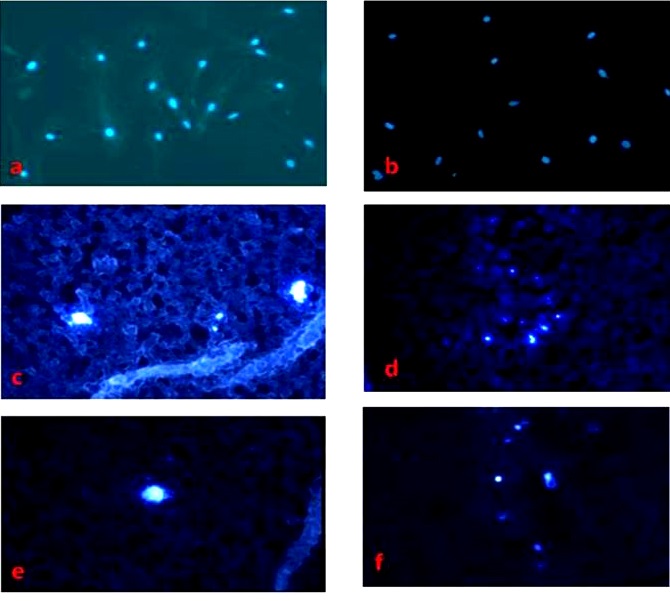
The bone marrow-derived mesenchymal stem cells (third passage cells) were stained with 4’,6-diamidino-2-phenylindole (DAPI; 1 μg/ml). For this purpose, DAPI was added in the media and the cells were cultured for 12 h. The cells were observed under a fluorescent microscope and it was observed that the nucleus of the stem cells was showing fluorescence (Fig. 16). These DAPI stained stem cells were trypsinized and injected intravenously through a tail vein in partially hepatectomized rats. After 9 days of therapy, the animal was sacrificed and the liver was collected. Frozen section of the liver tissue was prepared (5μ) and observed under the microscope. DAPI labelled stem cells were observed in the liver section.
The authors wish to thank Dr K. P. Singh, Joint-Director, CADRAD, ICAR-IVRI, Izatnagar (UP), India for his technical assistance in evaluation of histological sections. The authors also wish to thank the Director, ICAR-Indian Veterinary Research Institute, Izatnagar, India and Head, Division of Surgery, Indian Veterinary Research Institute for providing necessary facilities for this study.
Author Contributions
DM and SKM designed the study, analyzed the data and prepare the manuscript; DM, SS, SP, KE, BBV, SDS and RKR performed the experiments; NK, SC and DM performed haemato-biochemical estimation; DM performed histopathological evaluation; JH edited the manuscript.
Funding
No external funding agencies supported this research work.
Statement of Ethics
Protocols for this study were approved by the Institute Animal Ethics Committee for Animal Care and Animal Experimentation.
The authors declare that no conflicts of interest exist.
| 1 Parkin DM, Bray F, Ferlay J, Pisani P: Estimating the world cancer burden. Globocan 2000. Int J Cancer 2001;94:153-156. https://doi.org/10.1002/ijc.1440 |
||||
| 2 Kanat O, Gewirtz A, Kemeny N: What is the potential role of hepatic arterial infusion chemotherapy in the current armamentorium against colorectal cancer. J Gastrointest Oncol 2012;2:130-138. | ||||
| 3 Helling TS: Liver failure following partial hepatectomy. HPB (Oxford) 2006;8:165-174. https://doi.org/10.1080/13651820510035712 |
||||
| 4 Houlihan DD. Houlihan, P, Newsome N: Critical review of clinical trials of bone marrow stem cells in liver disease. Gastroenterology 2008;135:438-450. https://doi.org/10.1053/j.gastro.2008.05.040 |
||||
| 5 Körbling M, Estrov Z: Adult stem cells for tissue repair-a new therapeutic concept, New Eng J Med 2003;349:570-582. https://doi.org/10.1056/NEJMra022361 |
||||
| 6 Eom YW, Kim G, Baik SK: Mesenchymal stem cell therapy for cirrhosis: present and future perspective. World J Gastroenterol 2015a;21:10253. https://doi.org/10.3748/wjg.v21.i36.10253 |
||||
| 7 Eom YW, Shim KY, Baik SK: Mesenchymal stem cell therapy for liver fibrosis. Korean J Intern Med 2015;30:580-589. https://doi.org/10.3904/kjim.2015.30.5.580 |
||||
| 8 Makridakis M, Roubelakis MG, Lahou A: Stem cells: insights into the secretome. Biochim Biophys Acta 2013;1834:2380-2384. https://doi.org/10.1016/j.bbapap.2013.01.032 |
||||
| 9 Yoon BS, Moon JH, Jun EK, Kim J, Maeng I, Kim JS, Lee JH, Baik CS, Kim A, Cho KS, Lee JH: Secretory profiles and wound healing effects of human amniotic fluid-derived mesenchymal stem cells. Stem Cells Dev 2009;19:887-902. https://doi.org/10.1089/scd.2009.0138 |
||||
| 10 Lee SK, Lee SC, Kim A: A novel cell-free strategy for promoting mouse liver regeneration: utilization of a conditioned medium from adipose-derived stem cells. Hepatol Int 2015;9:310-320. https://doi.org/10.1007/s12072-014-9599-4 |
||||
| 11 Olsen PS, Nexø E, Poulsen SS, Hansen HF, Kirkegaard P: Renal origin of rat urinary epidermal growth factor. Regul Pept 1984;10:37-45. https://doi.org/10.1016/0167-0115(84)90051-X |
||||
| 12 Jansing R, Samsonoff WAS: Effect of epidermal growth factor on cultured adult rat hepatocytes. Tissue Cell 1984;16:157-166. https://doi.org/10.1016/0040-8166(84)90040-5 |
||||
| 13 Kiso S, Kawata S, Tamura S, Inui Y, Yoshida Y, Sawai Y, Umeki S, Ito N, Yamada A, Miyagawa JI, Higashiyama S: Liver regeneration in heparin-binding EGF-like growth factor transgenic mice after partial hepatectomy. Gastroenterology 2003;124:701-707. https://doi.org/10.1053/gast.2003.50097 |
||||
| 14 Khai NC, Takahashi T, Ushikoshi H, Nagano S, Yuge K, Esaki M, Kawai T, Goto K, Murofushi Y, Fujiwara T, Fujiwara H: In vivo hepatic HB-EGF gene transduction inhibits Fas-induced liver injury and induces liver regeneration in mice: a comparative study to HGF. J Hepatol 2006;44:1046-1054. https://doi.org/10.1016/j.jhep.2005.10.027 |
||||
| 15 Khnychenko LK, Stepanov II, Sapronov NS: Regression analysis of relationship between liver weight and body weight after partial hepatectomy in rats. Bull Exp Biol Med 2006;141:269-271. https://doi.org/10.1007/s10517-006-0146-8 |
||||
| 16 Higgins GM, Anderson RM: Experimental pathology of the liver: restoration of the liver of the white rat following partial surgical removal. Arch Pathol Lab Med 1931;12:186-202. | ||||
| 17 Martins PN, Theruvath TP, Neuhaus P: Rodent models of partial hepatectomies. Liver Int 2008;28:3-11. https://doi.org/10.1111/j.1478-3231.2007.01628.x |
||||
| 18 Sánchez QE, Soberón G, Palacios O, Lee E, Kuri M: Changes in effective enzyme concentration in the growing rat liver. II. Liver regeneration after partial hepatectomy. J Biol Chem 1961;236:1607-1610. https://doi.org/10.1016/S0021-9258(18)64220-6 |
||||
| 19 Chen YX, Zeng ZC, Sun J, Zeng HY, Huang Y, Zhang ZY: Mesenchymal stem cell-conditioned medium prevents radiation-induced liver injury by inhibiting inflammation and protecting sinusoidal endothelial cells. J Radiat Res 2015;56:700-708. https://doi.org/10.1093/jrr/rrv026 |
||||
| 20 Kanazawa H, Fujimoto Y, Teratani T, Iwasaki J, Kasahara N, Negishi K, Tsuruyama T, Uemoto S, Kobayashi E: Bone marrow-derived mesenchymal stem cells ameliorate hepatic ischemia reperfusion injury in a rat model. PloS One 2011;6:191-195. https://doi.org/10.1371/journal.pone.0019195 |
||||
| 21 Glanemann M, Shi B, El-Zidy N, Gaebelein G, Kronbach Z, Neuhaus P, Nussler AK: Subcutaneous administration of epidermal growth factor: A true treatment option in case of postoperative liver failure. Int J Surg 2009;7:200-205. https://doi.org/10.1016/j.ijsu.2009.03.004 |
||||
| 22 El-Ashmawy IM, El-Nahas AF, Salama OM: Protective effect of volatile oil, alcoholic and aqueous extracts of Origanum majorana on lead acetate toxicity in mice Basic Clin Pharmacol. Toxicol 2005;97:238-243. https://doi.org/10.1111/j.1742-7843.2005.pto_136.x |
||||
| 23 Delva E, Camus Y, Nordlinger B, Hannoun L, Parc R, Deriaz H, Lienhart A, Huguet C: Vascular occlusions for liver resections. Operative management and tolerance to hepatic ischemia: 142 cases. Ann Surg 1989;209:211-218. https://doi.org/10.1097/00000658-198902000-00012 |
||||
| 24 Allalouf DS, Schwarzman H, Levinsky N, Feller J, Hart S, Zoher R, Menache R: Lactate dehydrogenase and alkaline phosphates isoenzymes in regenerating liver. Res Exp Med 1986;186:103-107. https://doi.org/10.1007/BF01851990 |
||||
| 25 Li DL, He XH, Zhang SA, Fang J, Chen FS, Fan JJ: Bone marrow derived mesenchymal stem cells promote hepatic regeneration after partial hepatectomy in rats. Pathobiology 2013;80:228-234. https://doi.org/10.1159/000346796 |
||||
| 26 Siddique M: Comparison of liver function tests after 2/3 hepatectomy and liver biopsy in experimental rats. J Med Sci 2004;4:318-322. https://doi.org/10.3923/jms.2004.318.322 |
||||
| 27 Henderson IC, Fischel RE, Loeb JN: Suppression of liver DMA synthesis by hydrocortisone. Endocrinology 1971;88:1471-1476. https://doi.org/10.1210/endo-88-6-1471 |
||||
| 28 Short J, Wedmore R, Kilbert L, Zemel R: Triiodothyronine: on its rote as a specific hepatomitogen. Cytobios 1980;28:165-177. | ||||
| 29 McGowan JA, Strain AJ, Bucher NLR: DNA synthesis in primary cultures of adult rat hepatocytes in a defined medium: effects of epidermal growth factor, insulin, glucagon and cyclic AMP. J Cell Physiol 1981;708:353-363. https://doi.org/10.1002/jcp.1041080309 |
||||
| 30 Rixon RH, MacManus JP, Whitfield JF: The control of liver regeneration by calcitonin, parathyroid hormones, and 1a,25-dihydroxychotecalciferol. Mol Cell Endocrinol 1979;75:79-89. https://doi.org/10.1016/0303-7207(79)90009-1 |
||||
| 31 Moriey CGD, Royse VL: Adrenergic agents as possible regulators of liver regeneration. Int J Biochem 1981;73:969-973. https://doi.org/10.1016/0020-711X(81)90001-X |
||||
| 32 Strecker W, Silz S, Salem A, Ruhenstroth-Bauer G: Metabolic changes in the serum of partially hepatectomized rats. Horm Metab Res 1980;12:604-608. https://doi.org/10.1055/s-2007-999210 |
||||
| 33 Fang B, Shi M, Liao L, Yang S, Liu Y, Zhao RC: Systemic infusion of FLK1+ mesenchymal stem cells ameliorate carbon tetrachloride-induced liver fibrosis in mice. Transplantation 2004;78:83-88. https://doi.org/10.1097/01.TP.0000128326.95294.14 |
||||
| 34 Sakaida I, Terai S, Nishina H, Okita K: Development of cell therapy using autologous bone marrow cells for liver cirrhosis. Med Mol Morphol 2005;38:197-202. https://doi.org/10.1007/s00795-005-0298-z |
||||
| 35 Takahara T, Furui K, Yata Y, Jin B, Zhang LP, Nambu S, Sato H, Seiki M, Watanabe A: Dual expression of matrix metalloproteinase‐2 and membrane‐type 1‐matrix metalloproteinase in fibrotic human livers. Hepatology 1997;26:1521-1529. https://doi.org/10.1002/hep.510260620 |
||||
| 36 Değerli U, Bozfakıoğlu Y (eds): Cerrahi Gastroenterology, 5th ed. Istanbul, Basım, Nobel Tıp Kitabevleri, 2000, pp 194-208. | ||||
| 37 Widmann JJ, Fahimi HD: Proliferation of mononuclear phagocytes (Kupffer cells) and endothelial cells in regenerating rat liver. A light and electron microscopic cytochemical study. Am J Pathol 1975;80:349. | ||||
| 38 Laurent S, Otsuka M, De Saeger C, Maiter D, Lambotte L, Horsmans Y: Expression of presumed specific early and late factors associated with liver regeneration in different rat surgical models. Lab Invest 2001;81:1299-1307. https://doi.org/10.1038/labinvest.3780343 |
||||
| 39 Cetinkunar S, Tokgoz S, Bilgin BC, Erdem H, Aktimur R, Can S, Erol HS, Isgoren A, Sozen S, Polat Y: The effect of silymarin on hepatic regeneration after partial hepatectomy: is silymarin effective in hepatic regeneration. Int J Clin Exp Med 2015;8:2572-2578. | ||||
| 40 Tanaka Y, Mak KM, Lieber CS: Immunohistochemical detection of proliferating lipocytes in regenerating rat liver. J Pathol 1990;160:129-134. https://doi.org/10.1002/path.1711600206 |
||||
| 41 Tokcaer-Keskin Z, Akar AR, Ayaloglu-Butun F, Terzioglu-Kara E, Durdu S, Ozyurda U, Ugur M, Akcali KC: Timing of induction of cardiomyocyte differentiation for in vitro cultured mesenchymal stem cells: a perspective for emergencies. Can J Physiol Pharmacol 2009;87:143-150. https://doi.org/10.1139/Y08-111 |
||||
| 42 Aziz MA, Atta HM, Mahfouz S, Fouad HH, Roshdy NK, Ahmed HH, Rashed LA, Sabry D, Hassouna AA, Hasan M: Therapeutic potential of bone marrow-derived mesenchymal stem cells on experimental liver fibrosis. Clin Biochem 2007;40:893-899. https://doi.org/10.1016/j.clinbiochem.2007.04.017 |
||||
| 43 Kimura M, Moro T, Motegi H, Maruyama H, Sekine M. Okamoto H, Inoue H, Sato T, Ogihara M: In vivo glycyrrhizin accelerates liver regeneration and rapidly lowers serum transaminase activities in 70% partially hepatectomized rats. Eur J Pharmacol 2008;579:357-364. https://doi.org/10.1016/j.ejphar.2007.10.073 |
||||
| 44 Du Z, Wei C, Cheng K, Han B, Yan J, Zhang M, Peng C, Liu Y: Mesenchymal stem cell-conditioned medium reduces liver injury and enhances regeneration in reduced-size rat liver transplantation. J Surg Res 2013;183:907-915. https://doi.org/10.1016/j.jss.2013.02.009 |
||||
| 45 Parekkadan B, Van Poll D, Suganuma K, Carter E A, Berthiaume F, Tilles AW, Yarmush ML: Mesenchymal stem cell-derived molecules reverse fulminant hepatic failure. PloS one 2007;2:941. https://doi.org/10.1371/journal.pone.0000941 |
||||
| 46 Plaa GL, Hewitt WR: Quantitative evaluation of indices of hepatotoxicity; in Plaa GL, Hewitt WR (eds): Toxicology of the Liver. New York, Raven Press, 1982, pp 103-120. | ||||
| 47 Hajduk SL: Demonstration of kinetoplast DNA in dyskinetoplastic strains of Trypanosoma equiperdum. Science 1976;191:858-859. https://doi.org/10.1126/science.1251198 |
||||
| 48 Kania J, Fanning TG: Use of a Sequence‐Specific DNA‐Binding Ligan to Probe the Environments of EcoRI Restriction Endonuclease Cleavage Sites. Eur J Biochem 1976;67:367-371. https://doi.org/10.1111/j.1432-1033.1976.tb10700.x |
||||