×
![]()
Corresponding Author: Ghada Bouguerra
Laboratoire d’Hématologie Moléculaire et Cellulaire, Institut Pasteur de Tunis, 13 Place Pasteur, PO BOX no74, 1002, Belvédère, Tunis (Tunisia)
Tel. +216 71 84 66 59, Fax +216 71 79 18 33, E-Mail ghada.bouguerra@yahoo.fr
Enhanced Eryptosis in Glucose-6-Phosphate Dehydrogenase Deficiency
Ghada Bouguerraa,b Khaoula Talbib,c Nawel Trabelsib,c Dorra Chaouachib Imen Boudrigab Salem Abbèsa,b Samia Menifa,b
aUniversité de Tunis El Manar, Faculté de Médecine de Tunis, Tunis, Tunisie, bUniversité de Tunis El Manar, Laboratoire d’Hématologie Moléculaire et Cellulaire, Institut Pasteur de Tunis, Tunis, Tunisie, cUniversité de Tunis El Manar, Faculté des Sciences de Tunis, Tunis, Tunisie
Introduction
Glucose-6-Phosphate Dehydrogenase (G6PD) deficiency is the most common hereditary enzymopathy worldwide [1]. Due to the disease’s genotypic heterogeneity [2], clinical manifestations vary from mild to severe syndromes such as neonatal jaundice (NNJ) [3], favism [4], congenital non-spherocytic hemolytic anemia (CNSHA) [5] and drug or infection-induced hemolytic anemia (DIHA and IIHA respectively) [6]. Predominantly, the pathophysiology in G6PD deficiency is characterized by episodes of hemolysis which are triggered either by the exposure to oxidative stress through infection [7], the ingestion of certain foods such as fava beans [8] or oxidative treatments such as the antimalarial Primaquine [9].
As G6PD catalyzes the first step in the pentose phosphate pathway (PPP), the enzyme not only controls the generation of the only reducing power in erythrocytes in the form of reduced nicotinamide adenine dinucleotide phosphate (NADPH) [10] but also sustains a constant supply of the reduced form of the antioxidant enzyme Glutathione (GSH) [11]. GSH plays a crucial role in maintaining membrane integrity as well as maintaining hemoglobin (Hb) at its functional state by neutralizing reactive oxygen species (ROS) such as free radicals, hydrogen peroxide, and other oxidative species produced as a result of regular oxygen metabolism in erythrocytes [12]. Consequently, a decrease in G6PD levels jeopardizes the erythrocyte’s antioxidant machinery, which in turn, enhances cellular oxidative damage [13],
thus impairing erythrocytes [14].
A housekeeping gene, located on the X chromosome, encodes the G6PD enzyme [15]. So far, more than 200 genetic variants were described, in association with the aforementioned wide range of clinical manifestations [16]. In regions such as Tunisia, where the deficiency is endemic [17], predominant variants include the African variant A- (G6PD:c.376A>G, G6PD:c.202G>A) [18, 19], classified as a type III deficiency by the World Health Organization and associated with both CNSHA and DIHA, and the Mediterranean variant B- (G6PD:c.563C>T), classified as a type II deficiency and associated with favism and NNJ [17]. Evidence suggests that both variants are associated with a premature cellular breakdown through severe shortening of erythrocyte half-life from 60 to 22 days [20].
The premature cellular breakdown of erythrocytes could be a consequence of either hemolysis or eryptosis [21]. Eryptosis is a process of erythrocyte programmed cell death, which is characterized by biochemical and morphological stigmas mimicking the apoptosis of nucleated cells [22]. Biochemical hallmarks of eryptosis include calcium (Ca2+) entry in the cell with an increase of cytosolic Ca2+ activity ([Ca2+]i) [23], alteration of intracellular ion homeostasis [24], activation of cysteine proteases such as µ-calpain [25] and caspase 3 [26] as well as the generation of free radicals paralleled by the inactivation of antioxidant enzymes [27]. During this cellular death process, morphological changes include cell shrinkage [28], membrane blebbing, and exposure of the phospholipid phosphatidylserine (PS) at the outer leaflet [29]. Under physiological conditions, PS is retained within the inner membrane leaflet through the ATP-dependent aminophospholipid translocase (APLT), thus ensuring an asymmetrical phospholipid distribution through the membrane [30]. PS-exposing erythrocytes are recognized by macrophages belonging to the endothelial system through their vitronectin receptors, then rapidly and efficiently cleared from the circulation [31, 32].
Although an enhanced sensitivity to eryptosis was, previously reported in G6PD deficiency [33], there is as yet no consistent data on PS exposure, nor a consensus on the underlying mechanisms of premature programmed erythrocyte cell death. Furthermore, there were no thorough examinations of the relationship between the nature of the molecular defects and the enhanced eryptosis in G6PD.
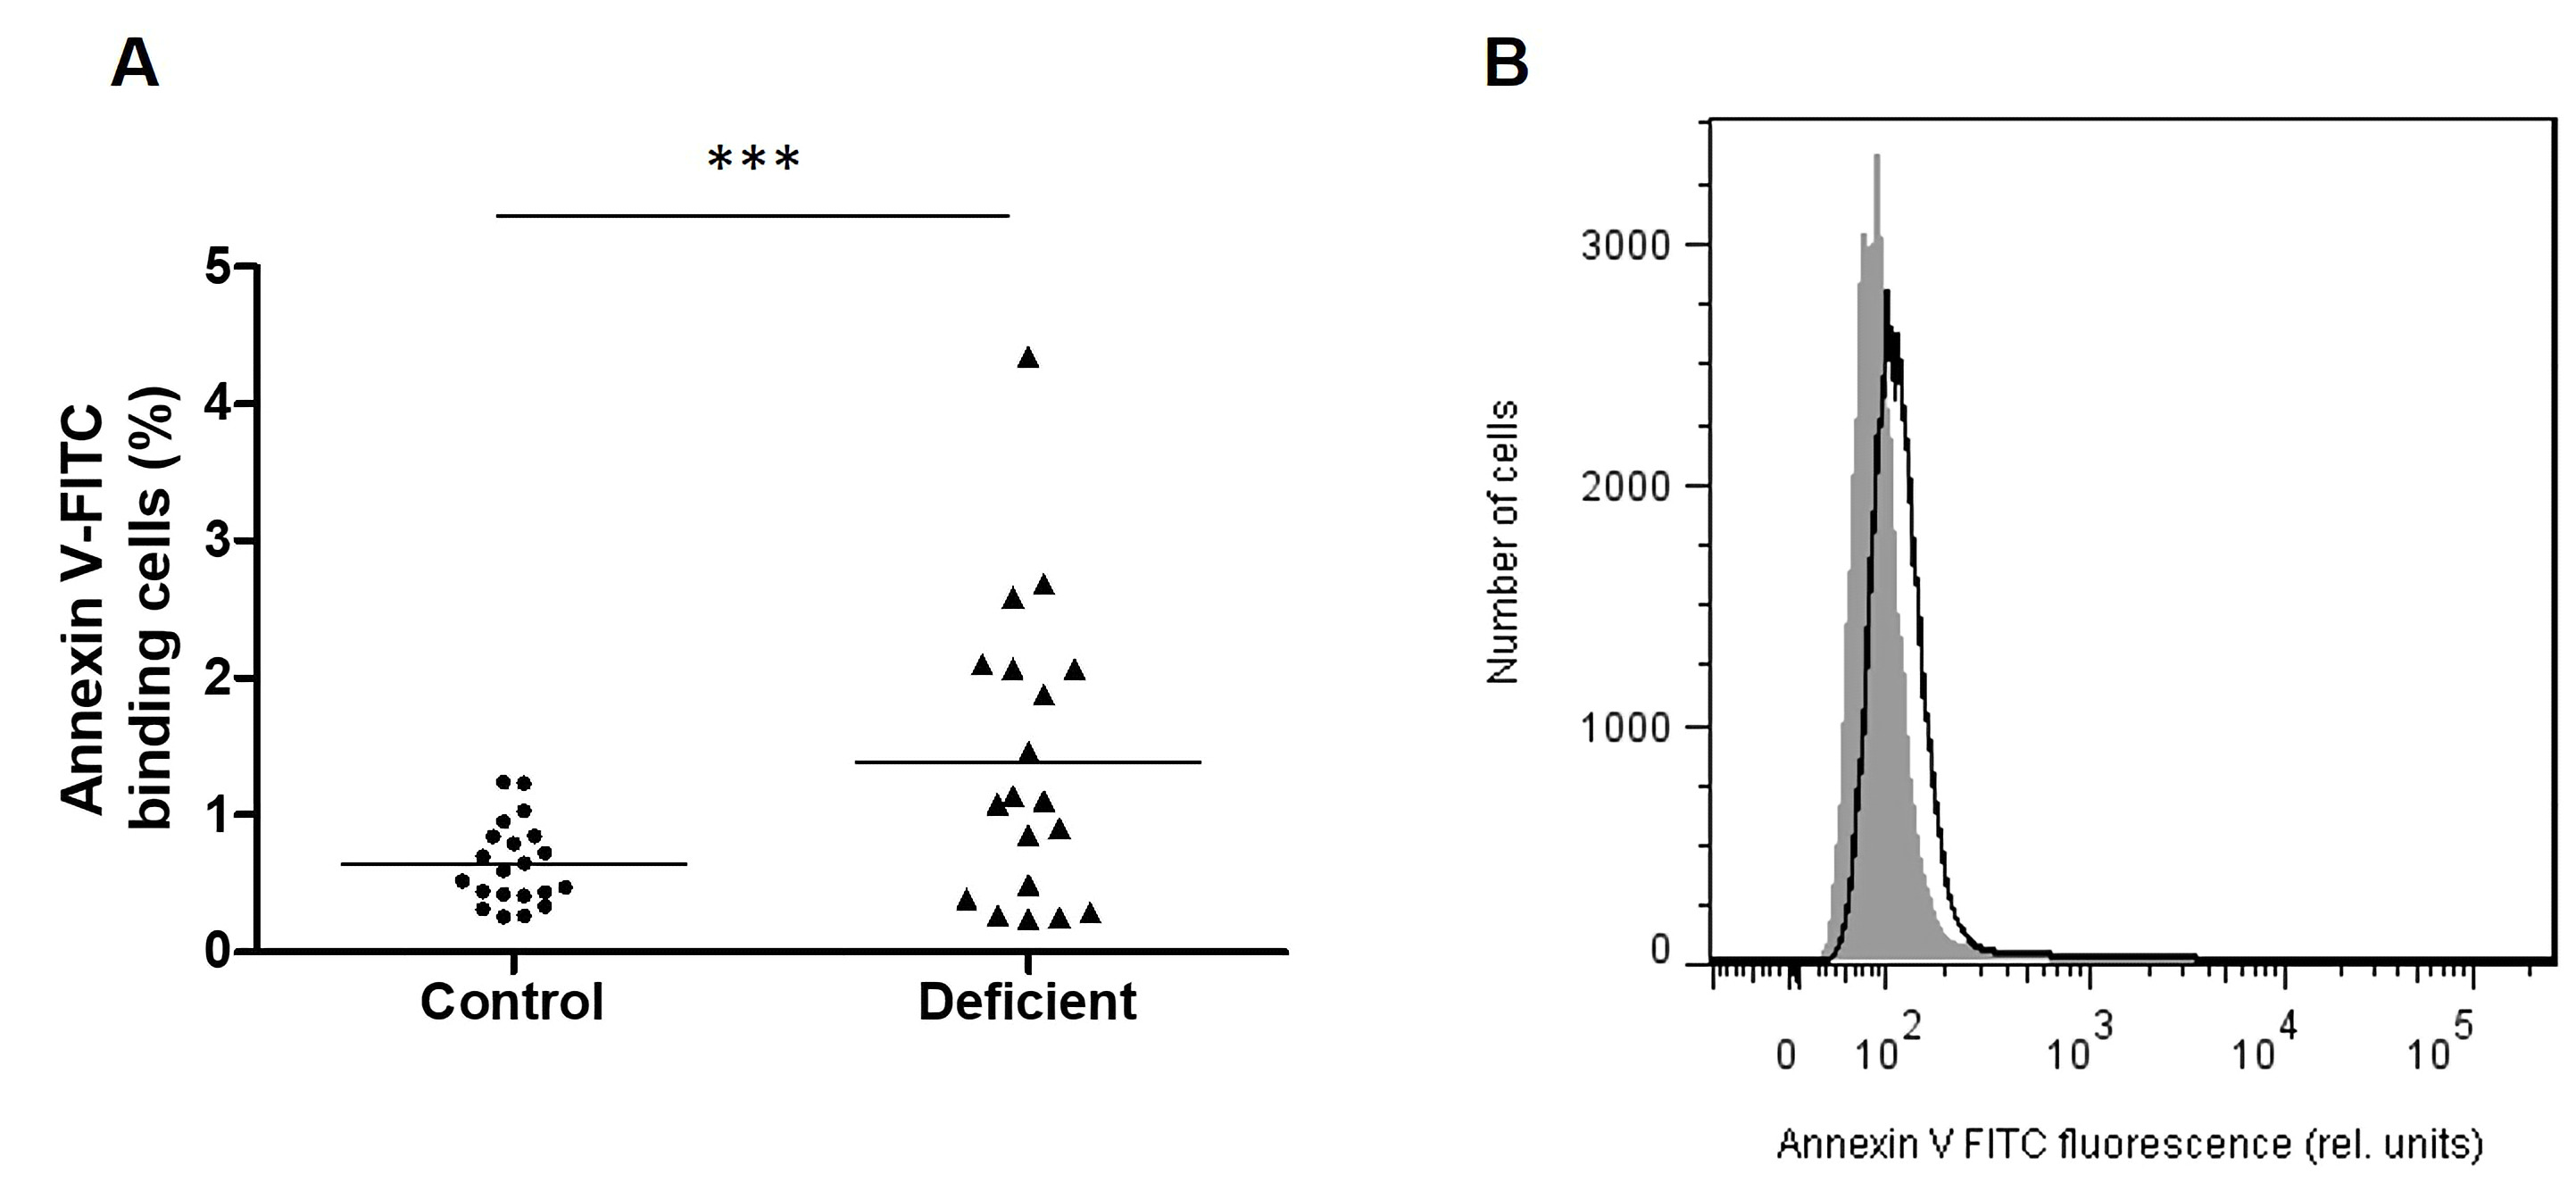
In this study, we explore eryptosis in G6PD-deficient patients through the quantification of PS exposure at the cell surface. We further examine the signaling pathways orchestrating the enhanced eryptosis in this pathological context. Finally, we study the G6PD gene in order to investigate the potential correlation between G6PD genetic variants and enhanced eryptosis in G6PD-deficient patients.
Materials and Methods
Study Subjects
The study involved 19 subjects diagnosed with G6PD deficiency. Patients were chosen based on age (older than a year), transfusion status (no history of transfusion), and the absence of concomitant hematological disorders such as sickle cell anemia, thalassemia, and PK deficiency. The control group included 21 healthy volunteers. All patients and healthy volunteers gave their informed written consent per the recommendations of the ethical committee of the Pasteur Institute of Tunis and the declaration of Helsinki.
Hematological explorations
Blood samples were collected in EDTA-containing tubes. Complete blood counts (CBC) were obtained through a Pentra 60C+ analyzer (ABX Diagnostics, Montpelier, France).
Hemoglobin fractions analysis was carried out through capillary electrophoresis using a Capillarys 2 FLEX Piercing analyzer (Sebia, Evry, France).
G6PD activity was measured through quantitative spectrophotometric analysis of the rate of NADPH production from NADP as previously described [34]. G6PD activity was considered normal when ranging between 5.26 IU/g of Hb and 7.94 IU/g of Hb.
Flow Cytometry
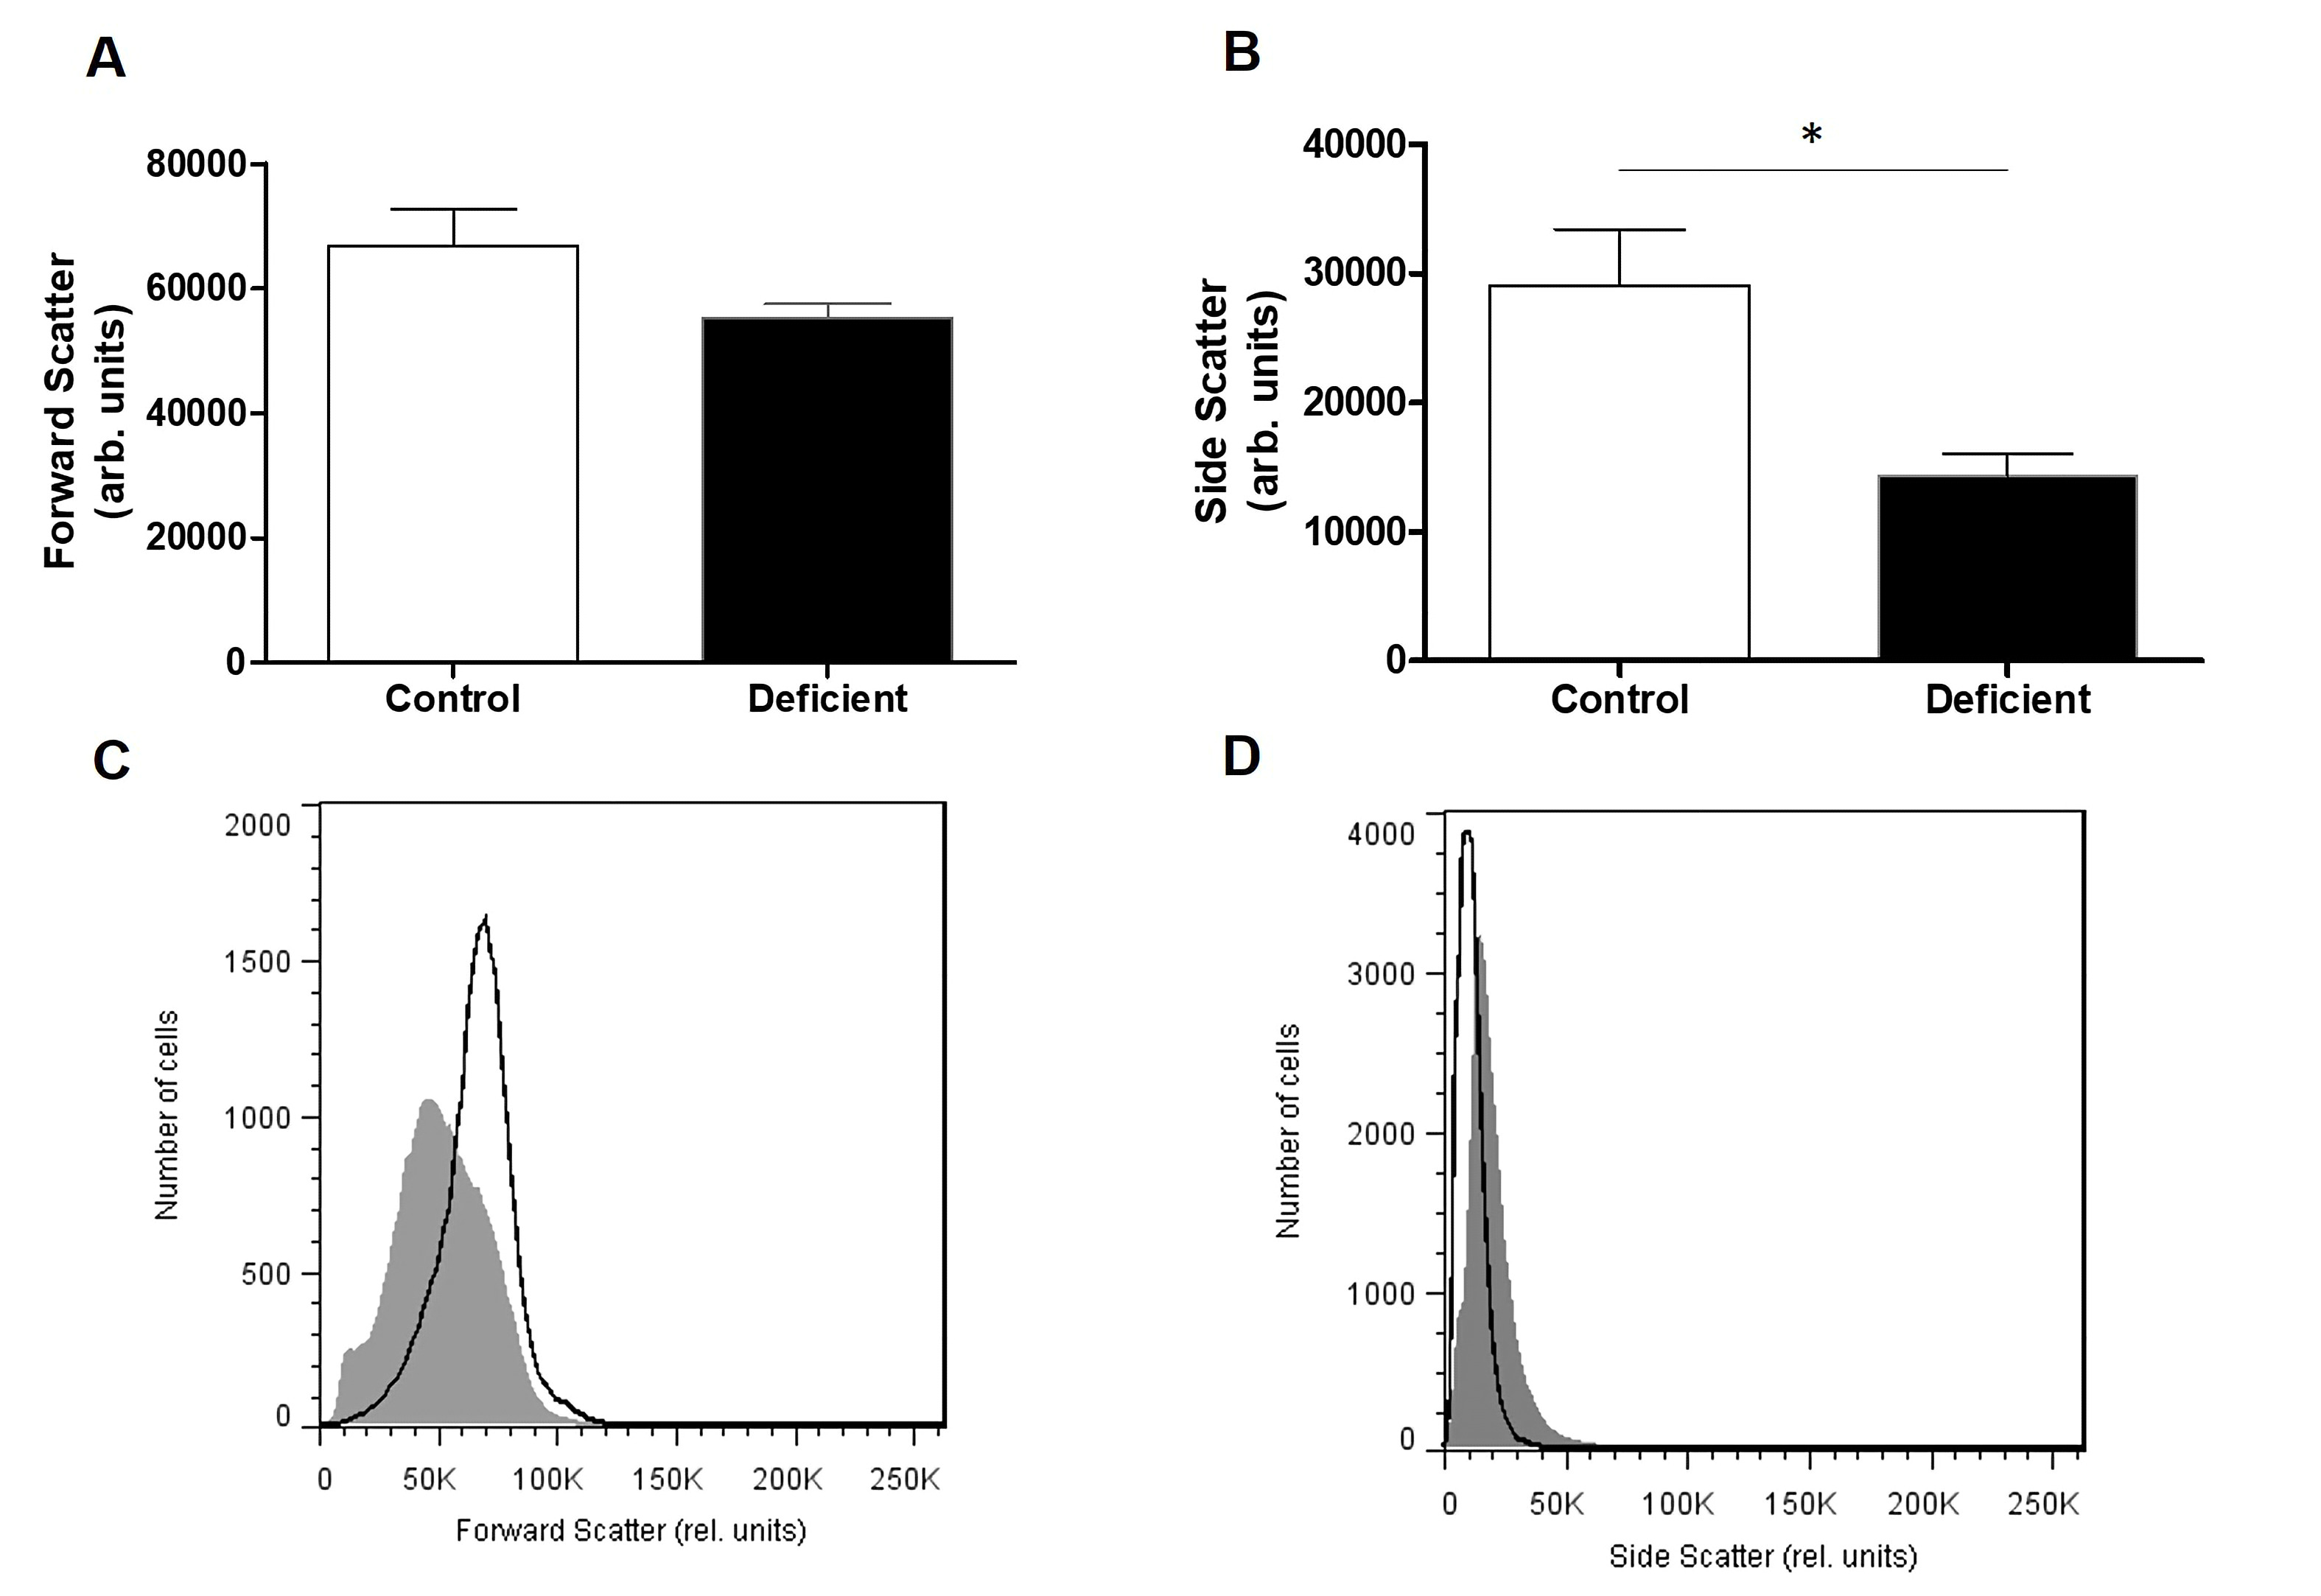
Flow cytometry experimental procedures were performed as previously described by Jemaà et. al [35]. Data acquisition was carried out on 50,000 cells for each sample. For all experiments, fluorescence was measured with an excitation wavelength of 488 nm and an emission wavelength of 530 nm in a logarithmic scale using the flow cytometer FACS Canto II (BD Biosciences, France). Forward scatter (FSC) and Side Scatter (SSC) were determined on a linear scale. An arbitrary threshold was set at 5000 in order to exclude cellular debris.
Pretreatment of Samples. Blood samples were centrifuged at 500xg for 20 minutes and the leucocytes and platelets containing supernatant was discarded. Erythrocytes were resuspended in Ringer solution (pH 7.4) containing 125 mM NaCl, 5 mM KCl,1 mM MgSO4, 32 mM N-2-hydroxyethylpiperazine-N-2-ethanesulfonic acid (HEPES), 5 mM glucose and 1 mM CaCl2 at 0.4% hematocrit. All incubations were performed at 37°C.
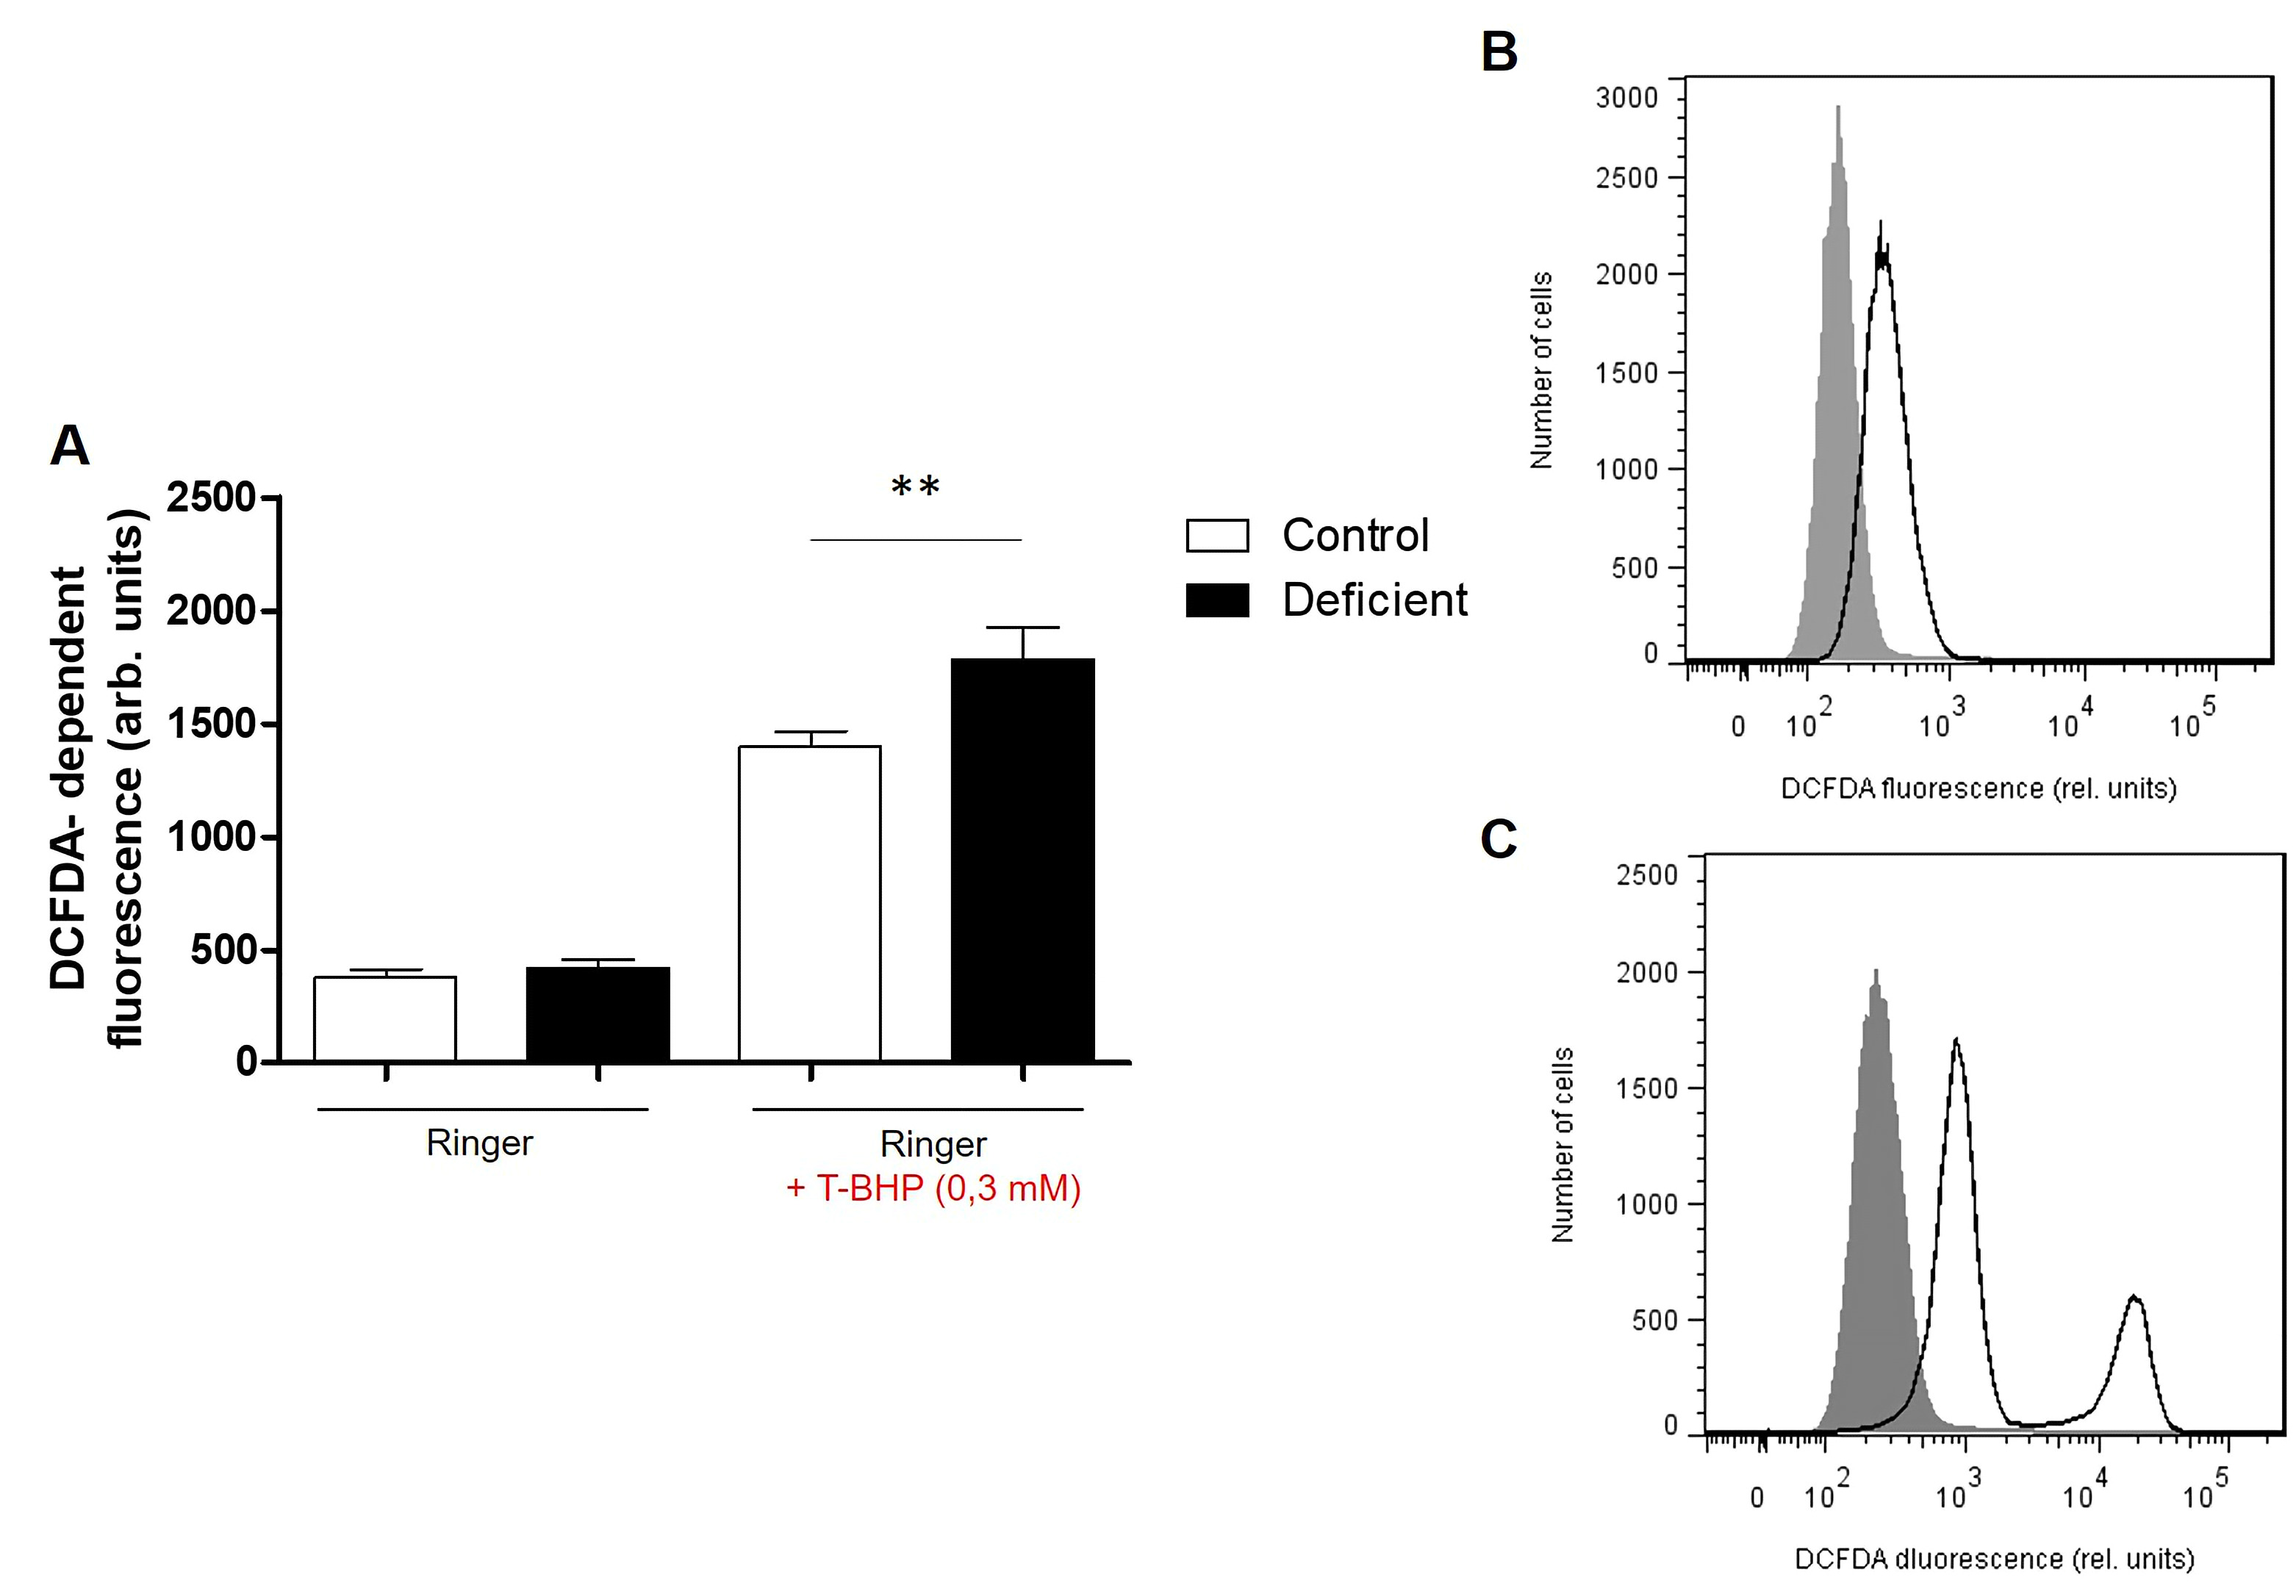
Where indicated, oxidative stress was induced by the addition of 0.3 mM tetra-butyl-hydroxyperoxide (TBHP, Sigma Aldrich, Germany) to Ringer solution, followed by the incubation of samples for 1 hour at 37°C. Similarly, opening of Ca2+ channels was induced by the addition of 1 μM of the calcium ionophore Ionomycin (Sigma Aldrich, Germany) in dimethyl sulfoxide (DMSO) to Ringer solution, followed by the incubation of samples for 2 hours at 37°C.
Annexin-V binding assay. Annexin-V binding was determined in freshly-drawn blood. For this purpose, a suspension of 150 µl from each sample was centrifuged at 1600 rpm for 3 min. Cells were subsequently stained with annexin-V-FITC (1:200 dilution in Ringer solution containing 5 mM CaCl2; BD Biosciences, France) and incubated at 37°C for 15 min under protection from light.
A marker was placed in order to separate annexin-V-binding cells from control cells.
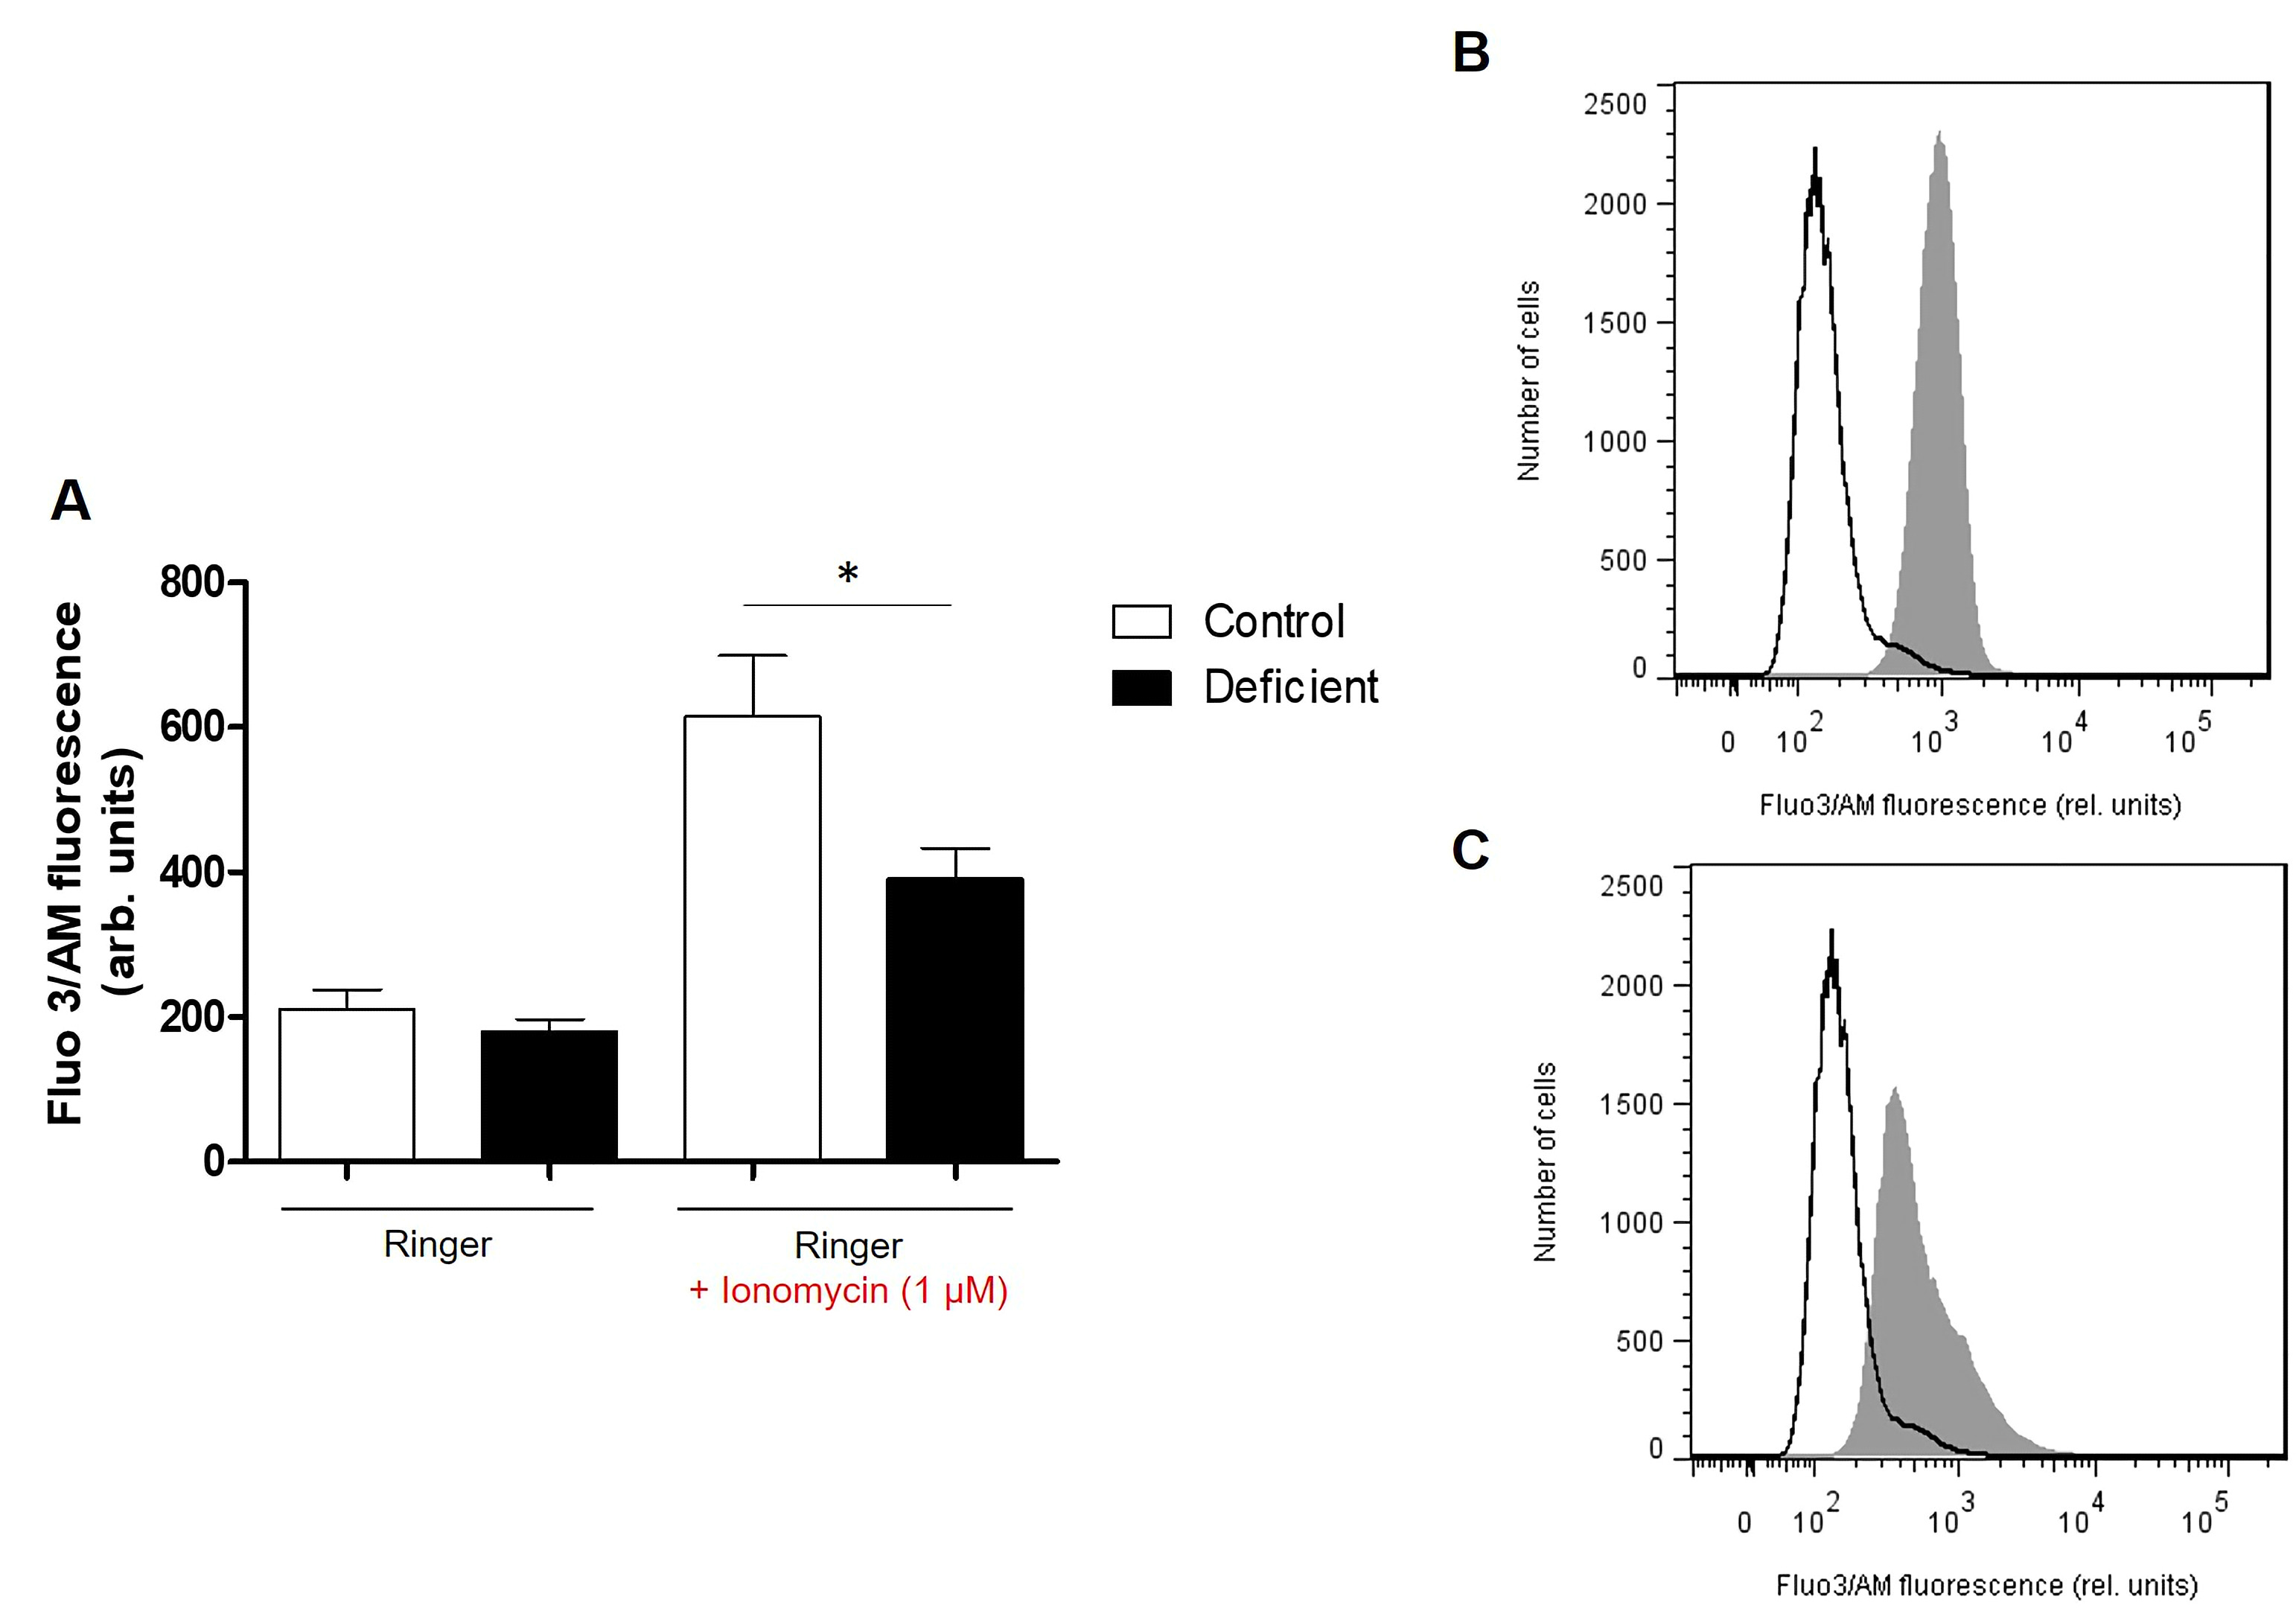
Assessment of intracellular Ca2+. Intracellular Calcium was determined through Fluo3/AM assay. Cells were washed in Ringer solution containing 5 mM CaCl2, pelleted and then loaded with 5 μM Fluo3/AM (Sigma Aldrich, Germany). Pellets were incubated at 37°C for 30 min then resuspended in Ringer solution.
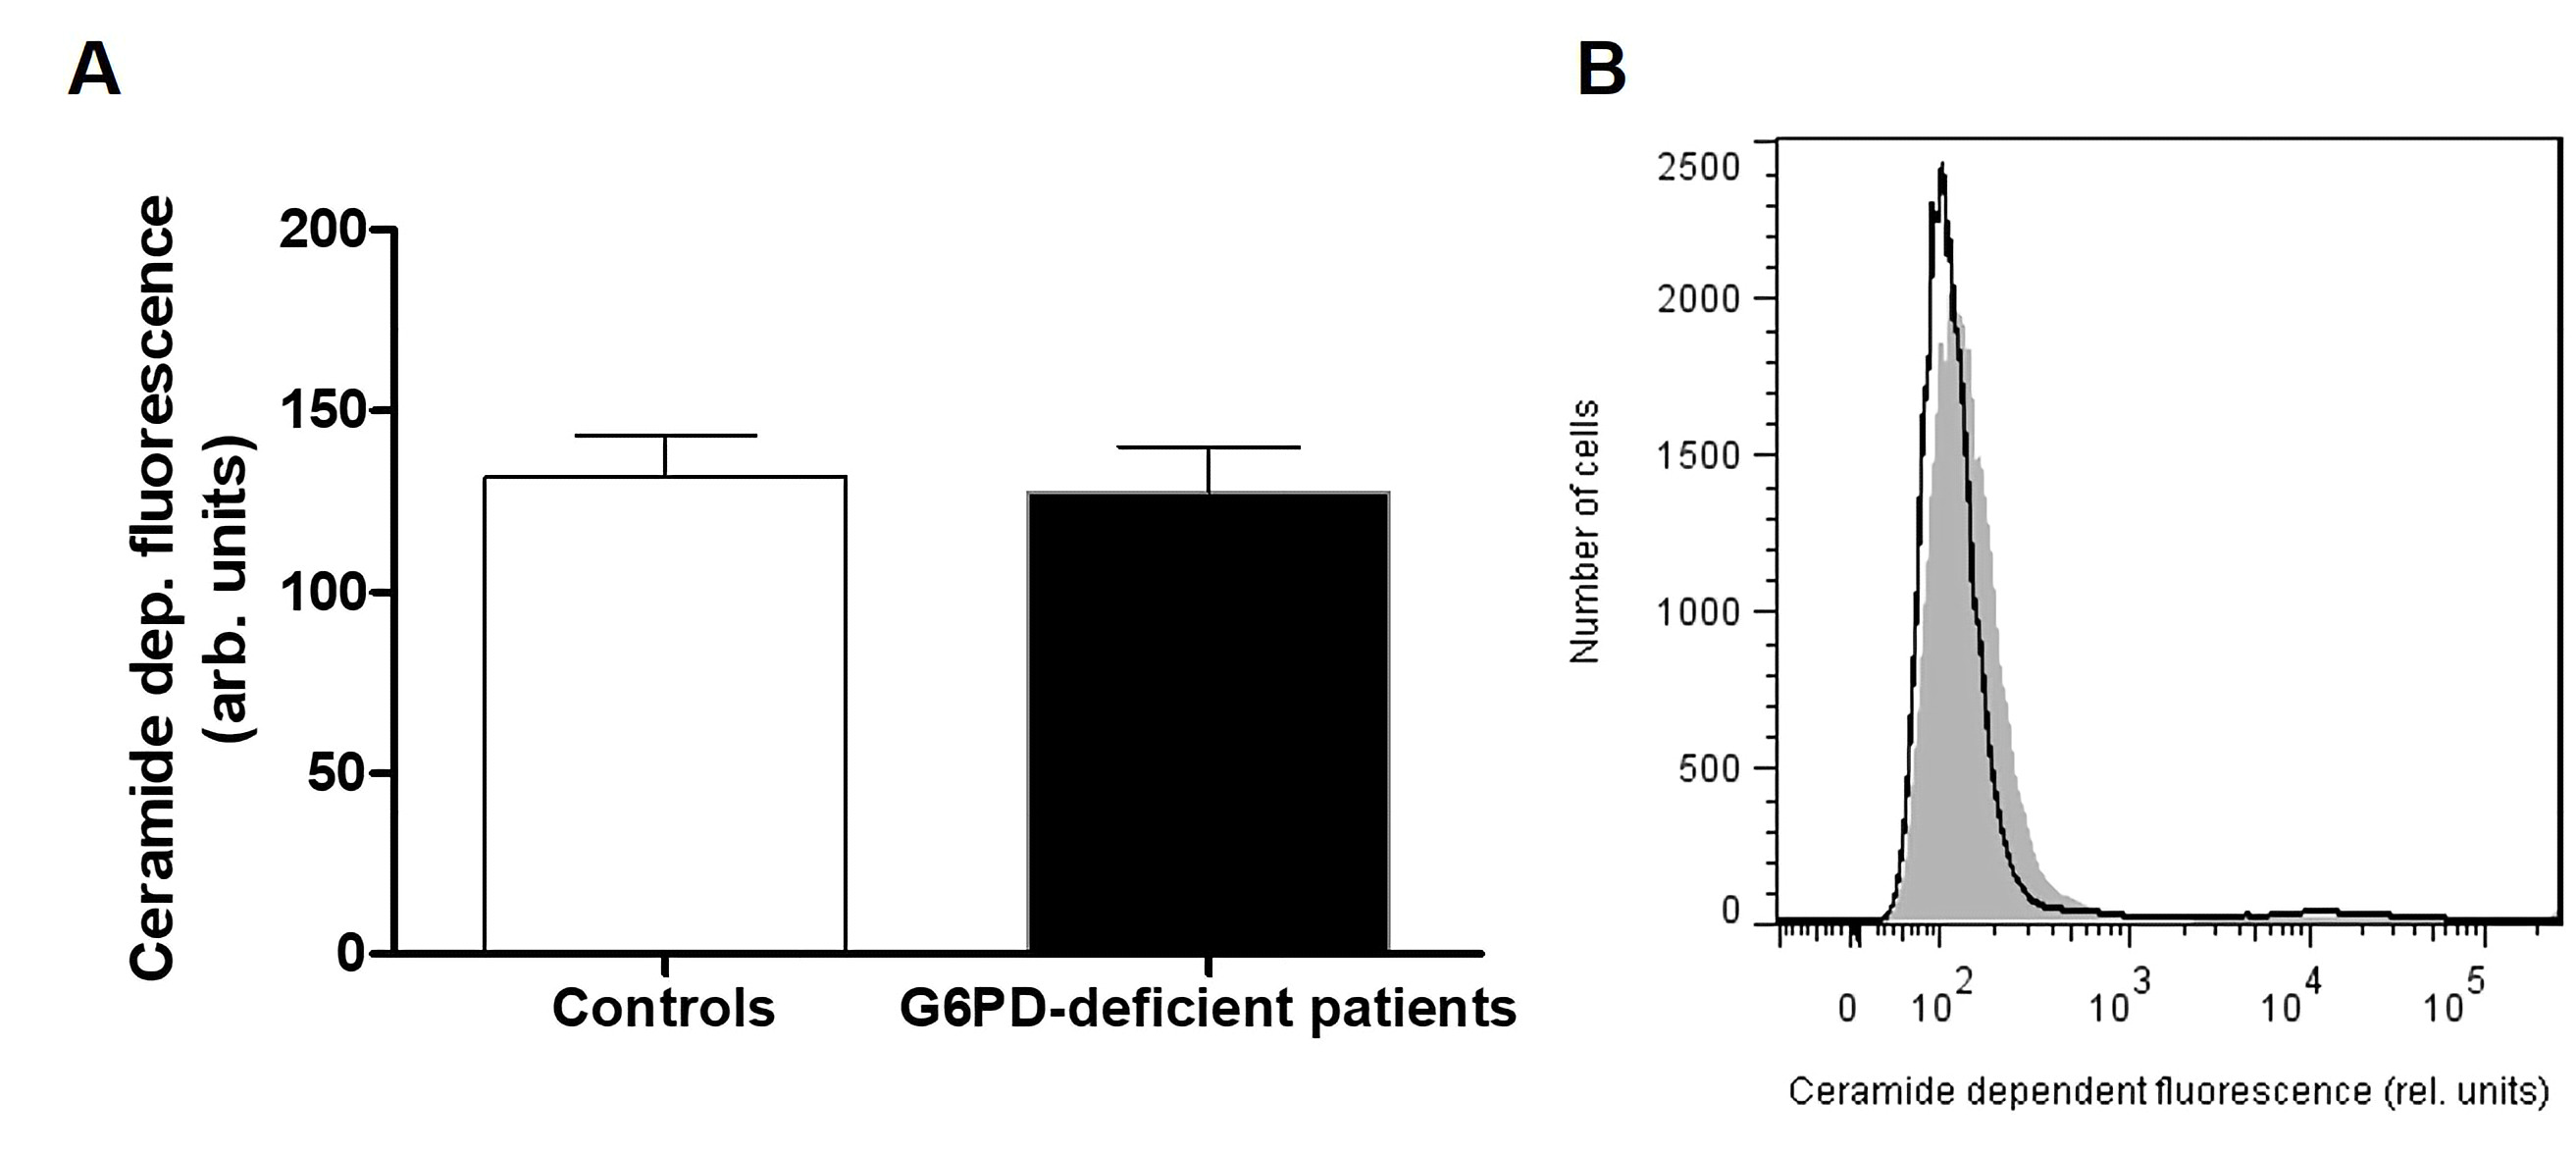
Ceramide formation at the cell surface. Cells were stained for 1 hour at 37°C with 1 µg/ml monoclonal anti-ceramide antibody (clone MID 15B4, Sigma Aldrich, Germany) in PBS containing 0.1 % bovine serum albumin BSA at a dilution of 1:10. The samples were washed twice with PBS-BSA. Subsequently, the cells were stained for 30 min with polyclonal fluorescein isothiocyanate (FITC) conjugated goat anti-mouse IgG and IgM antibody (BD Biosciences, Belgium) diluted 1:50 in PBS-BSA. Unbound secondary antibody was removed by washing twice with PBS-BSA.
Reactive Oxygen Species quantification. Oxidative stress was determined using 2’,7’-dichlorodihydrofluorescein diacetate (DCFDA). After incubation, a 150 µl suspension was washed in Ringer solution and then stained with DCFDA (Thermo Fisher, France) in Ringer solution containing DCFDA at a final concentration of 10 µM. Erythrocytes were incubated at 37°C for 30 min in the dark and then washed three times in Ringer solution.
PCR-Sanger sequencing
Genomic DNA was extracted from peripheral blood using the standard phenol-chloroform method [36]. Mutations spanning the G6PD gene were determined by polymerase chain reaction (PCR) followed by Sanger Sequencing. A screening of the entire coding sequence of the gene (exons 2 to13) was carried out using the primer pairs listed in Table 1. PCR was carried-out in a 25μl mixture containing 50 μg of genomic DNA; 10X PCR buffer; 10 mM dNTPs; 20 μM of each primer; 25 mM MgCl2; 5 IU Taq polymerase and ultrapure H2O. Reaction conditions were as follows: 95˚C for 5 min, followed by 35 cycles of denaturation at 95˚C for 30 sec, annealing at 58°C for 30 Sec (exon 13), at 60°C for 45 sec (exon2, 6-7 and 8), at 62°C for 30 sec (exon 10-12), at 65°C for 30 sec (exon 3-4, 5 and 9), and an extension at 72˚C for 45 sec. The final extension was performed at 72˚C for 7 min.
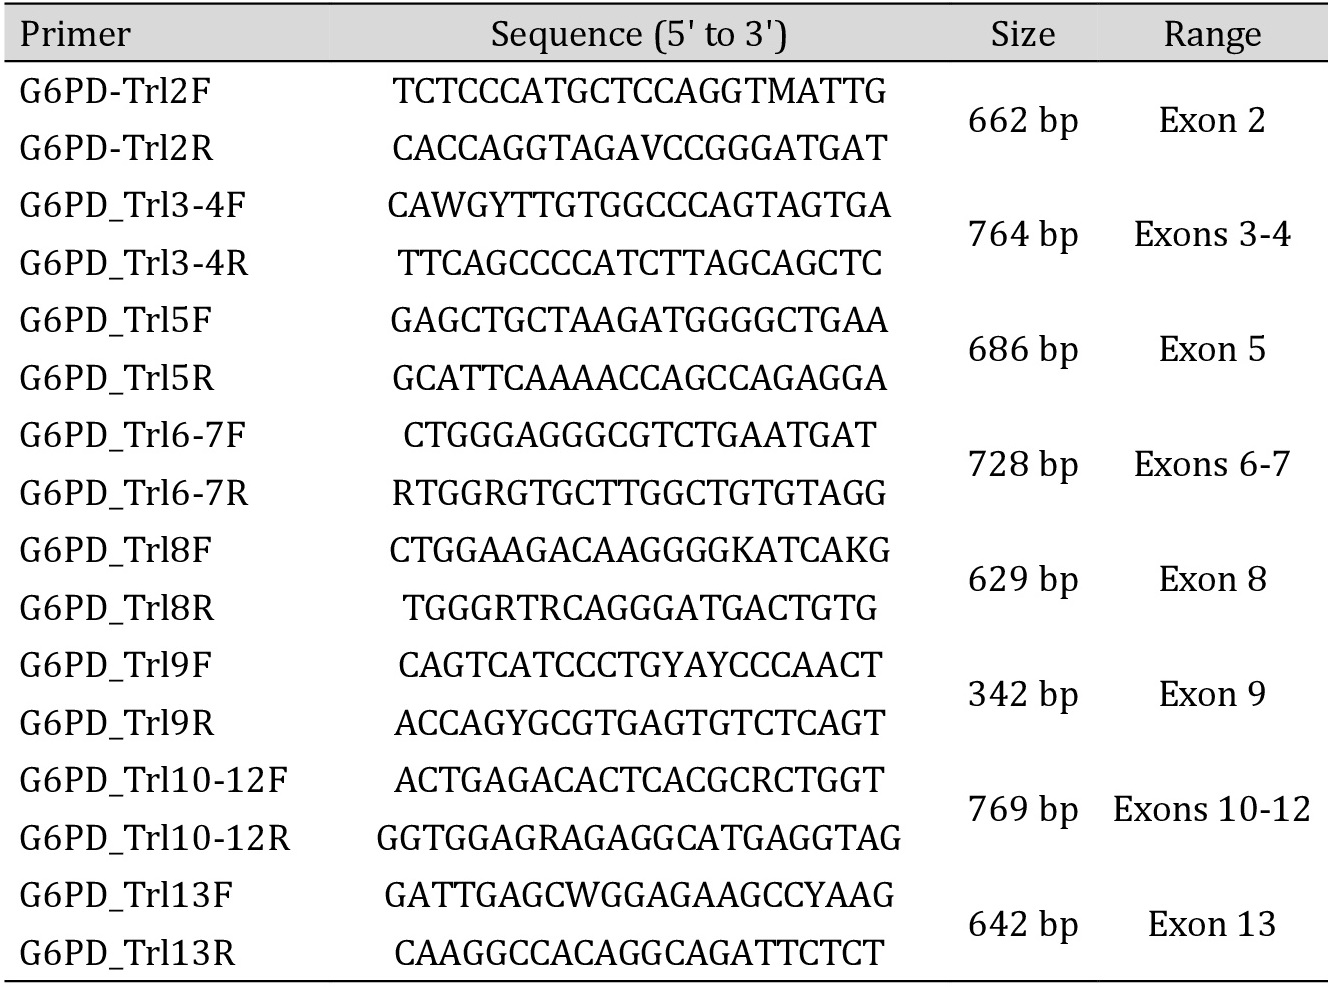
Primer sequences used in the molecular exploration of the G6PD gene
Statistics
Data are expressed as arithmetic means ± Standard Deviation (SD). In order to determine statistical significance between groups, Mann-Whitney test, or ANOVA test with Tukey’s test as post-test were performed as appropriate using GraphPad Prism version 5.00 (GraphPad Software, USA). For all experiments, n denotes the number of individuals and the threshold of significance was set at p<0.05.
Results
Hematological data
Except for two individuals who had microcytosis, most patients showed normal hematological indices, as shown in Table 2.
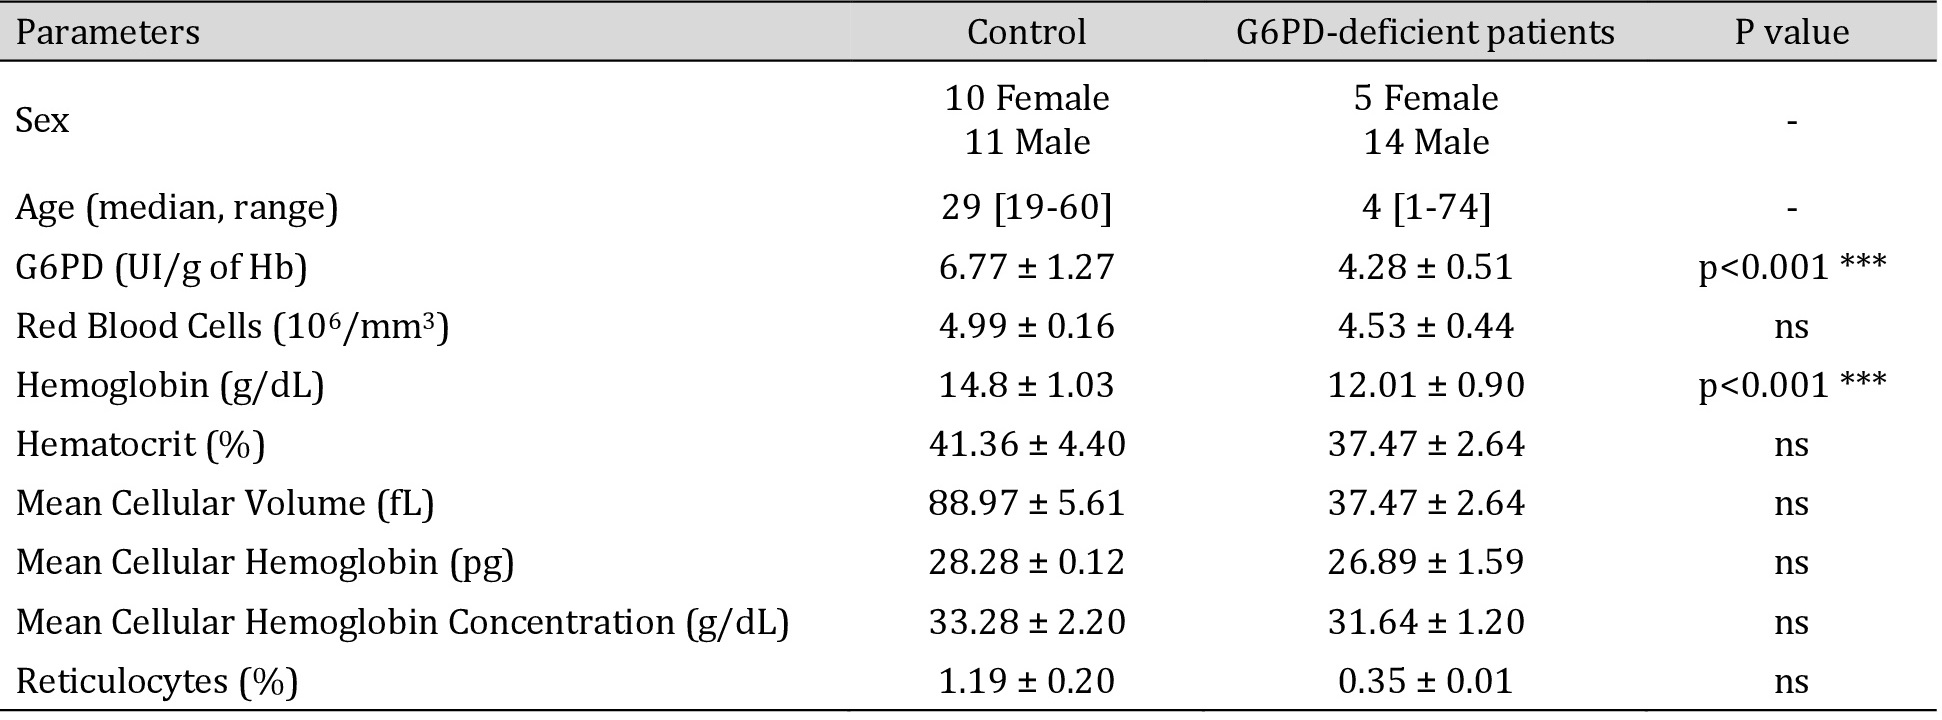
Hematological data of healthy volunteers and G6PD-deficient patients. ***p<0.001 indicates a significate difference in the G6PD-deficient group compared to healthy volunteers
Molecular Findings
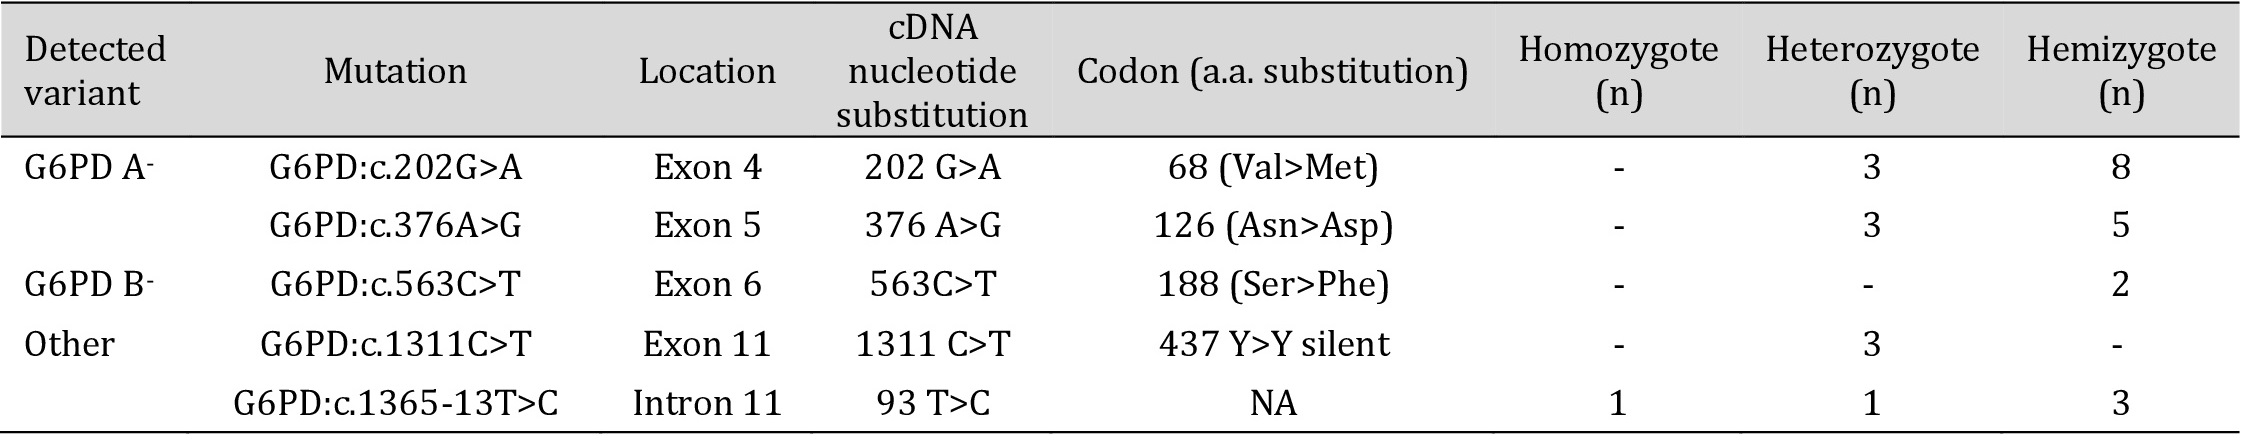
DNA sequencing of the G6PD gene revealed a total of five previously-described mutations, accounting for the enzymatic deficiency in our subjects. The most frequently-encountered mutation, G6PD: c.202G>A, associated with the African variant A-, was found in eleven patients (0.53), including eight hemizygous males as well as in three heterozygous females. The second mutation accounting for the African variant G6PD: c.376A>G, was found in a total of eight patients (0.33), five of whom were hemizygous males, and three were heterozygous females.
The G6PD: c.563C>T mutation, associated with the Mediterranean variant, was only found in two males in the hemizygous form (0.13).
Furthermore, DNA sequencing revealed the presence of two rare mutations. The first was a substitution in exon 11, G6PD: c.1311C>T, which was only found in the heterozygous form in three females. The second was an intronic mutation, G6PD: c.1365-13T>C, encountered in one heterozygous female, one homozygous female, and three hemizygous males. Allele frequencies, calculated only for male patients, are summarized in Table 3.
No mutations spanning the entire coding sequence of the G6PD gene were detected in three deficient patients, all-male.
Allele frequencies of G6PD mutations in G6PD-deficient male patients
Phenotype-Genotype correlations
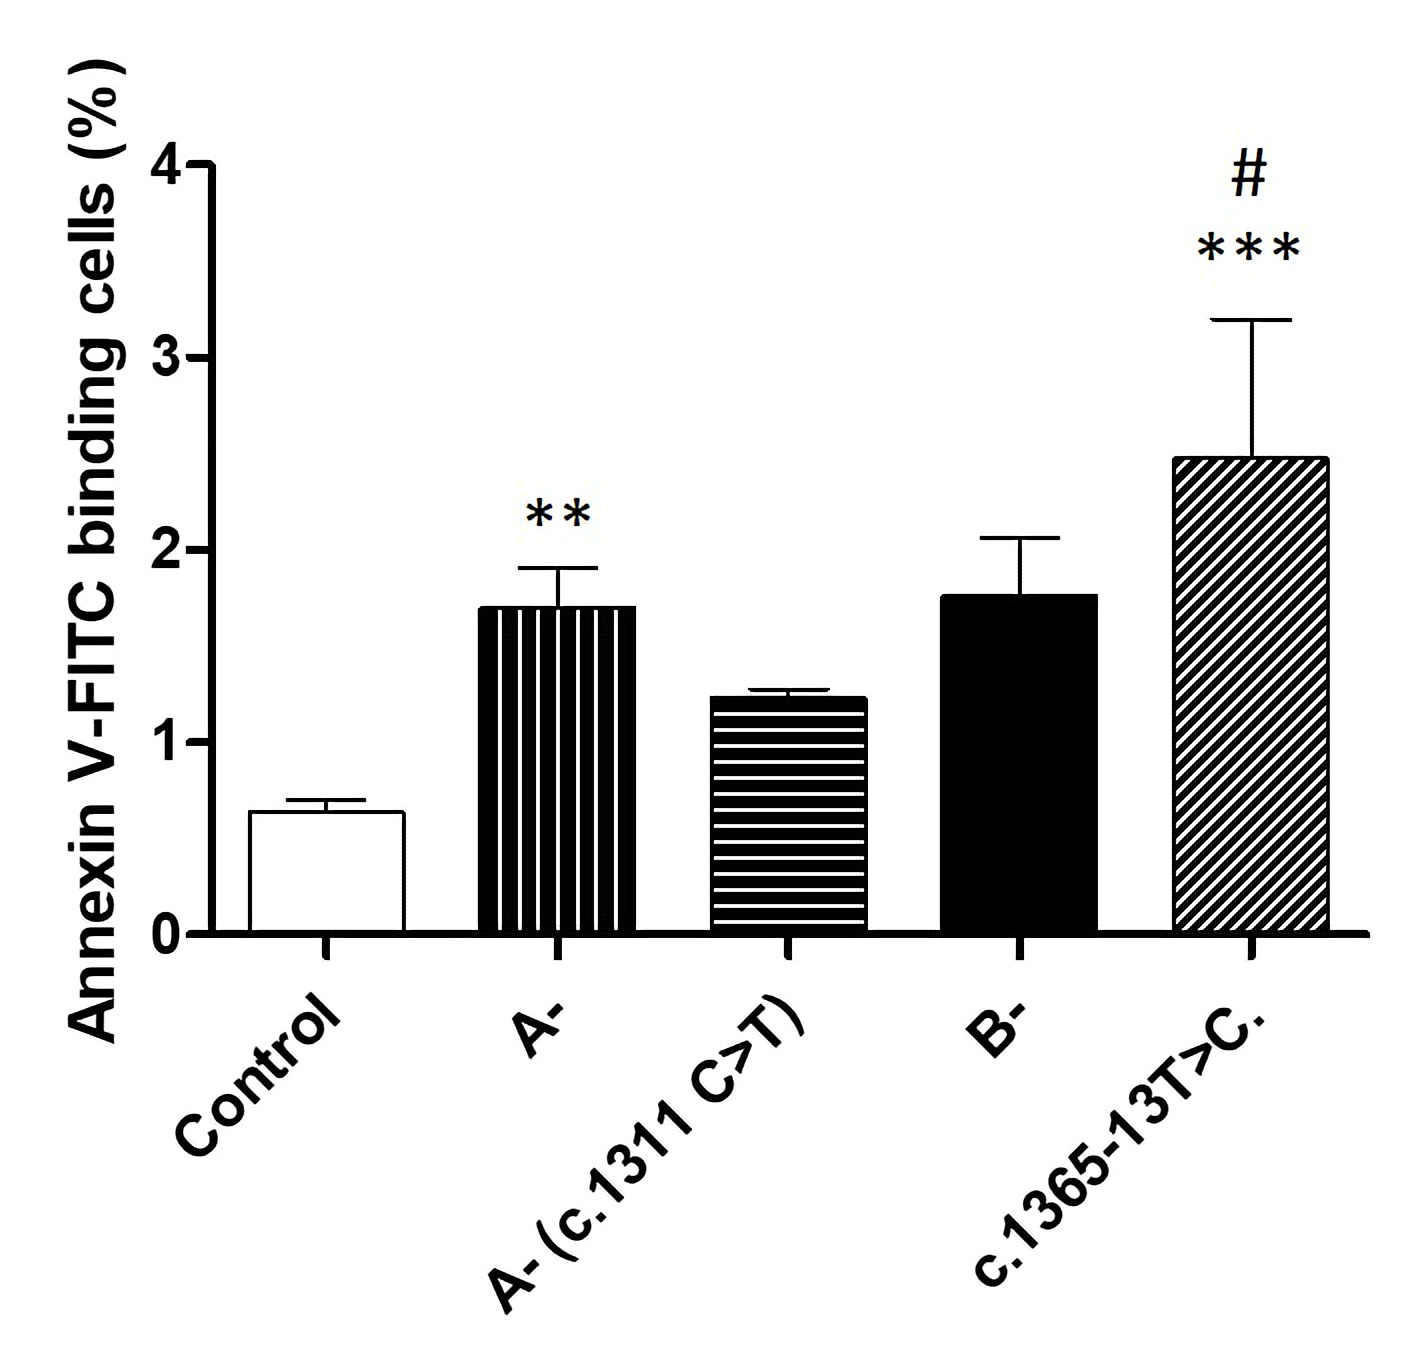
Due to lionization, female patients present with heterogeneous erythrocytes. To further explore the impact of G6PD genetic variants on eryptosis, we excluded female patients from further analysis. We separated male G6PD-deficient patients into four groups according to their genotypes. The first group encompassed seven patients who presented with the African variant A-. The second included three patients presenting with the African variant as well as the c.1311 C>T mutation. The third group included only two patients who presented with the Mediterranean variant B-. Finally, the fourth group included four patients presenting with the intronic mutation c.1365-13T>C.
Compared to erythrocytes taken from healthy individuals, cells taken from patients belonging to the first and the fourth group presented a significantly higher percentage of annexin-V binding cells (Fig. 6). Furthermore, cells taken from the fourth group showed the highest percentage of annexin-V binding cells, compared to all groups, and seem to present significantly higher annexin-V binding cells when compared to the A- group.
Author Contributions
B.G. designed the project, carried out the experiments and wrote the manuscript. T.K. assisted with in vitro cell experiments and data collection. T.N. participated in flow cytometry data analysis and critical discussion of the study. C.D. and B.I. assisted in the collection of samples and G6PD enzymatic activity measurements. A.S. supervised in vitro experiments and manuscript preparation. M.S. supervised and assisted in critical discussions of the study.
Funding Sources
This research did not receive any specific grant from funding agencies in the public, commercial, or not-for-profit sectors.
Statement of Ethics
All patients and healthy volunteers gave their informed written consent per the recommendations of the ethical committee of the Pasteur Institute of Tunis and the declaration of Helsinki.
The authors declare that no conflicts of interest exist.
| 1 Beutler E: Glucose-6-phosphate dehydrogenase deficiency. In Hemolytic anemia in disorders of red cell metabolism, Springer, Boston, MA, 1978, pp. 23-167. https://doi.org/10.1007/978-1-4684-2457-7_2 |
||||
| 2 Beutler E: The genetics of glucose-6-phosphate dehydrogenase deficiency. Semin Hematol 1990;27:137-164. | ||||
| 3 Kaplan M, Hammerman C, Vreman HJ, Stevenson DK, Beutler E: Acute hemolysis and severe neonatal hyperbilirubinemia in glucose-6-phosphate dehydrogenase-deficient heterozygotes. J Pediatr 2001;139:137-140. https://doi.org/10.1067/mpd.2001.115312 |
||||
| 4 Meloni T, Forteleoni G, Dore A, Cutillo S: Favism and Hemolytic Anemia in Glucose-6-Phosphate Dehydrogenase-Deficient Subjects in North Sardinia. Acta Haematol 1983;70:83-90. https://doi.org/10.1159/000206700 |
||||
| 5 Fiorelli G, Martinez di Montemuros F, Cappellini MD: Chronic non-spherocytic haemolytic disorders associated with glucose-6-phosphate dehydrogenase variants. Best Pract Res Clin Haematol 2000;13:39-55. https://doi.org/10.1053/beha.1999.0056 |
||||
| 6 Beutler E: The Hemolytic Effect of Primaquine and Related Compounds: a Review. Blood 1959;14:103-139. https://doi.org/10.1182/blood.V14.2.103.103 |
||||
| 7 Siddiqui T, Khan AH: Hepatitis A and Cytomegalovirus Infection Precipitating Acute Hemolysis in Glucose-6-Phosphate Dehydrogenase Deficiency. Mil Med 1998;163:434-435. https://doi.org/10.1093/milmed/163.6.434 |
||||
| 8 Kattamis CA, Kyriazakou M, Chaidas S: Favism: clinical and biochemical data. J Med Genet 1969;6:34-41. https://doi.org/10.1136/jmg.6.1.34 |
||||
| 9 Carson PE, Flanagan CL, Ickes CE, Alving AS: Enzymatic Deficiency in Primaquine-Sensitive Erythrocytes. Science 1956;124:484-485. https://doi.org/10.1126/science.124.3220.484-b |
||||
| 10 Kruger NJ, von Schaewen A: The oxidative pentose phosphate pathway: structure and organisation. Curr Opin Plant Biol 2003;6:236-246. https://doi.org/10.1016/S1369-5266(03)00039-6 |
||||
| 11 Pandolfi PP, Sonati F, Rivi R, Mason P, Grosveld F, Luzzatto L: Targeted disruption of the housekeeping gene encoding glucose 6-phosphate dehydrogenase (G6PD): G6PD is dispensable for pentose synthesis but essential for defense against oxidative stress. EMBO J 1995;14:5209-5215. https://doi.org/10.1002/j.1460-2075.1995.tb00205.x |
||||
| 12 Çimen MYB: Free radical metabolism in human erythrocytes. Clinica Chimica Acta 2008;390:1-11. https://doi.org/10.1016/j.cca.2007.12.025 |
||||
| 13 Cheng M, Ho H, Wu Y, Chiu DTY: Glucose-6-phosphate dehydrogenase-deficient cells show an increased propensity for oxidant-induced senescence. Free Radic Biol Med 2004;36:580-591. https://doi.org/10.1016/j.freeradbiomed.2003.11.031 |
||||
| 14 Corash L, Spielberg S, Bartsocas C, Boxer L, Steinherz R, Sheetz M, Egan M, Schlessleman J, Schulman JD: Reduced Chronic Hemolysis during High-Dose Vitamin E Administration in Mediterranean-Type Glucose-6-Phosphate Dehydrogenase Deficiency. N Engl J Med 1980;303:416-420. https://doi.org/10.1056/NEJM198008213030802 |
||||
| 15 Childs B, Zinkham W, Browne E, Kimbro E, Torbert J: A genetic study of a defect in glutathione metabolism of the erythrocyte. Bull Johns Hopkins Hosp 1958;102:21-37. | ||||
| 16 Minucci A, Moradkhani K, Hwang MJ, Zuppi C, Giardina B, Capoluongo E: Glucose-6-phosphate dehydrogenase (G6PD) mutations database: Review of the "old" and update of the new mutations. Blood Cells Mol Dis 2012;48:154-165. https://doi.org/10.1016/j.bcmd.2012.01.001 |
||||
| 17 Nkhoma ET, Poole C, Vannappagari V, Hall SA, Beutler E: The global prevalence of glucose-6-phosphate dehydrogenase deficiency: A systematic review and meta-analysis. Blood Cells Mol Dis 2009;42:267-78. https://doi.org/10.1016/j.bcmd.2008.12.005 |
||||
| 18 Yoshida A: Human glucose 6-phosphate dehydrogenase: purification and characterization of Negro type variant (A+) and comparison with normal enzyme (B+). Biochem Genet 1967;1:81-99. https://doi.org/10.1007/BF00486511 |
||||
| 19 Town M, Bautista J, Mason P, Luzzatto L: Both mutations in G6PD A- are necessary to produce the G6PD deficient phenotype. Hum Mol Genet 1992;1:171-174. https://doi.org/10.1093/hmg/1.3.171 |
||||
| 20 Piomelli S, Corash LM, Davenport DD, Miraglia J, Amorosi EL: In vivo lability of glucose-6-phosphate dehydrogenase in GdA- and Gdmediterranean deficiency. J Clin Invest 1968;47:940-948. https://doi.org/10.1172/JCI105786 |
||||
| 21 Föller M, Huber SM, Lang F: Erythrocyte programmed cell death. IUBMB Life 2008;60:661-668. https://doi.org/10.1002/iub.106 |
||||
| 22 Bosman GJCGM, Willekens FLA, Werre JM: Erythrocyte Aging: A More than Superficial Resemblance to Apoptosis? Cell Physiol Biochem 2005;16:1-8. https://doi.org/10.1159/000087725 |
||||
| 23 Bogdanova A, Makhro A, Wang J, Lipp P, Kaestner L: Calcium in Red Blood Cells-A Perilous Balance. Int J Mol Sci 2013;14:9848-9872. https://doi.org/10.3390/ijms14059848 |
||||
| 24 Lang KS, Duranton C, Poehlmann H, Myssina S, Bauer C, Lang F, Wieder T, Huber SM: Cation channels trigger apoptotic death of erythrocytes. Cell Death Differ 2003;10:249-256. https://doi.org/10.1038/sj.cdd.4401144 |
||||
| 25 Daugas E, Candé C, Kroemer G: Erythrocytes: Death of a mummy. Cell Death Differ 2001;8:1131-1133. https://doi.org/10.1038/sj.cdd.4400953 |
||||
| 26 Mandal D, Mazumder A, Das P, Kundu M, Basu J: Fas-, Caspase 8-, and Caspase 3-dependent Signaling Regulates the Activity of the Aminophospholipid Translocase and Phosphatidylserine Externalization in Human Erythrocytes. J Biol Chem 2005;280:39460-39467. https://doi.org/10.1074/jbc.M506928200 |
||||
| 27 Lang F, Abed M, Lang E, Föller M: Oxidative Stress and Suicidal Erythrocyte Death. Antioxid Redox Signal 2013;21:138-153. https://doi.org/10.1089/ars.2013.5747 |
||||
| 28 Schneider J, Nicolay JP, Föller M, Wieder T, Lang F: Suicidal Erythrocyte Death Following Cellular K+ Loss. Cell Physiol Biochem 2007;20:35-44. https://doi.org/10.1159/000104151 |
||||
| 29 Connor J, Pak CC, Schroit AJ: Exposure of phosphatidylserine in the outer leaflet of human red blood cells. Relationship to cell density, cell age, and clearance by mononuclear cells. J Biol Chem 1994;269:2399-2404. https://doi.org/10.1016/S0021-9258(17)41959-4 |
||||
| 30 Nguyen DB, Wagner-Britz L, Maia S, Steffen P, Wagner C, Kaestner L, Bernhardt I: Regulation of Phosphatidylserine Exposure in Red Blood Cells. Cell Physiol Biochem 2011;28:847-856. https://doi.org/10.1159/000335798 |
||||
| 31 Fadok VA, Savill JS, Haslett C, Bratton DL, Doherty DE, Campbell PA, Henson PM: Different populations of macrophages use either the vitronectin receptor or the phosphatidylserine receptor to recognize and remove apoptotic cells. J Immunol 1992;149:4029-4035. | ||||
| 32 Bratosin D, Mazurier J, Slomianny C, Aminoff D, Montreuil J: Molecular mechanisms of erythrophagocytosis: Flow cytometric quantitation of in vitro erythrocyte phagocytosis by macrophages. Cytometry 1997;30:269-274. https://doi.org/10.1002/(SICI)1097-0320(19971015)30:5<269::AID-CYTO8>3.0.CO;2-C |
||||
| 33 Lang K, Roll B, Myssina S, Schittenhelm M, Scheel-Walter HG, Kanz L, Fritz J, Lang F, Huber S, Wieder T: Enhanced Erythrocyte Apoptosis in Sickle Cell Anemia, Thalassemia and Glucose-6-Phosphate Dehydrogenase Deficiency. Cell Physiol Biochem 2002;12:365-372. https://doi.org/10.1159/000067907 |
||||
| 34 Halliwell B: Red cell metabolism. FEBS Let 1985;190:173-179. https://doi.org/10.1016/0014-5793(85)80453-1 |
||||
| 35 Jemaà M, Fezai M, Bissinger R, Lang F: Methods Employed in Cytofluorometric Assessment of Eryptosis, the Suicidal Erythrocyte Death. Cell Physiol Biochem 2017;43:431-444. https://doi.org/10.1159/000480469 |
||||
| 36 Sambrook J, Russell DW: Purification of Nucleic Acids by Extraction with Phenol:Chloroform. CSH Protoc 2006; DOI:10.1101/pdb.prot4455. https://doi.org/10.1101/pdb.prot4455 |
||||
| 37 Fang Z, Jiang C, Tang J, He M, Lin X, Chen X, Han L, Zhang Z, Feng Y, Guo Y, Li H: A comprehensive analysis of membrane and morphology of erythrocytes from patients with glucose-6-phosphate dehydrogenase deficiency. J Struct Biol 2016;194:235-243. https://doi.org/10.1016/j.jsb.2015.10.015 |
||||
| 38 Hertz L, Huisjes R, Llaudet-Planas E, Petkova-Kirova P, Makhro A, Danielczok JG, Egee S, del Mar Mañú-Pereira M, Van Wijk R, Vives Corrons JL, Bogdanova A: Is Increased Intracellular Calcium in Red Blood Cells a Common Component in the Molecular Mechanism Causing Anemia? Front Physiol 2017;8:673. https://doi.org/10.3389/fphys.2017.00673 |
||||
| 39 Arese P, Gallo V, Pantaleo A, Turrini F: Life and Death of Glucose-6-Phosphate Dehydrogenase (G6PD) Deficient Erythrocytes - Role of Redox Stress and Band 3 Modifications. Transfus Med Hemother 2012;39:328-334. https://doi.org/10.1159/000343123 |
||||
| 40 De Jong K, Rettig MP, Low PS, Kuypers FA: Protein kinase C activation induces phosphatidylserine exposure on red blood cells. Biochemistry 2002;41:12562-125627. https://doi.org/10.1021/bi025882o |
||||
| 41 Mandal D, Moitra PK, Saha S, Basu J: Caspase 3 regulates phosphatidylserine externalization and phagocytosis of oxidatively stressed erythrocytes. FEBS Let 2002;513:184-188. https://doi.org/10.1016/S0014-5793(02)02294-9 |
||||
| 42 Gómez‐Gallego F, Garrido‐Pertierra A, Mason PJ, Bautista JM: Unproductive folding of the human G6PD-deficient variant A−. FASEB J 1996;10:153-158. https://doi.org/10.1096/fasebj.10.1.8566536 |
||||
| 43 Sirdah MM, Shubair ME, Al-Kahlout MS, Al-Tayeb JM, Prchal JT, Reading NS: Possible association of 3′ UTR +357 A>G, IVS11-nt 93 T>C, c.1311 C>T polymorphism with G6PD deficiency. Hematology 2017;22:370-374. https://doi.org/10.1080/10245332.2016.1276117 |
||||