×
![]()
Corresponding Author: Mark Donowitz
Department of Medicine and Department of Physiology, The Johns Hopkins University School of Medicine
Tel. +1 410 955 9675, E-Mail mdonowit@jhmi.edu
mOrange2, a Genetically Encoded, pH Sensitive Fluorescent Protein, is an Alternative to BCECF-AM to Measure Intracellular pH to Determine NHE3 and DRA Activity
Rafiquel Sarkera Chung Ming Tsea Ruxian Lina George McNamaraa Varsha Singha Mark Donowitza,b
aDivision of Gastroenterology, Department of Medicine, The Johns Hopkins University School of Medicine, Baltimore, MD, USA, bDepartment of Physiology, The Johns Hopkins University School of Medicine, Baltimore, MD, USA
Introduction
Diarrhea related diseases remain a major cause of morbidity and mortality worldwide. Reduction of intestinal Na+ absorption occurs in almost all diarrheal diseases. The epithelial Na+/H+ exchanger SLC9A3 (NHE3) is linked to the Cl-/HCO3- exchanger SLC26A3 (DRA) to produce the electroneutral NaCl absorptive process in the mammalian small intestine and colon. Both NHE3 and DRA are acutely regulated as part of the neutral NaCl absorptive process, although this regulation appears to be coordinated but with different characteristics. In all cells in which it has been studied, NHE3 regulation mimics the regulation of neutral NaCl absorption, being active under basal conditions and being both inhibited and stimulated in cell models by various mimics of digestive physiology. NHE3 is divided into two distinct domains: N-terminus transmembrane domain which perform Na+/H+ exchange, while the C-terminal cytosolic domain is regulatory and plays an important role in trafficking.
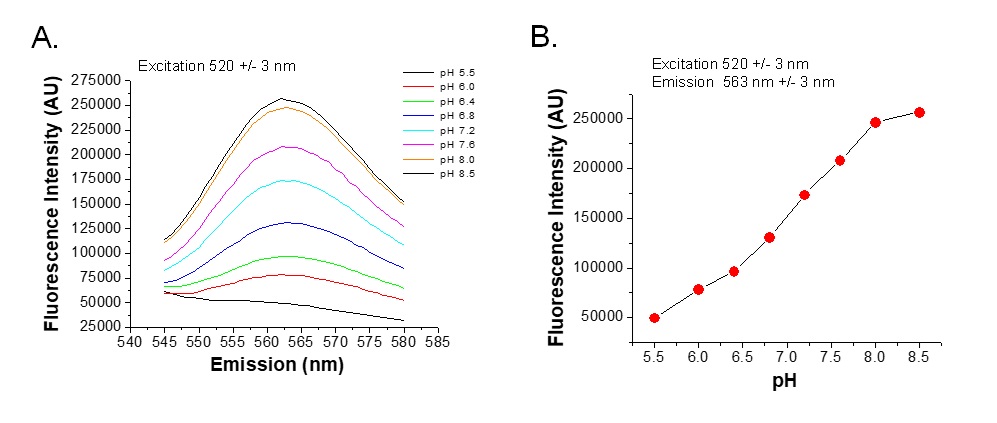
NHE3 and more recently DRA activities are usually measured indirectly by measuring the rate of alkalization of the intracellular space using the pH sensitive dye, BCECF-AM, with consideration of intracellular buffering capacity. Recent advances in fluorescent proteins have paved the way to use them to measure intracellular pH. While loading via coupling to acetoxy methyl esters in most cells has produced adequate loading of BCECF, this has been difficult in some cells, particularly epithelial cells, and loading may not be uniform. This led us to seek an alternate pH sensor for physiologic studies, which could be expressed uniformly, ideally a genetically encoded sensor. mOrange2 is a 26.8 kDa monomer protein derived from mOrange mutations at four different sites (Q64H/F99Y/E160K/G196D) that significantly increased its photo-stability (t1/2 is 228 sec). mOrange2 has a pKa value of 6.5 which is suitable for measuring pHs between pH 6.0 and above 7.0, which is the pH range over which both NHE3 and DRA are active.
Second messengers normally inhibit activity of NHE3, while growth factors and some hormones are stimulatory. DRA is also regulated by second messengers and altered as part of diarrheal diseases in the intestine. Specific inhibitors of both NHE3 and DRA are available [1, 2] and a small molecule stimulator of NHE3 has also been developed that has the potential for treatment of diarrheal disease [3].
FRT (Fisher rat thyroid) cells have been used as an epithelial cell model to study CFTR and develop drugs to inhibit DRA and both stimulate and inhibit CFTR [4, 5]. We demonstrate that mOrange2 is an effective and sensitive pH sensor probe that can be genetically expressed and used to quantitate NHE3 and DRA activity in epithelial cells.
Materials and Methods
Cells and plasmids
FRT (Fischer rat thyroid) epithelial cells were grown and maintained in DMEM-F12 medium supplemented with l-Glutamine, 15 mM HEPES, 10% fetal bovine serum and 50 U/ml penicillin/streptomycin at 37°C in 5% CO2 atmosphere. The mOrange2 construct was made by cloning synthetic mOrange2 seq, (mammalian codon optimized, sequence ID: DQ336159.1) into pcDNA3.1/Zeo (+)
atggtgagca agggcgagga gaataacatg gccatcatca aggagttcat gcgcttcaag gtgcgcatgg agggctccgt gaacggccac
gagttcgaga tcgagggcga gggcgagggc cgcccctacg agggctttca gaccgctaag ctgaaggtga ccaagggtgg ccccctgccc
ttcgcctggg acatcctgtc ccctcatttc acctacggct ccaaggccta cgtgaagcac cccgccgaca tccccgacta cttcaagctg
tccttccccg agggcttcaa gtgggagcgc gtgatgaact acgaggacgg cggcgtggtg accgtgaccc aggactcctc cctgcaggac
ggcgagttca tctacaaggt gaagctgcgc ggcaccaact tcccctccga cggccccgtg atgcagaaga agaccatggg ctgggaggcc
tcctccgagc ggatgtaccc cgaggacggt gccctgaagg gcaagatcaa gatgaggctg aagctgaagg acggcggcca ctacacctcc
gaggtcaaga ccacctacaa ggccaagaag cccgtgcagc tgcccggcgc ctacatcgtc gacatcaagt tggacatcac ctcccacaac
gaggactaca ccatcgtgga acagtacgaa cgcgccgagg gccgccactc caccggcggc atggacgagc tgtacaagtg a
vector (Epoch Life Science, Inc, Sugar Land, TX 77496). FRT cells were transfected with pCDNA 3.1/mOrange2(Zeo)+ vector and selected with zeocin (10 µg/ml). Single clones of FRT/mOrange2 cells were isolated microscopically (Keyence microscope) based on the brightest mOrange2 expression. Selected clone of FRT/mOrange2 cells were transfected with pCDNA3.1/HA-NHE3 plasmid with G418 as the selection marker. Using two selection markers (Zeocin and G418), high HA-NHE3 expressing single clones were selected based on immunoblot analysis.
Microscopic imaging of mOrange2 to measure NHE3 activity
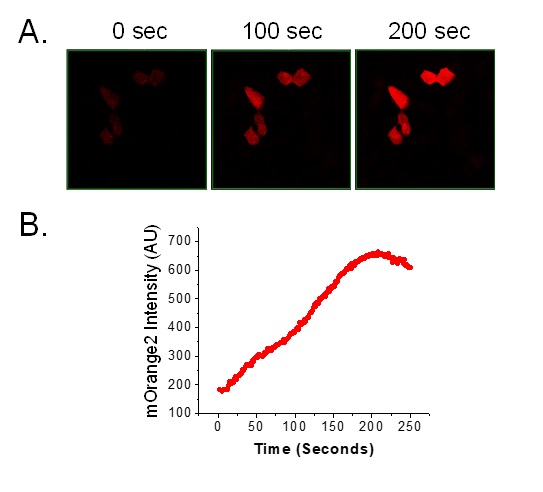
FRT cells transiently or stably expressing mOrange2 and HA-NHE3 were seeded into glass bottom dishes (FluoroDishes, WPI, Inc) (1 × 10⁵ cells/well) and grown for 4-5 days. To examine the pH sensing ability of mOrange2, cells were incubated with 20 mM NH4Cl (108 mM NaCl, 5 mM KCl, 2 mM CaCl2, 1 mM MgSO4, 1 mM NaH2PO4, 25 mM glucose, 20 mM HEPES, and 40 NH4Cl, pH 7.4) at 37°C for 15-20 min and washed three times with TMA+ solution (130 mM tetramethylammonium chloride, 5 mM KCl, 2 mM CaCl2, 1 mM MgSO4, 1 mM NaH2PO4, 25 mM glucose, and 20 mM HEPES, pH 7.4). Adding NH4Cl causes intracellular alkalization and its removal causes rapid intracellular acidification which was used for initiating pH recovery studies [6]. The cells in glass bottom dishes covered with 100 µl TMA solution were studied on the microscope. Live images of mOrange2 fluorescence were obtained at Ex514nm and Em545-614nm every second with an Olympus FV30000RS confocal microscope (20x/0.75na objective) using the resonance mode at 37°C with cells in an OkoLab stage top plus transparent shroud incubator. After baseline fluorescence was established, 900 µl Na+ solution (138 mM NaCl, 5 mM KCl, 2 mM CaCl2, 1 mM MgSO4, 1 mM NaH2PO4, 25 mM glucose, and 20 mM HEPES, pH 7.4) was added. A time series was acquired with 512 × 512 pixels, 16 line average, 300 × 300-μm field of view for 300 time points at ~1 s per time point. Addition of Na+ activates NHE3 activity and the intensity of mOrange2 fluorescence increased with intracellular alkalinization.
NHE3 activity measured in a computerized fluorometer
Na+/H+ exchange activity was determined in the FRT, FRT/HA-NHE3, or FRT/mOrange2/HA-NHE3 cells grown on glass cover slides for 3-5 days. Cells without mOrange2 were loaded with BECEF-AM (10 µM), as described [7]. Cells were incubated in 20 mM NH4Cl for 15-20 min at 37°C. The slides were mounted in a cuvette that allowed apical and basolateral perfusion, placed in a fluorometer (Horiba-Photon Technology, Lawrenceville, NJ), and perfused with TMA+ solution to rapidly remove Na+ in addition to NH4+ for intracellular acidification. After 2–3 min, the apical TMA+ medium was replaced with Na+ medium perfused at 1ml/min. In studies of regulation of transport, cells were pretreated with forskolin (10 µM, 20 min pretreatment) or dexamethasone (1 µM, 5 hours pretreatment). HOE-694 (10 µM) was used in the TMA+ and Na+ solutions to inhibit endogenous NHE1 activity. In cell loaded with BCECF-AM, changes in pHi were monitored by recording emission alternating between 440 and 490 nm with excitation at 530nm. In cells with mOrange2, pHi was monitored by recording the emission signal at Em564±3nm after excitation at 545±3nm. The emission fluorescence was calibrated to pHi with the high K+/nigericin method on each coverslip, as described previously [8, 9]. Initial rates of Na+-dependent intracellular alkalinization were calculated for a given pHi over the first 1 min (within the linear phase) of Na+ exposure and expressed as ∆pH/∆t . Calculation used Origin 8.0 software (OriginLab, Northampton, MA). Means ± SE were determined from at least three experiments. Since excitation and emission spectra of mOrange2 have significant overlap, the best excitation wave lengths were empirically determined at which emission most directly correlated with intracellular pHs between 6.0 to 8.0.
Measuring Cl- /HCO3- exchange activity
Cl-/HCO3- exchange activity was measured fluorometrically using mOrange2 or, as previously described, with BCECF-AM [10]. Measurements were in mOrange2 expressing cells or cells without mOrange2 but loaded with BCECF-AM (10 µM) in Na+ solution (138 mmol/L NaCl, 5 mmol/L KCl, 2 mmol/L CaCl2, 1 mmol/L MgSO4, 1 mmol/L NaH2PO4, 10 mmol/L glucose, 20 mmol/L HEPES, pH 7.4) for 20-30 minutes at 37°C and mounted in a fluorometer. Cells were perfused with Cl- solution (110 mmol/L NaCl, 5 mmol/L KCl, 1 mmol/L CaCl2, 1 mmol/L MgSO4, 10 mmol/L glucose, 25 mmol/L NaHCO3, 1 mmol/L amiloride, 5 mmol/L HEPES, 95% O2 /5% CO2) or Cl- -free solution (110 mmol/L Na-gluconate, 5 mmol/L K-gluconate, 5 mmol/L Ca-gluconate, 1 mmol/L Mg-gluconate, 10 mmol/L glucose, 25 mmol/L NaHCO3, 1 mmol/L amiloride, 5 mmol/L HEPES, 95% O2 /5% CO2) with a flow rate of 1 mL/min. The switch between Cl- solution and Cl- -free solution causes HCO3- uptake across the cell membrane performed by Cl- /HCO3- exchanger(s), and the resulting change in pHi was recorded. Multiple rounds of removing/replenishing extracellular Cl- were performed to measure the Cl-/HCO3- exchange activity under basal conditions as a time control as well as in the presence of forskolin (10 μM). The cells were exposed to forskolin for at 4-5 minutes before their effects on Cl-/HCO3- exchange activity was determined. At the end of each experiment, pHi was calibrated using the same K+ /nigericin clamp solutions as used for the Na+/H+ exchange determinations. The rate of initial alkalinization after the switch from Cl- solution to Cl--free solution over the first 1 min (within the linear phase) was calculated using Origin 8.0 software (OriginLab, Northampton, MA).
Immunoblot analysis
FRT/mOrange2/HA-NHE3 stable cells or FLAG-DRA transfected cells were rinsed 3 times with phosphate-buffered saline and harvested in phosphate-buffered saline by scraping. Cell pellets were collected in 1.5-ml Eppendorf tubes by centrifugation at 5000 rpm for 5 minutes. Cells were mixed with HEPES lysis buffer containing protease inhibitors (20 mM HEPES, pH 7.4, 150 mM NaCl, 50 mM NaF,
1 mM Na3VO4 and 1% Triton X-100) and homogenized by passing them through a 1-ml syringe/26-gauge needle (20X) and rotated for ∼30 minutes at 4°C to maximize solubilization. After removal of insoluble cell debris by centrifugation (10,000 rpm × 10 min), the protein concentrations were measured with the Bio-Rad protein assay, Bradford dye–binding method. Total lysate protein 30µg, was incubated with Laemmli sample buffer at 37°C for 15 minutes, separated by 10% SDS-PAGE, and transferred onto a nitrocellulose membrane. The blot was blocked with 5% nonfat milk, probed with primary antibodies against HA (mouse monoclonal, Biolegend, Cat# MMS-101P, 1:1000 dilution) or FLAG (mouse monoclonal, Sigma-Aldrich, Cat# F1804, 1:2000 dilution), glyceraldehyde-3-phosphate dehydrogenase (mouse monoclonal, Sigma-Aldrich, Cat# G8795, 1:5000 dilution) overnight at 4°C, followed by IR-dye secondary antibody against mouse IgG (1:10,000) for 1 hour at room temperature. Protein bands were visualized using an Odyssey CLx system and quantitated with Image Studio software (LI-COR Biosciences, Lincoln, NE).
Results
Endogenous and exogenous Na+ /H+ exchange activity in FRT cells
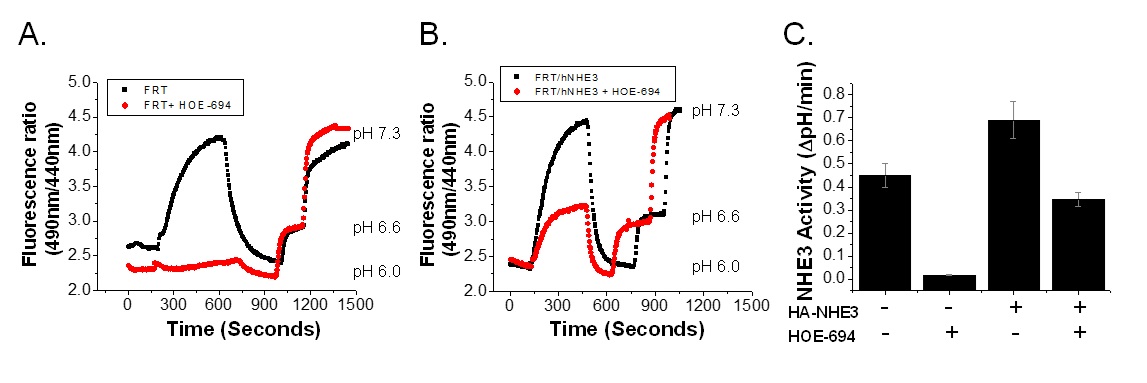
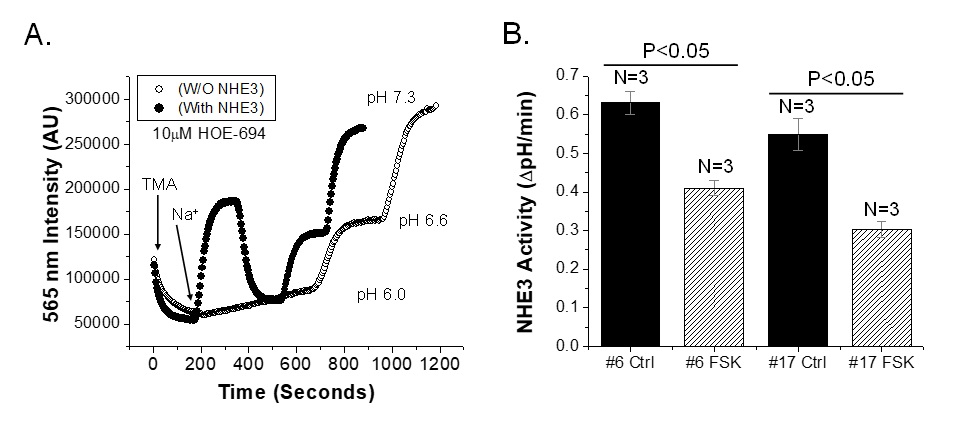
FRT cells were chosen to establish a cell model for the NHE3 activity assay using mOrange2 as a pH sensor probe, based on their previous use for transport assays and drug development [4, 5]. Endogenous Na+/H+ exchange activity was quantitated in wild type FRT cells using BCECF-AM dye. FRT cells had a large amount of Na+/H+ exchange activity (0.45 ∆pH/min) which was nearly entirely abolished in the presence of 10 µM HOE-694 (Fig. 1A), consistent with this representing NHE1. FRT cells with HA-NHE3 expression had a higher Na+/H+ exchange activity (0.69±0.08 ∆pH/min). In the presence of 10 µM HOE-694, Na+/H+ exchange activity was reduced to ~half (0.34±0.03 ∆pH/min) (Fig. 1B, C). These experiments indicate that FRT cells have endogenous Na+/H+ exchange activity, most probably due to the presence of NHE1, which was inhibited by 10 µM HOE-694. Exogenous expression of HA-NHE3 represents the difference between total Na+/H+ exchange and that after HOE-694 exposure and the results indicate this was a modestly overexpressing model.
Stable cell lines of FRT/HA-NHE3/mOrange2
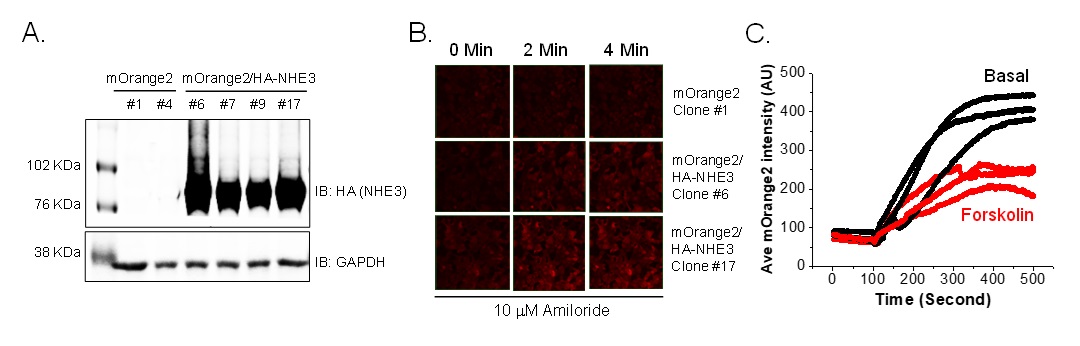
Several single clones of FRT/HA-NHE3/mOrange2 were manually selected that had the highest percent (>95%) of mOrange2 positive cells and high, uniform expression of HA-NHE3. Expression of HA-tagged NHE3 was examined in FRT/mOrange2 cells by western blot which is shown in Fig. 3A. Two clones #6 and #17 were examined microscopically to evaluate the change of mOrange2 intensity with intracellular alkalinization by NHE3. NHE1 expression in cells not expressing NHE3 is shown in the upper panel of Fig. 3B, while clones with high NHE3 expression and with NHE1 inhibited by 10 µM amiloride are shown in the other two panels. NHE3 clones #6 and #17 were studied further in the presence of 10 µM amiloride (Fig. 3C). Maximum alkalization with Na+ exposure, was observed within 2 to 3 minutes. We then tested the effect of forskolin on NHE3 activity indicated by a change in mOrange2 intensity microscopically. Forskolin treatment reduced the intensity of mOrange2 (~45%) compared to untreated cells (Fig. 3C shows triplicate traces of cells from a single experiment). This result indicates that using mOrange2 as pH sensor protein can reproducibly detect Na+/H+ exchange activity in live cells under basal and inhibited conditions microscopically.
NHE3 activity quantitation using mOrange2 as pH sensor protein using a computerized fluorometer
Whether mOrange2 could allow quantitation of NHE3 activity using dual excitation and single wave length emission in a fluorometer was determined in FRT/HA-NHE3/mOrange2 cells. Cells were grown on glass slides for 4-5 days, serum starved for ~2 hours and then bathed in 25 mM NH4Cl for 15 min. Cells were then perfused with TMA to acidify the intracellular pH, which after reaching a constant intensity, was then exposed to Na+ solution which caused rapid alkalinization. Fig. 5A shows the intensity of emission at 565±3 nm with 545±3 nm excitation under basal conditions in FRT cells expressing mOrange2 without or with HA-NHE3 stably expressed, with all studies done in the presence of 10 µM HOE-694. Results were similar with excitation 520±3nm. Cells expressing HA-NHE3 showed a rapid increase of mOrange2 intensity representing intracellular alkalinization with Na+ perfusion. Cells without HA-NHE3 had negligible change in mOrange2 intensity with Na+ perfusion.
We then tested the effect of 10 µM forskolin exposed for 20 min before Na+ addition on NHE3 activity in the same FRT/mOrange2/HA-NHE3 cells. Forskolin treatment inhibited NHE3 activity by ~ 47% compared to basal activity as shown in Fig. 5B.
Stimulation of NHE3 by Dexamethasone
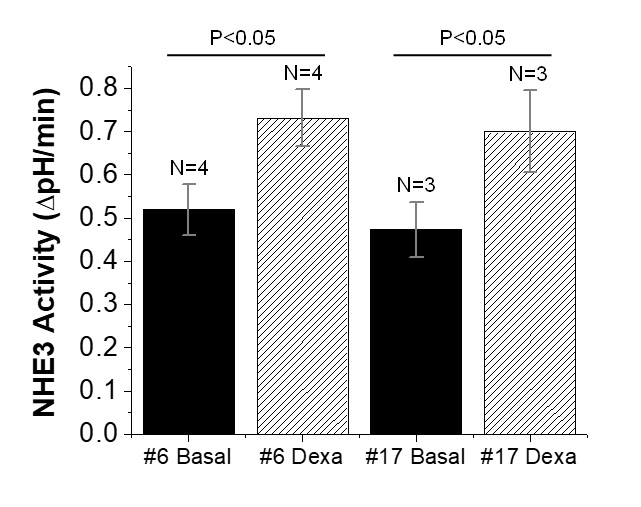
To determine if NHE3 stimulation could be quantitated with mOrange2, we used short-term exposure to dexamethasone that is known to stimulate NHE3 activity, without altering the amount of NHE3 protein over this time [11, 12]. Treatment of cells with 1 µM dexamethasone for 5 hours stimulated NHE3 activity in FRT/HA-NHE3/mOrange2 cells in the presence of 10 µM HOE-694. Dexamethasone treatment stimulated NHE3 activity by 41% and 48% stimulation in Clone # 6 and # 17 respectively (Fig. 6). These results indicate that NHE3 activitiy under basal, inhibited and stimulated conditions can be quantitated with mOrange2, producing quantitative results similar to those found using BCECF-AM [11, 12].
DRA activity quantitation using mOrange2 as pH sensor protein using a computerized fluorometer
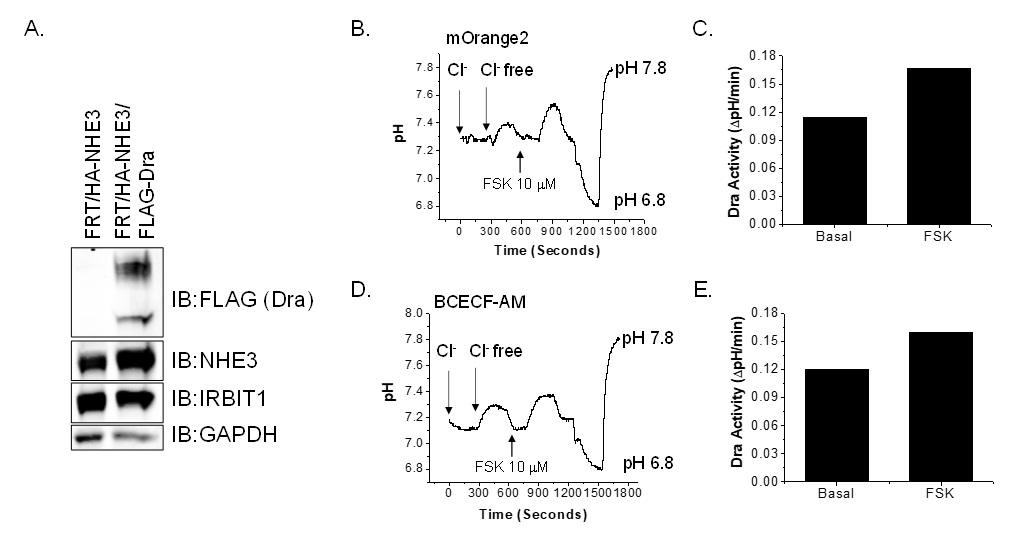
DRA activity was quantitated in FRT/HA-NHE3/mOrange2 cells under basal and forskolin treated conditions. Since FRT cells do not endogenously express significant amounts of DRA, FRT/HA-NHE3/mOrange2 cells were transiently transfected with the pcDNA/FLAG-hDRA plasmid. Expression of FLAG-DRA and HA-NHE3 in FRT cells evaluated by immunoblot is shown in Fig. 7A. DRA activity was measured in the fluorometer using mOrange2. Traces of intracellular alkalinization driven by HCO3- entry after apical Cl- removal under basal and forskolin conditions are shown in Fig. 7B and calculated DRA activity is shown in Fig. 7C. DRA activity was stimulated 50% by forskolin treatment compared to basal activity. We then examined DRA activity in the FLAG-DRA transfected cells loaded with BCECF-AM dye. Basal and forskolin stimulated DRA activities are as shown in Fig. 7D and 7E. DRA activities measured using BCECF and mOrange2 were similar. These observations indicate that both NHE3 and DRA activities can be measured in live cells using mOrange2 as a pH sensor.
We thank Alan Verkman for providing the FRT cells and Dr. Hans-Jochen Lang for providing the HOE-694.
Author Contributions
R. Sarker, M. Tse, R. Lin, and V. Singh performed the experiments, analyzed the data and planned additional studies. R. Lin development methods to generate the monolayers and prepared the monolayers used. G. McNamara helped standardize the fluorometric studies and establish best way to quantitate intracellular pH. M. Donowitz devised concept of studies, planned experiments, interpreted results, prepared the manuscript and provided funding for the study. All authors helped in manuscript preparation.
Funding
This study was supported in part by NIH grants R01-DK26523, R01-DK61765, P01-DK64388, NIH SIG 1S10OD025244, P30-DK89502, and P01-AI125181.
The authors declare that no conflict of interests exists.
| 1 Spencer AG, Labonte ED, Rosenbaum DP, Plato CF, Carreras CW, Leadbetter MR, Kozuka K, Kohler J, Koo-McCoy S, He L, Bell N, Tabora J, Joly KM, Navre M, Jacobs JW, Charmot D: Intestinal inhibition of the Na+/H+ exchanger 3 prevents cardiorenal damage in rats and inhibits Na+ uptake in humans. Sci Transl Med 2014;6:227ra36. https://doi.org/10.1126/scitranslmed.3007790 |
||||
| 2 Haggie PM, Cil O, Lee S, Tan JA, Rivera AA, Phuan PW, Verkman AS: SLC26A3 inhibitor identified in small molecule screen blocks colonic fluid absorption and reduces constipation. JCI Insight 2018;3:e121370. https://doi.org/10.1172/jci.insight.121370 |
||||
| 3 Zachos NC. Vaughn H, Sarker R, Lin R, Tse CM, Green J, Donowitz M: 266 NHE3 is a Drug Target for Treating Diarrhea: A Novel Peptide Stimulates NHE3 Activity, Prevents cAMP, cGMP, and Ca2+ Inhibition of NHE3 and Prevents Cholera Toxin and E. coli Heat Stable Enterotoxin Fluid Secretion. Gastroenterology 2021;160:S63-S64. https://doi.org/10.1016/S0016-5085(21)00894-5 |
||||
| 4 Ma T, Thiagarajah JR, Yang H, Sonawane ND, Folli C, Galietta LJV, Verkman AS: Thiazolidinone CFTR inhibitor identified by high-throughput screening blocks cholera toxin-induced intestinal fluid secretion. J Clin Invest 2002;110:1651-1658. https://doi.org/10.1172/JCI0216112 |
||||
| 5 Cil O, Phuan P-W, Lee S, Tan J, Haggie PM, Levin MH, Sun L, Thiagarajah JR, Ma T, Verkman AS: CFTR activator increases intestinal fluid secretion and normalizes stool output in a mouse model of constipation. Cell Mol Gastroenterol Hepatol 2016;2:317-327. https://doi.org/10.1016/j.jcmgh.2015.12.010 |
||||
| 6 Roos A, Boron WF: Intracellular pH. Physiol Rev 1981;61:296-434. https://doi.org/10.1152/physrev.1981.61.2.296 |
||||
| 7 Janecki AJ, Montrose M H, Zimniak P, Zweibaum A, Tse C M, Khurana S, Donowitz M: Subcellular redistribution is involved in acute regulation of the brush border Na/H exchanger isoform 3 in human colon adenocarcinoma cell line Caco-2. Protein kinase C-mediated inhibition of the exchanger. J Biol Chem 1998;273:8790-8798. https://doi.org/10.1074/jbc.273.15.8790 |
||||
| 8 Sarker R, Grønborg M, Cha M, Mohan S, Chen Y, Pandey A, Litchfield D, Doniwtz M, Li X: Casein kinase 2 binds to the C terminus of Na+/H+ exchanger 3 (NHE3) and stimulates NHE3 basal activity by phosphorylating a separate site in NHE3. Mol Biol Cell 2008;19:3859-3870. https://doi.org/10.1091/mbc.e08-01-0019 |
||||
| 9 Sarker R, Valkhoff VE, Zachos NC, Lin R, Cha B, Chen TE, Guggino S, Zizak M, de Jonge H, Hogema B, Donowitz M: NHERF1 and NHERF2 are necessary for multiple but usually separate aspects of basal and acute regulation of NHE3 activity. Am J Physiol Cell Physiol 2011;300:C771-C782. https://doi.org/10.1152/ajpcell.00119.2010 |
||||
| 10 Tse CM, Yin J. Singh V, Sarker R, Lin R, Verkman AS, Turner JR, Donowitz M: cAMP Stimulates SLC26A3 Activity in Human Colon by a CFTR-Dependent Mechanism That Does Not Require CFTR Activity. Cell Mol Gastroenterol Hepatol 2019;7:641-653. https://doi.org/10.1016/j.jcmgh.2019.01.002 |
||||
| 11 Bobulescu A, Dwarakanath V, Zou L, Zhang J, Baum M, Moe OW: Glucocorticoids acutely increase cell surface Na+/H+ exchanger-3 (NHE3) by activation of NHE3 exocytosis. Am J Physiol Renal Physiol 2005;289:F685-F691. https://doi.org/10.1152/ajprenal.00447.2004 |
||||
| 12 Wang D, Zhang H, Lang F, Yun CC: Acute activation of NHE3 by dexamethasone correlates with activation of SGK1 and requires a functional glucocorticoid receptor. Am J Physiol Cell Physiol 2007;292:C396-C404. https://doi.org/10.1152/ajpcell.00345.2006 |
||||
| 13 Shaner NC, Lin MZ, McKeown MR, Steinbach PA, Hazelwood KL, Davidson MW, Tsien RY: Improving the photostability of bright monomeric orange and red fluorescent proteins. Nat Methods 2008;5:545-551. https://doi.org/10.1038/nmeth.1209 |
||||
| 14 Li Y, Zheng L, Wang D, Zhang X, Li J, Ali S, Zong H, Xu X: Staurosporine as an agonist for induction of GLUT4 translocation, identified by a pH-sensitive fluorescent IRAP-mOrange2 probe. Biochem Biophys Res Commun 2016;25:534-538. https://doi.org/10.1016/j.bbrc.2016.10.056 |
||||
| 15 Egashira Y, Takase M Takamori S: Monitoring of Vacuolar-Type H+ ATPase-Mediated Proton Influx into Synaptic Vesicles. J Neurosci 2015;35:3701-3710. https://doi.org/10.1523/JNEUROSCI.4160-14.2015 |
||||