×
![]()
Corresponding Author: Martina Höckner
University of Innsbruck, Institute of Zoology, Center for Molecular Biosciences Innsbruck, Technikerstraße 25, 6020 Innsbruck (Austria)
E-Mail martina.hoeckner@uibk.ac.at
Aging Cell Culture - Genetic and Metabolic Effects of Passage Number on Zebrafish Z3 Cells
Maja Šrut Bettina Peer Birgit Fiechtner Margit Egg Adolf Michael Sandbichler Martina Höckner
University of Innsbruck, Institute of Zoology, Center for Molecular Biosciences Innsbruck, Innsbruck, Austria
Introduction
When cells of the zebrafish embryonic fibroblast line Z3 are grown to 70 - 80 % confluency, they are split in a ratio of 1:7. This process, known as passaging, can also be related to the chronological age of cells. Cells which are grown in a monolayer do not reflect the conditions that prevail in tissues, and the passage number or the chronological age appear to induce changes in cell physiology. The latter poses a high risk of misinterpreting data, which often leads to the lack of generating reproducible data.
Passage numbers have been shown to reveal differences for example in rabies testing [1], in resistance to H2O2-induced apoptosis [2], in cell doubling time and osteogenic characteristics in D1 cells [3], in reduced gene expression and tumorigenic properties from Uveal Melanoma Primary Tumors-derived cell lines [4], in Insulin-Degrading Enzyme activity [5] as well as in P-glycoprotein expression [6] both in Caco-2 cells. Hughes and colleagues reported already on contradictory results in a review article on Caco-2 cells in 2007 [7]. Karyotype comparison of two cell lines (MCF-7 and Ishikawa) revealed chromosomal aberrations with increasing passage number depending on culture conditions [8]. Also, the emergence of an aberrant X chromosome in high passage numbers of human embryonic stem cells (hES) was demonstrated [9]. Further passage-related effects like impaired mitochondrial function have been shown in hES [10]. hES were even affected by different passaging methods, such as enzymatic versus nonenzymatic dissociation of cell clusters, the latter of which appeared to induce chromosomal aberrations [11]. Increased passage numbers of HT29 cells were reported to induce a decrease in cell proliferation and their ability to migrate, and led to altered cell cycle distributions [12]. Hence, putative differences in passage numbers that are probably cell-line-specific have to be excluded before starting new experiments.
Ageing has been defined as “the time-related deterioration of the physiological functions necessary for survival and fertility” [13] and is linked to senescence, which was originally referred to as the replicative limit of cell cultures. Recently, senescence was defined as “state of stress-induced irreversible proliferative arrest and resistance to both mitogenic and oncogenic stimuli” [14]. Senescence has widely been used to determine ageing in cell cultures. However, even before senescence and replicative arrest occurs, the passage number of dividing cells has a great impact on several genetic and physiological parameters.
We examined the frequently used embryonic zebrafish cell line Z3 to determine putative changes up to passage number 50, which equals in the case of the Z3 cell line 50 weeks of culturing. Zebrafish cells are derived from dispersed zebrafish embryos that are cultured until a stable cell cluster forms, which is able to survive and continues to proliferate [15, 16]. Those very early passage numbers are then cryopreserved and can be shared within the scientific community. Senescence markers, DNA damage, and metabolic measurements have been used to evaluate the effect of passage numbers and eventually cell age.
Materials and Methods
Culturing of Z3 cells
The Z3 zebrafish cell line was originally established in 2001 from 24h-old embryos to investigate the light-dependent gene activation of their circadian oscillator [15]. Cells were cultured in a Peltier-cooled incubator (Memmert, Germany) at 25°C under normal air atmosphere in Leibovitz L15 media supplemented with 15% v/v fetal bovine serum, penicillin and streptomycin (both 1%), gentamycin (0.1%) and L-glutamine (2 mM) (all from Thermo Fisher Scientific, Waltham, Massachusetts, United States). Cells were split once a week, which increased the passage number weekly by one. Samples were taken as described in the respective methodical section.
Doubling time
Z3 cells were seeded (5000 cells per well) and cultured in 96-well plates. The cell number of each passage was measured 24, 48, 72, and 96 hours after seeding using Hoechst 33342 (Thermo Fisher Scientific, Waltham, Massachusetts, United States). The mean of four replicates of each time point was used to calculate the doubling time.
Beta-gal assay
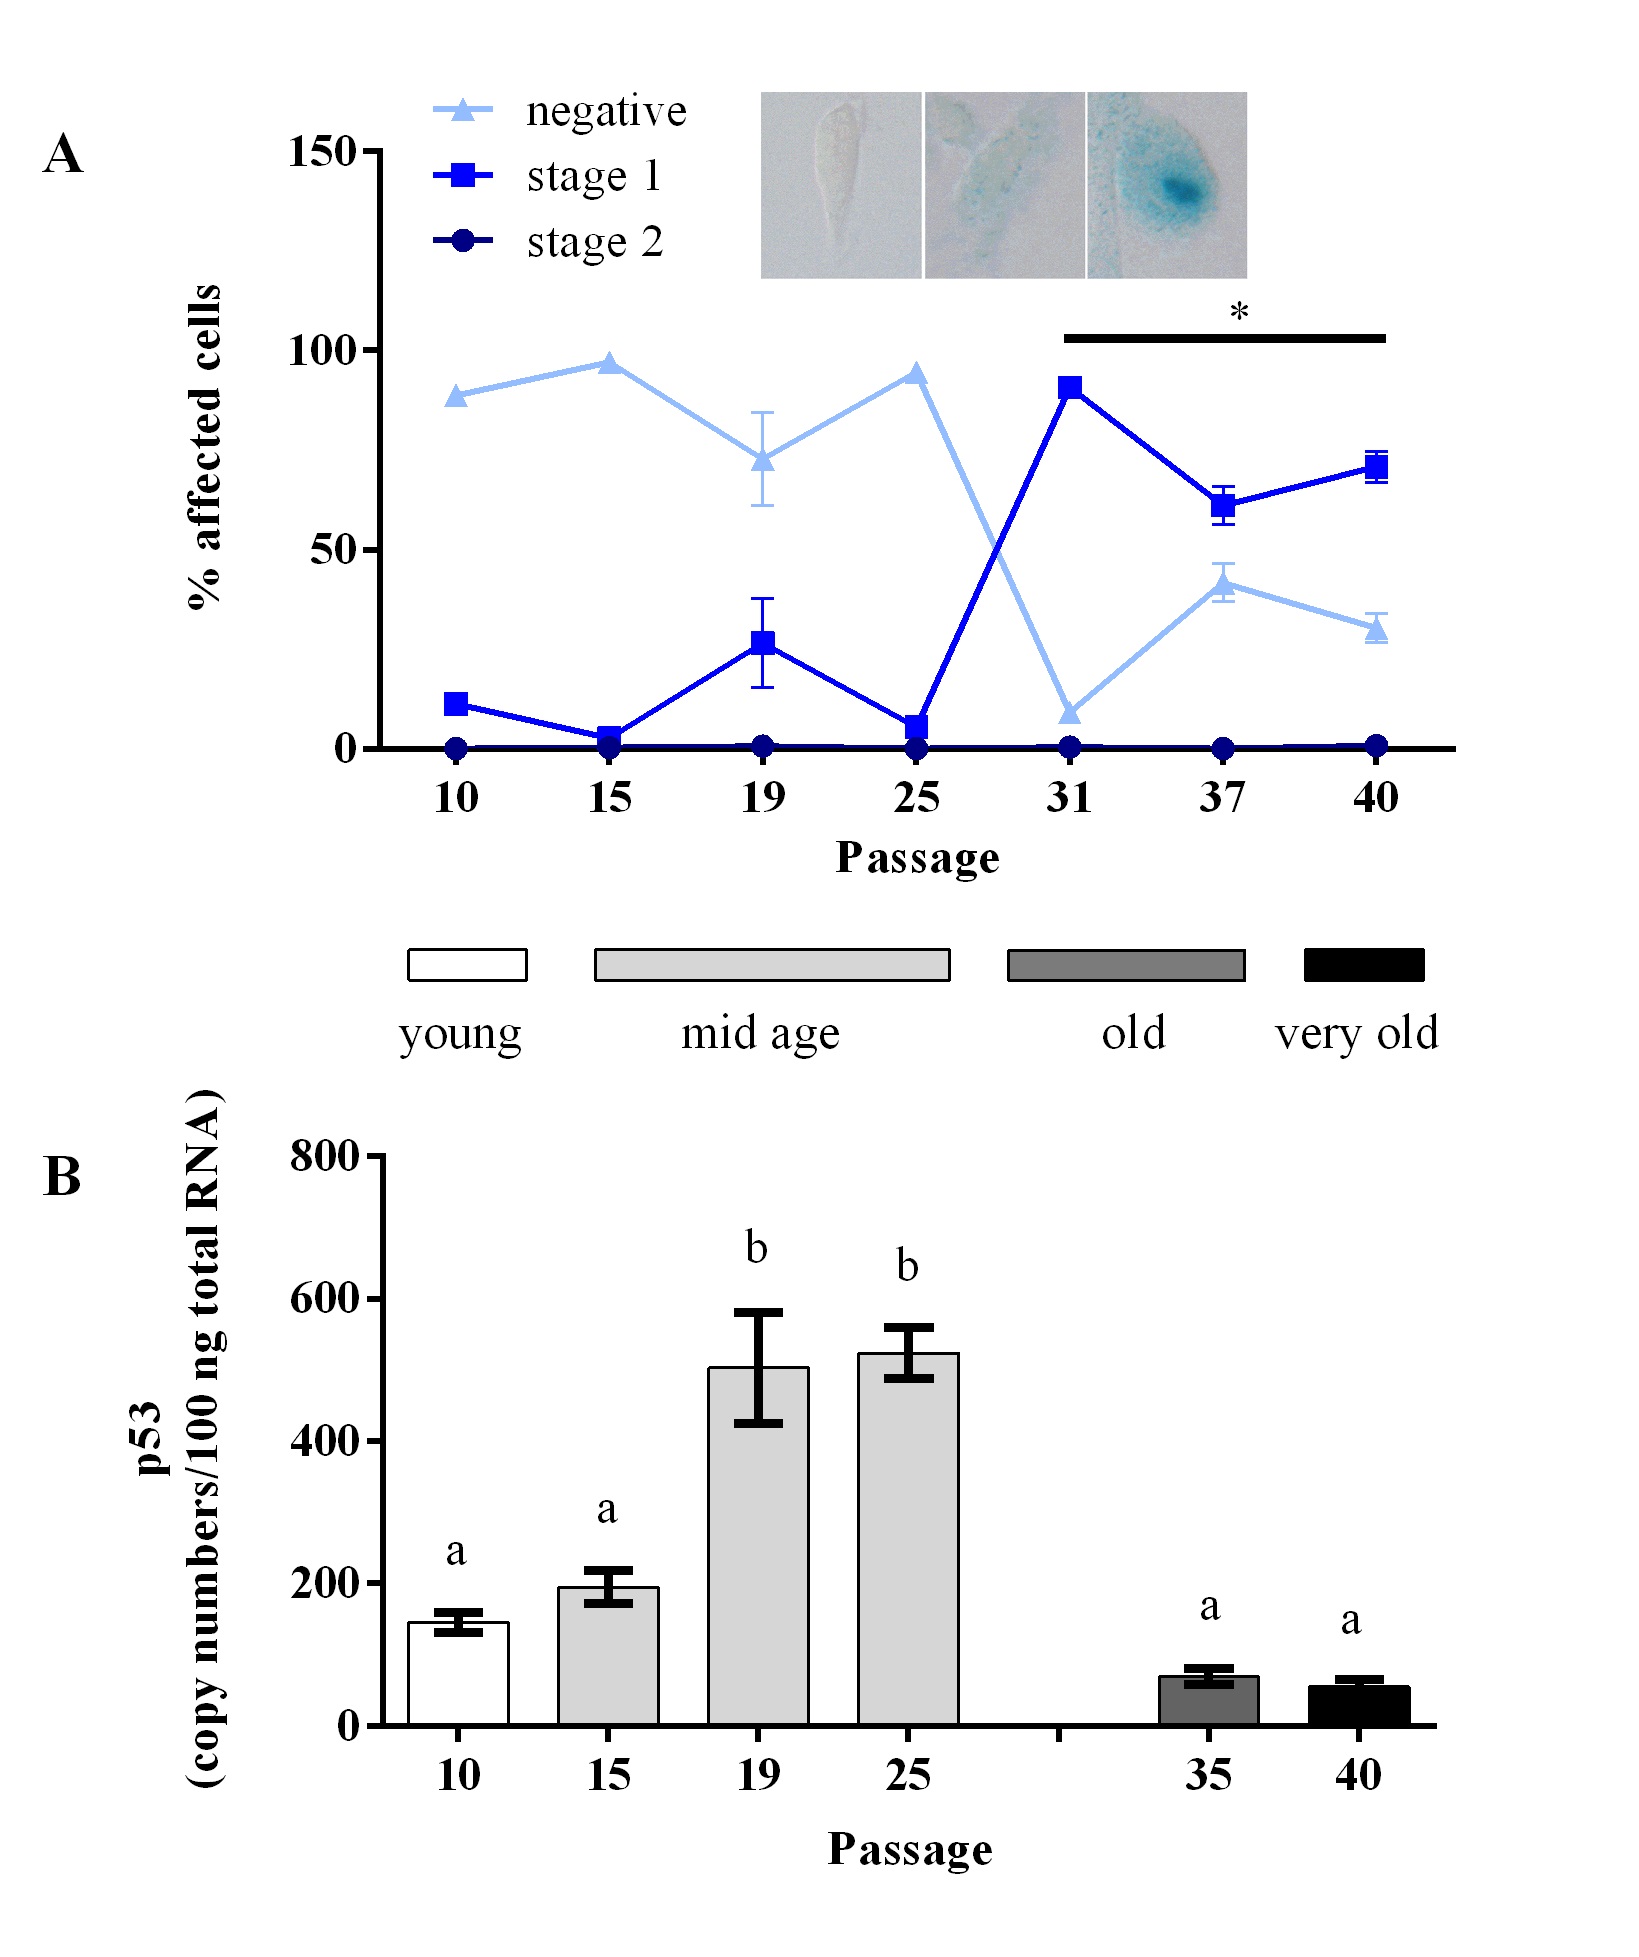
Cells were seeded on a cover slip, which was placed into a petri dish and left overnight. The next day, the medium was removed and 2 ml fixation buffer was added and left for 4 min at room temperature. The liquid was removed followed by three washing steps with 1xPBS. Then 2 ml of the staining solution (5mM K4[Fe(CN)₆], 5mM K3[Fe(CN)₆], 40mM Citric acid, 12mM Na2HPO4, 150mM NaCl, 2mM MgCl2 in a total of 19 ml, pH 5.8; freshly add 1 ml of x-Gal solution (20mg/ml x –Gal in DMF)) was added and incubated in the dark at 37°C for 22h. The reaction was stopped using TBS-T, rinsed with distilled water and mounted using Faramount (Agilent). Upon microscopic evaluation of the slides it became obvious that we can clearly distinguish three groups of cells. The group of negative cells did not show any staining. The second group of stage 1 cells showed a slight blue staining, whereas stage 2 cells revealed a dark blue staining. Image acquisition and analysis were performed in a blinded fashion. For each passage four slides were prepared and five images from each slide were taken. A minimum of 100 cells per image were counted and used for analysis (% cells of the respective group of total cell number).
Quantitative RealTime PCR (qPCR)
Media was removed from the petri dish, TRIzol (Thermo Fisher Scientific, Waltham, Massachusetts, United States) was added and cells were removed using a cell scraper. RNA extraction using TRIzol was accomplished according to the user manual. RevertAidHplus and random hexamer primers were then used to transcribe 450 ng RNA into cDNA. RNA concentration was measured using Ribogreen in triplicates on a plate reader (Victor4, Perkin Elmer, Waltham, Massachusetts, United States). SYBRGreen (Thermo Fisher Scientific, Waltham, Massachusetts, United States) was used for absolute quantification of copy numbers using a standard curve. PCR efficiency was at 82 %. The primer concentrations used were previously determined by testing different primer concentrations, namely 0.5µM, 3µM and 9µM, in PCR reactions. We then selected for the most effective combination, which results in the highest amount of amplicon without any unspecific products.
Western Blot
Stored proteins were kept at -80°C in 2x Laemmli buffer and were heated for 5 min at 95°C, centrifuged, and the supernatant was transferred to a new tube. Concentration was measured using the NanoDrop (Thermo Fisher Scientific, Waltham, Massachusetts, United States). 20 µg whole protein extracts were separated on a 12% precast gel (Bio-Rad, Hercules, California, United States) and transferred to a PVDF membrane (Bio-Rad, Hercules, California, United States) using a semidry blot system (Bio-Rad, Hercules, California, United States) with standard settings. The membrane was blocked with 5% milk powder in TBS-T for one hour at room temperature. The membrane was then cut at 70 kD and used for incubation with the Hif1 (1:1000; [17]) and catalase (1:5000; Anti-CATALASE (RABBIT) Antibody - 100-4151, Rockland Inc., Limerick, Pennsylvania, USA) antibodies. The membranes were then left overnight at 4°C in blocking buffer, washed with TBS-T three times for 10 min and incubated with the second antibody (pox anti rabbit) for one hour at room temperature in blocking buffer. Three washing steps with TBS-T were followed with detection using ECL using the chemidoc (Bio-Rad, Hercules, California, United States). The same procedure was applied for Hif3 (1:5000, [17]).
Comet assay
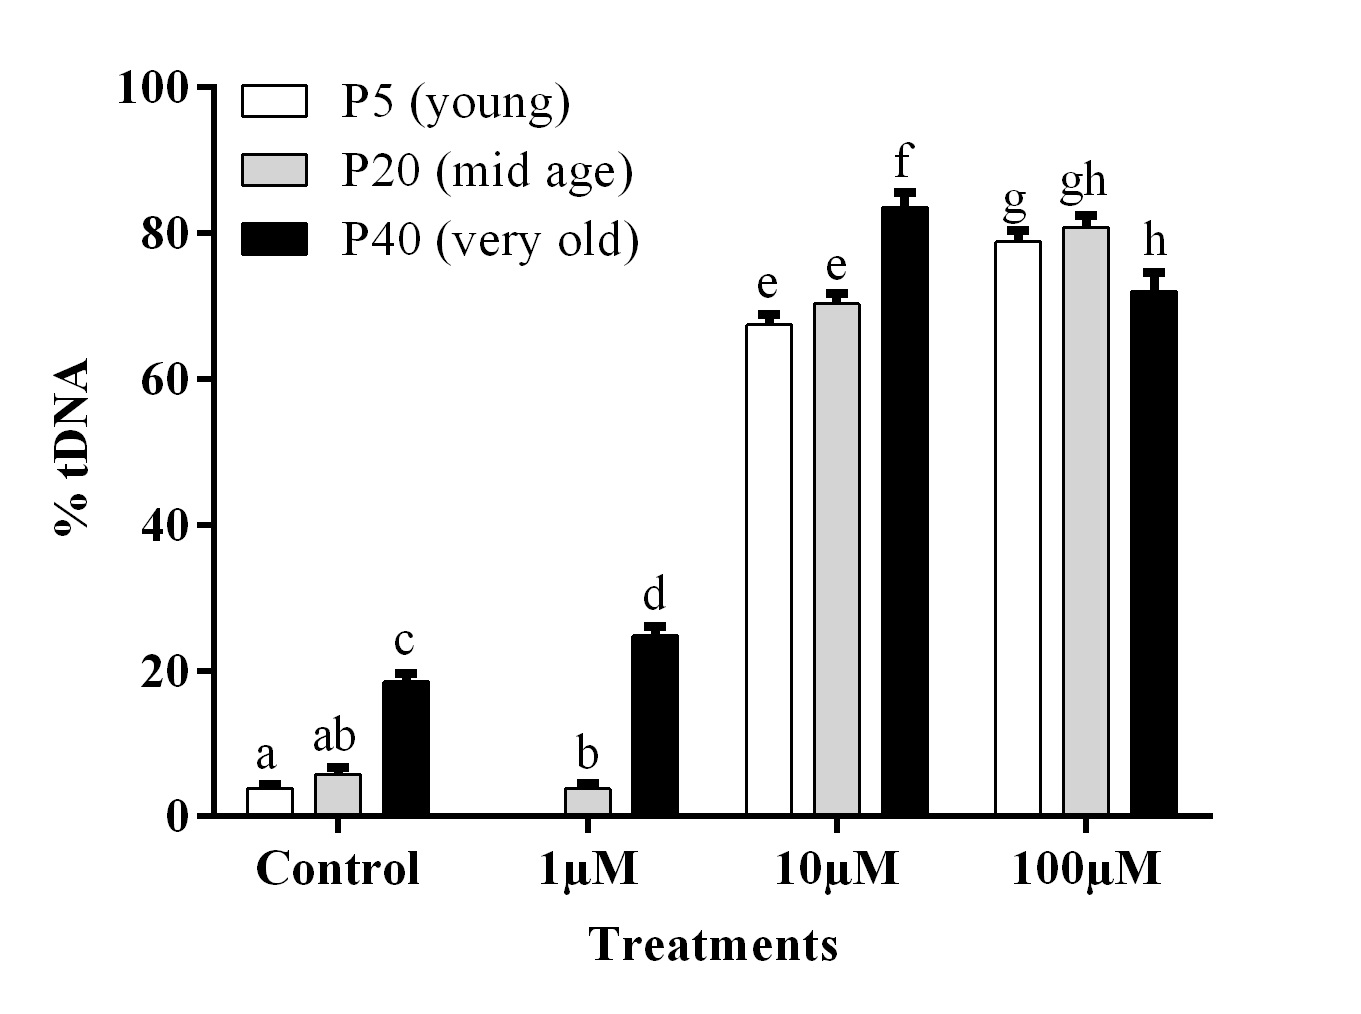
The alkaline comet assay was performed as previously described [18], with slight modifications. 50 µl aliquots of cell suspension (200 cells/µl) and 0.5% low melting point (LMP, Sigma–Aldrich) agarose were mixed and placed on 1% normal agarose precoated microscope slides. After solidifying at 0°C, a third layer of 0.5% LMP agarose was added and left to solidify. Prepared slides were placed in petri dishes and treated with 200 ml of phosphate buffer saline (PBS) containing serial dilutions of hydrogen peroxide (H2O2, 1, 10 and 100 µM) for 10 min at room temperature. Cells exposed only to pure PBS were used as a control. Exposure was carried out in triplicates. After the exposure, slides were rinsed with PBS and subsequently placed in lysing buffer (2.5 M NaCl, 100 mM EDTA, 10 mM Tris–HCl, 10% DMSO, 1% Triton X-100, pH 10). After lysing for 1h at 4°C, slides were rinsed with redistilled water, placed on the horizontal gel box and covered with the cold alkaline buffer (0.3 M NaOH, 1 mM EDTA, pH > 13) for 20 min. Electrophoresis was run in the same buffer at 0.4 Vcm-1 and 300 mA for 30 min at 4°C. After neutralization (0.4 M Tris–HCl, pH 7.5), slides were fixed in methanol:acetic acid (3:1) for 5 min and stored in the dark at room temperature. Prior to examination, slides were rehydrated and stained with 4% GelRedTM (Biotium, USA). On every slide at least 100 nuclei were examined using an Axiovert 100 M microscope (Zeiss, Germany). The extent of DNA migration was determined as percentage of DNA in tail (% tDNA) using the image analysis system CASP [19]. Due to the software’s technical limitations in determining the percentage of DNA damage in highly damaged cells (where almost all DNA is in tail), those cells were manually assigned a value of 98% tDNA. Mean values of the tDNA damage for each treatment group were calculated and data are presented as mean and corresponding standard deviation (SD). Due to non-normally distributed data, statistical analysis was performed using the Kruskal Wallis non-parametric test, followed by a pairwise Wilcoxon test (R Studio, Version 1.0.143). Level of significance reported: p≤ 0.05.
Seahorse XFp extracellular flux analyzer measurements
Oxygen consumption rate (OCR) and extracellular acidification rate (ECAR) in Z3 cells of different passage numbers were measured with a Seahorse XFp Analyzer (Agilent, USA). Cells were seeded at a density of 105 cells per well and were cultured overnight in growth medium before changing the media to DMEM containing two mM L-glutamine and, depending on the analysis, five mM glucose and one mM pyruvate. We used two commercial Seahorse XFp kits for characterizing respiratory (Mitochondria stress test, Agilent, USA) or glycolytic activity (Glycolysis stress test, Agilent, USA) and followed the instructions provided by the manufacturer. Chemical inhibitors were prepared as ten times stock in the same media and deposited in the injection ports of the sensor cartridges. The seahorse device was placed in a climate chamber and measurement temperature was set to 26°C. XFp data was analyzed in Seahorse Wave software and exported to Excel (Microsoft, USA) for further analysis. Rate data was normalized to the last three measurement points before chemicals were injected.
Lactate and Pyruvate quantification
Sampling: From each passage, cells were rinsed with ice cold PBS. After addition of 850 µl TE buffer (pH7), cells were removed from the petri dish using a cell scraper and shock frozen in liquid nitrogen. After thoroughly mixing the homogenate and centrifugation at 4°C for 1 min at 5000 rcf, the supernatant was applied to spin filters with a cut off at 10kDa and centrifuged at room temperature for 15 min at 14000 rcf. The flow through was collected and stored at -80°C. The filter was then turned upside down and placed into a fresh tube and centrifuged at room temperature for 2 min at 1000 rcf. The flow through, herein referred to as concentrate, was stored at -80°C and used for measuring the protein content, which was used for data normalization.
The filtrates were thawed and measured in triplicates applying a standard curve. The pyruvate and lactate standard included the following concentrations: 1 mM, 0.5 mM, 0.25 mM, 0.125 mM. 10 µl sample, 10 µl distilled water and 15 min before the measurement 100 µl TEN buffer +LDH (3U/ml) (0.05 M Tris + 5 mM EDTA, 0.15 mM NADH, pH 7.4) was added and the samples were incubated in the dark at room temperature.
For measuring lactate, 10 µl sample, 10 µl distilled water and 200 µl lactate buffer (0.5 M glycine, 0.4 M hydrazine sulfate) were combined. 30 min before the measurement, 25 µl L-LDH (1:200) were added and the samples were kept at room temperature in the dark until start of the measurement.
The protein concentration was determined from the concentrates in triplicates using the Nano Drop (Thermo Fisher Scientific, Waltham, Massachusetts, United States) and used for data normalization.
Statistical analysis
Data were analysed using GraphPad Prism 9.2.0. Normality was tested applying Shapiro-Wilk test. Significant differences were detected with One-Way Anova and Tukey’s multiple comparisons test or Kruskal-Wallis test and Dunn’s multiple comparisons test for not normally distributed data. Group differences of the growth rate was analysed with the Mann Whitney test. Comet assay data and multidimensional scaling analysis (MDS) were performed in RStudio Version 1.3.1073 (R Core Team, 2020). Significance of comet assay data was tested with Kruskal Wallis test using script “kruskal.test” followed by script “pairwise.wilcox.test” using bonferroni correction, to get the pairwise comparisons between groups. MDS was performed using script “cmdscale” [20].
Results
We examined physiological and genetic effects of cell passage numbers, which might relate to aging in cell cultures in a zebrafish embryonic fibroblast cell line (Z3).
Growth rate
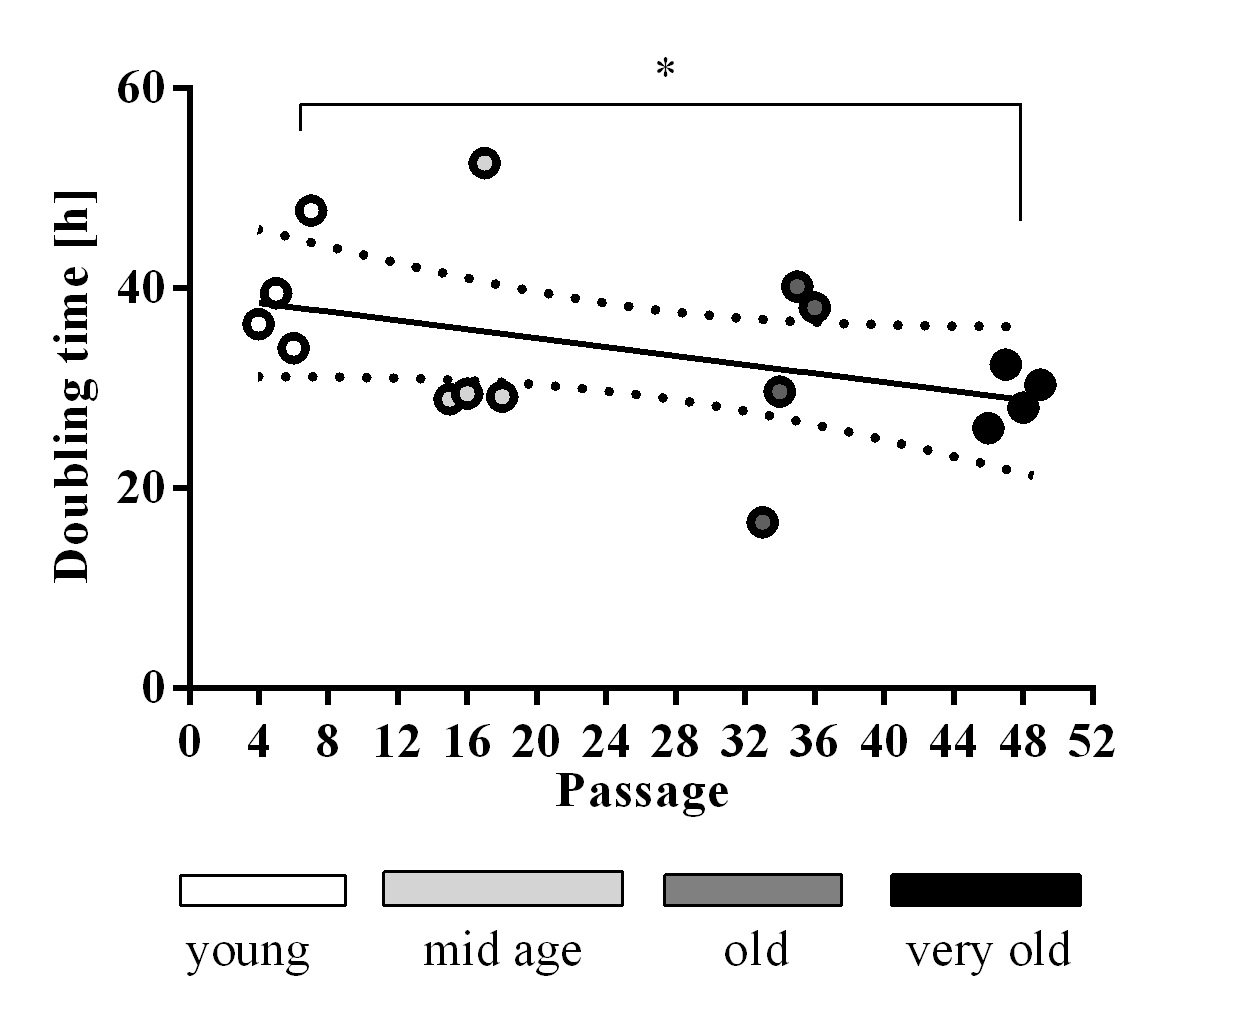
We determined the doubling time of passage numbers 4-6, 15-18, 33-36, and 46-49, which we called young, mid age, old and very old, respectively. A significant difference was detected between the youngest and oldest group for which the doubling time decreased (Fig. 1). We did not observe cell cycle arrest in any cell passage up to 49. Especially the group of passage 33-36 showed high variability in doubling time (Fig. 1).
Beta galactosidase (SAbeta-gal) activity
The senescence-associated beta galactosidase (SAbeta-gal) activity, a marker for cellular senescence, showed a significant increase in higher passages. Staining intensity was categorized as either negative, light blue (stage 1) or dark blue (stage 2). We observed an increase of stage 1 cells at passage 31 with elevated levels until passage 40. Hardly any stage 2 cells were detected (Fig. 2A), which might confirm the previous results that no proliferative arrest was determined. We therefore conclude that no senescent cells were present in either of the passages.
P53 gene expression
p53 gene expression, which can be associated with senescence, showed a significant increase in passages 19 and 25, which in passages 35, and 40 again decreased (Fig. 2B).
DNA damage
The results of the Comet assay showed a significant difference in the basal level of DNA damage as well as a difference in cell response to oxidative stress as result of cell age. Control cells at passage 40 have significantly higher levels of DNA damage compared to cells at passage 5 and 20 (Fig. 3). The exposure to H2O2 resulted in a dose response effect on DNA damage - cells with higher passage, in general, accumulated a higher percentage of DNA damage (Fig. 3). The only exception was evident for passage 40 treated with 100 μM H2O2.
Pyruvate, Lactate and the cellular redox state
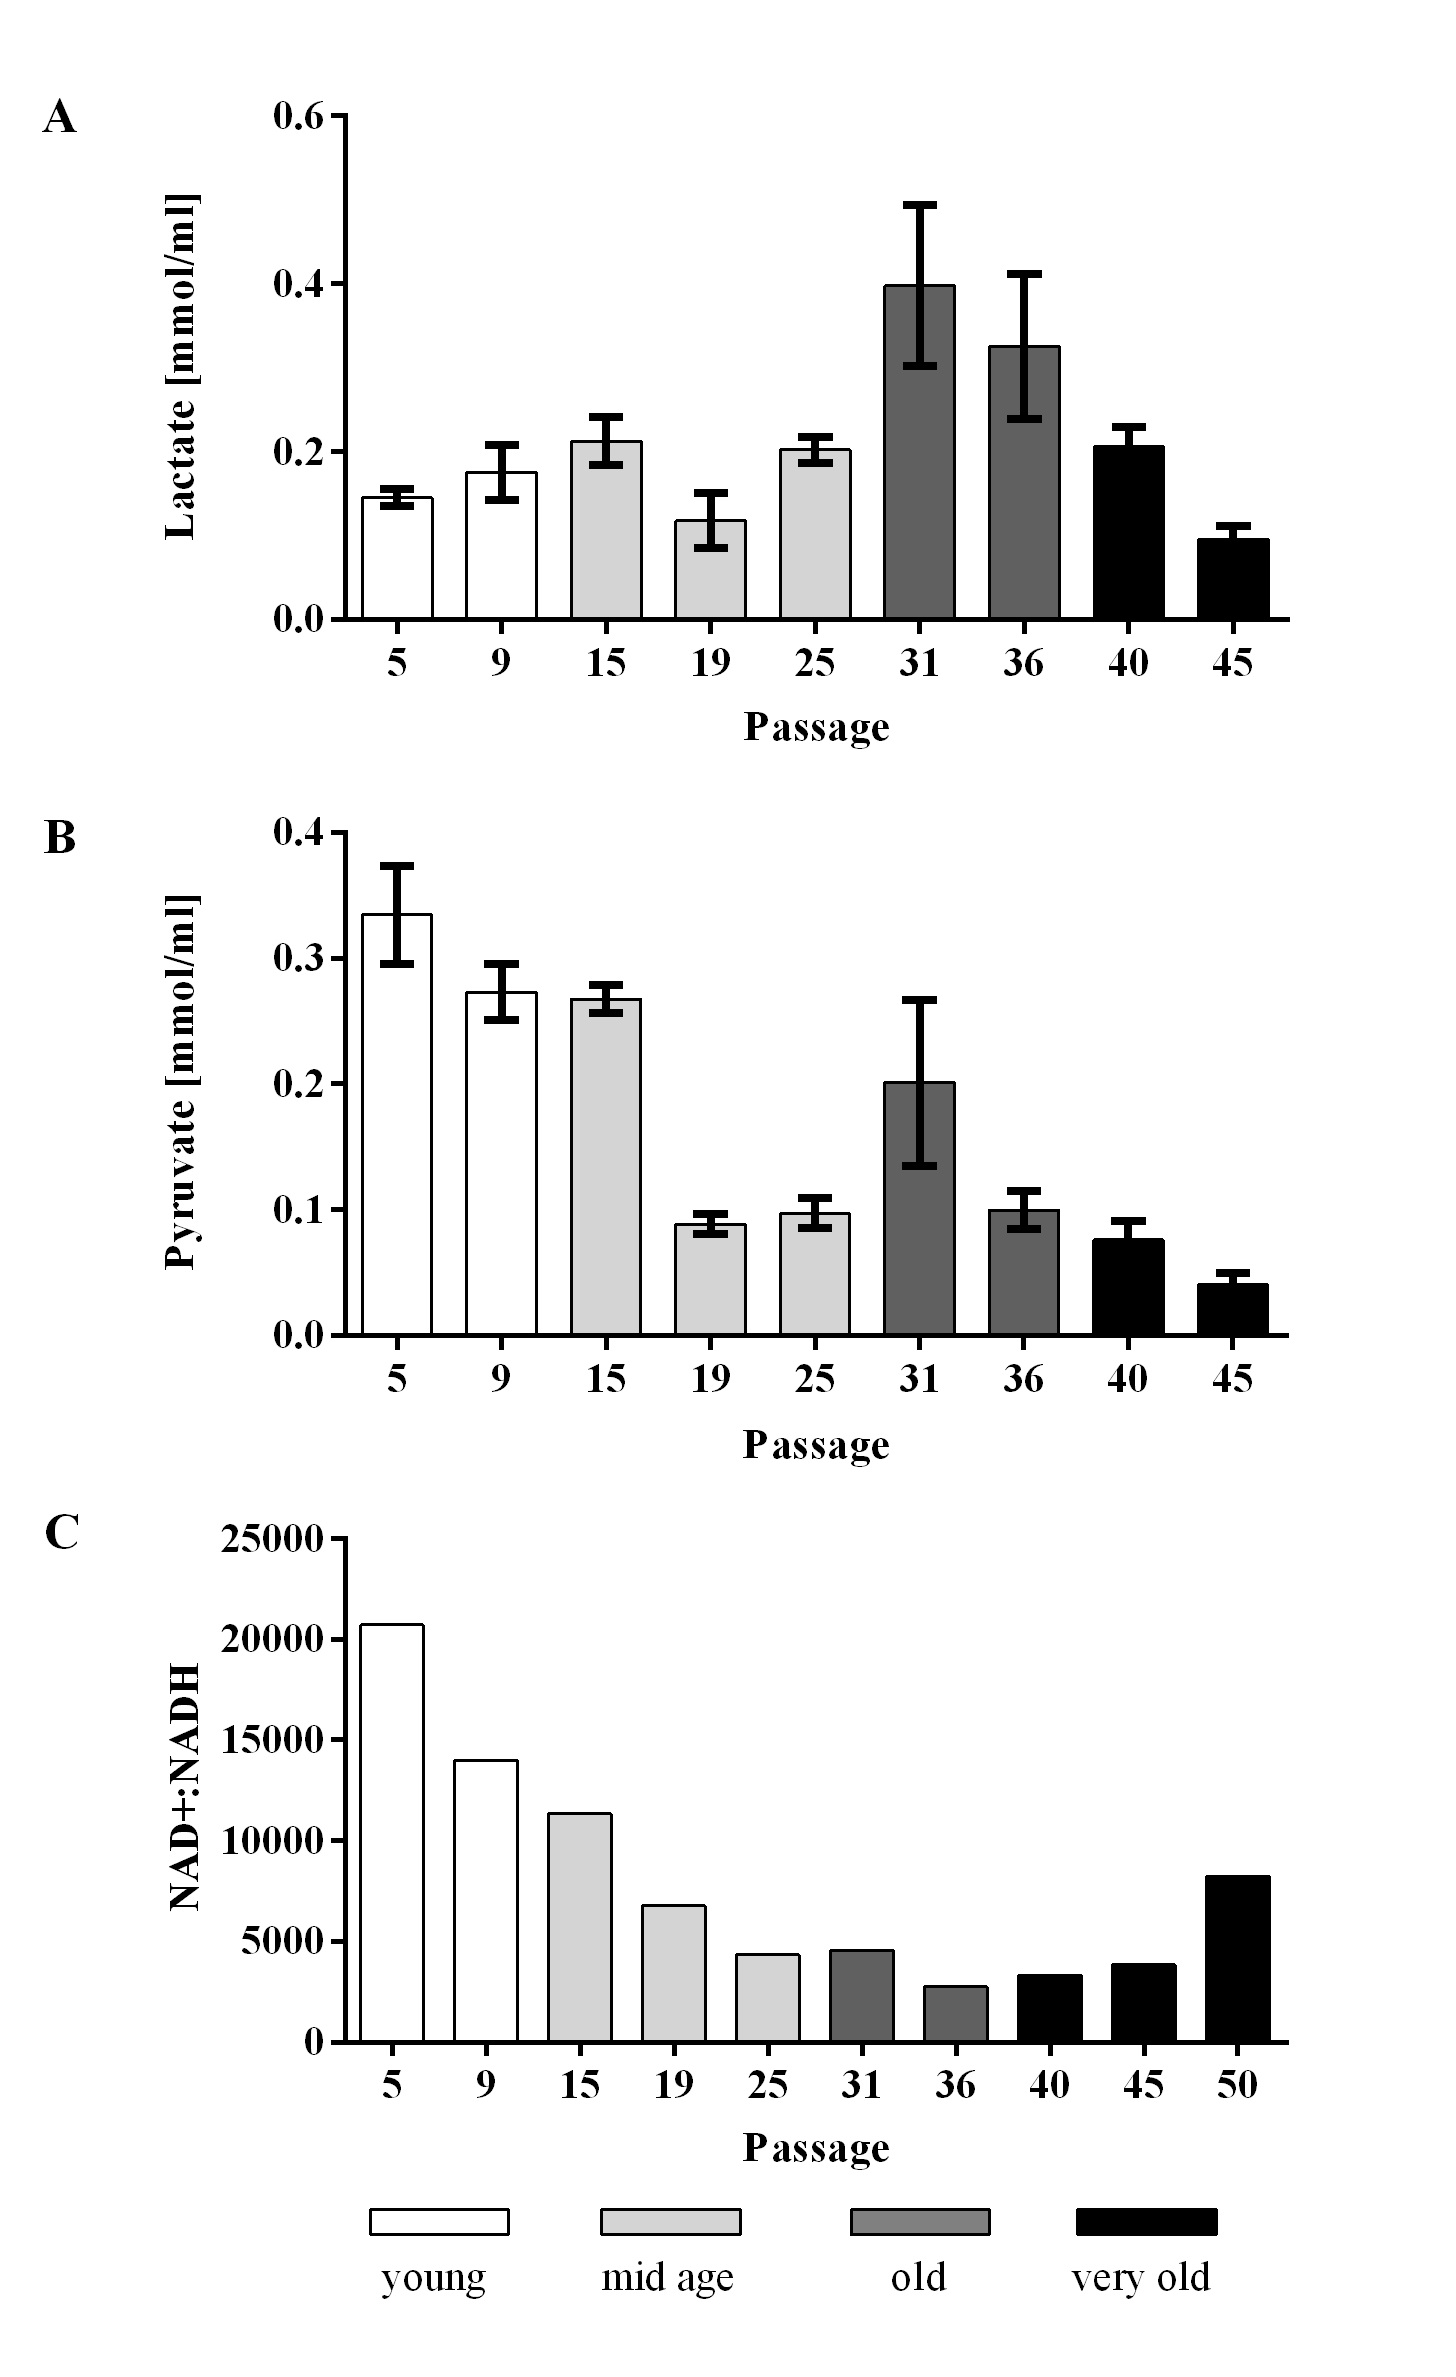
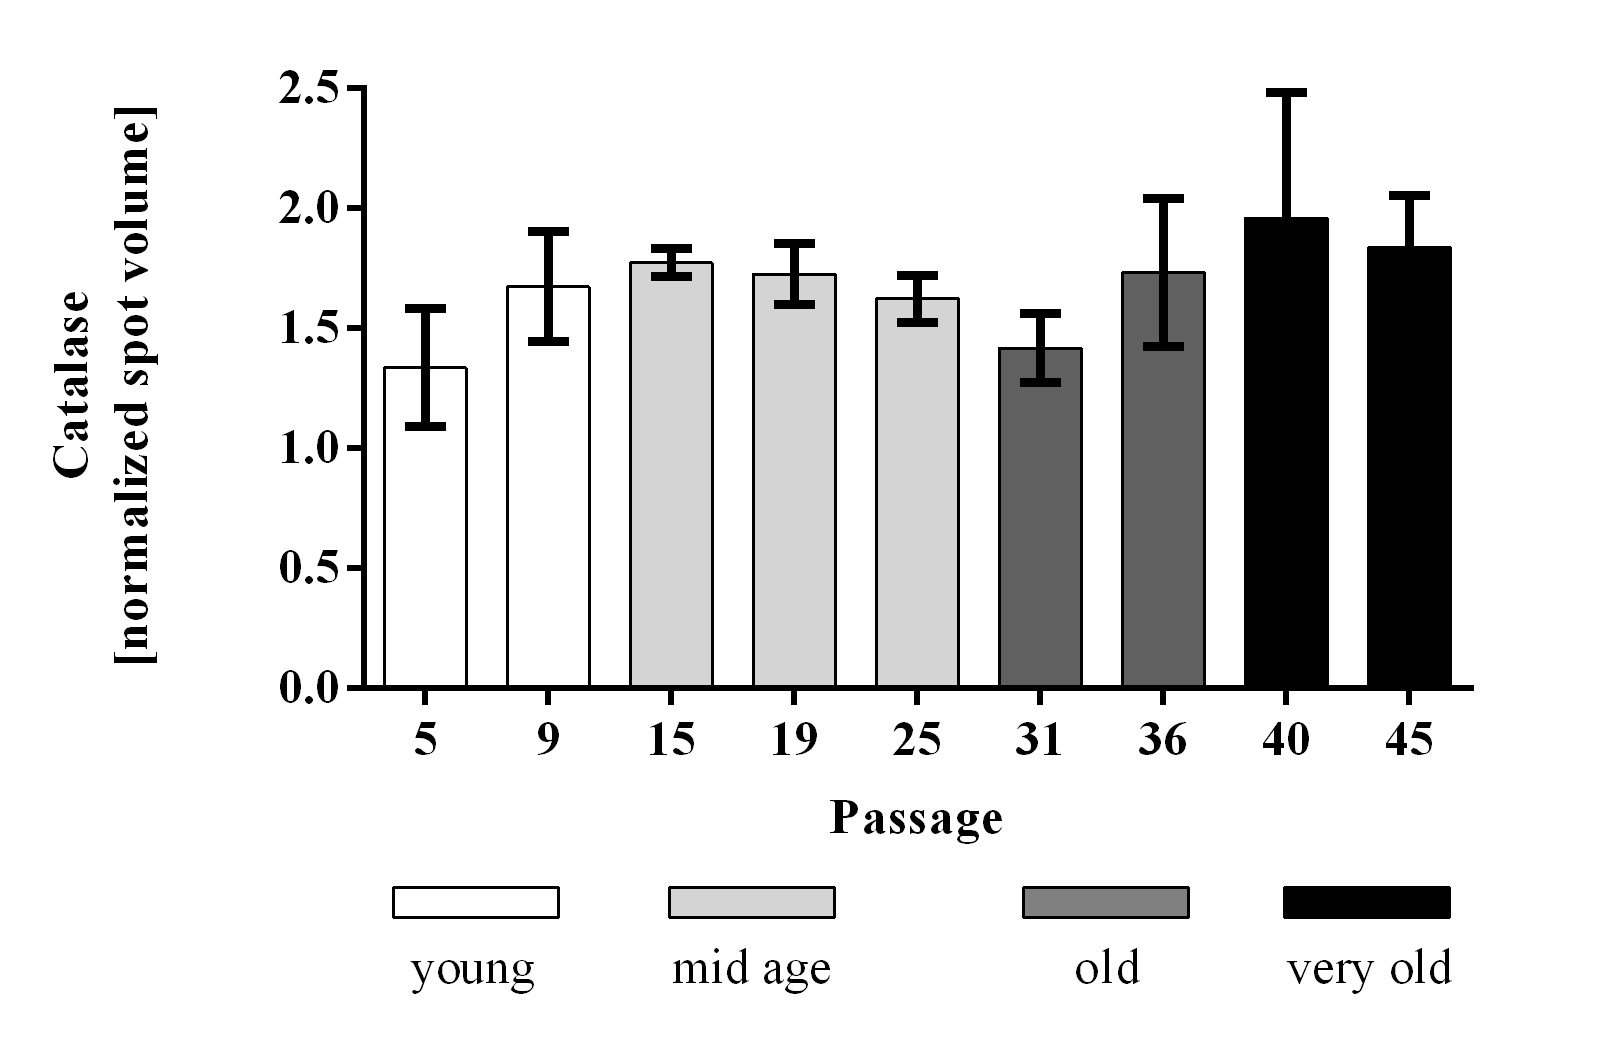
Lactate was increased in passages 31 and 36 and decreased in passages 40 and 45 (Fig. 4A). Pyruvate decreased significantly in aging cells (Fig. 4B). The redox status of the cells was determined using the NAD+:NADH ratio (pyruvate:lactate) [21, 22], which revealed a decrease meaning that with higher passage numbers the cells are going towards a reduced redox state (Fig. 4C). Catalase, which catalyzes the degradation of hydrogen peroxide to water and oxygen, did not show any changes in protein abundance in different cell passages (Fig. 5).
Extracellular Flux Measurements
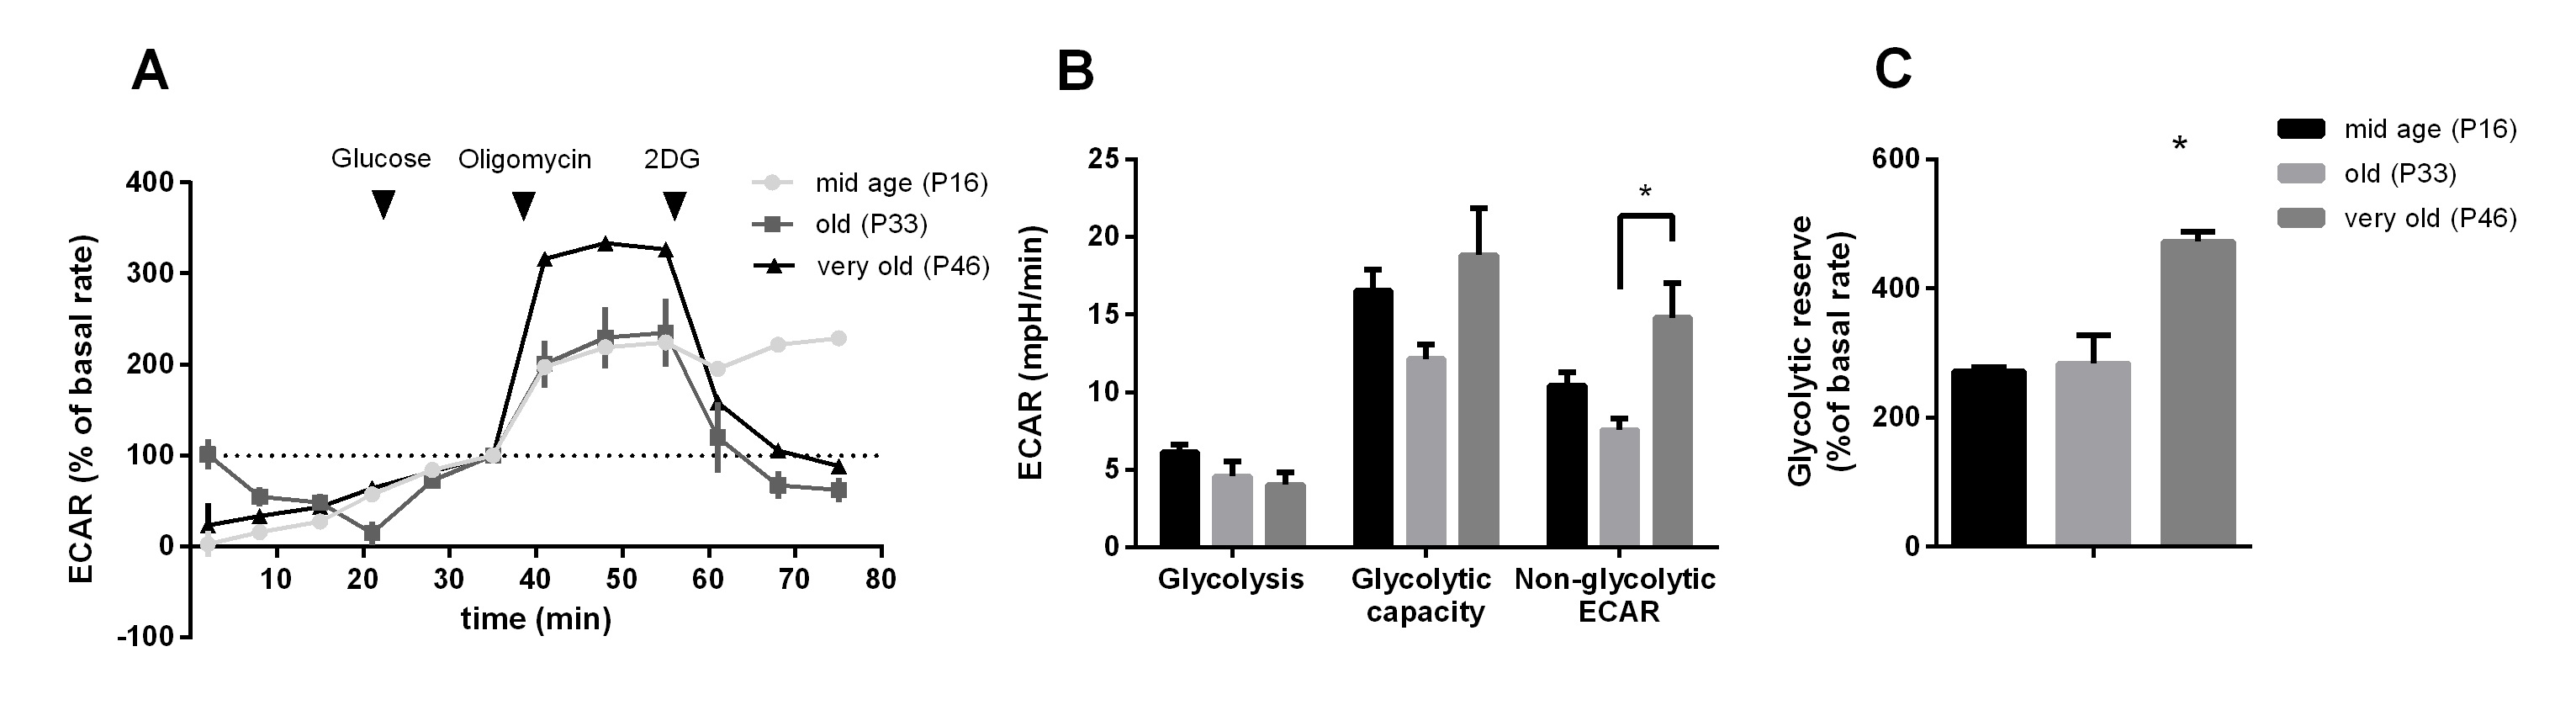
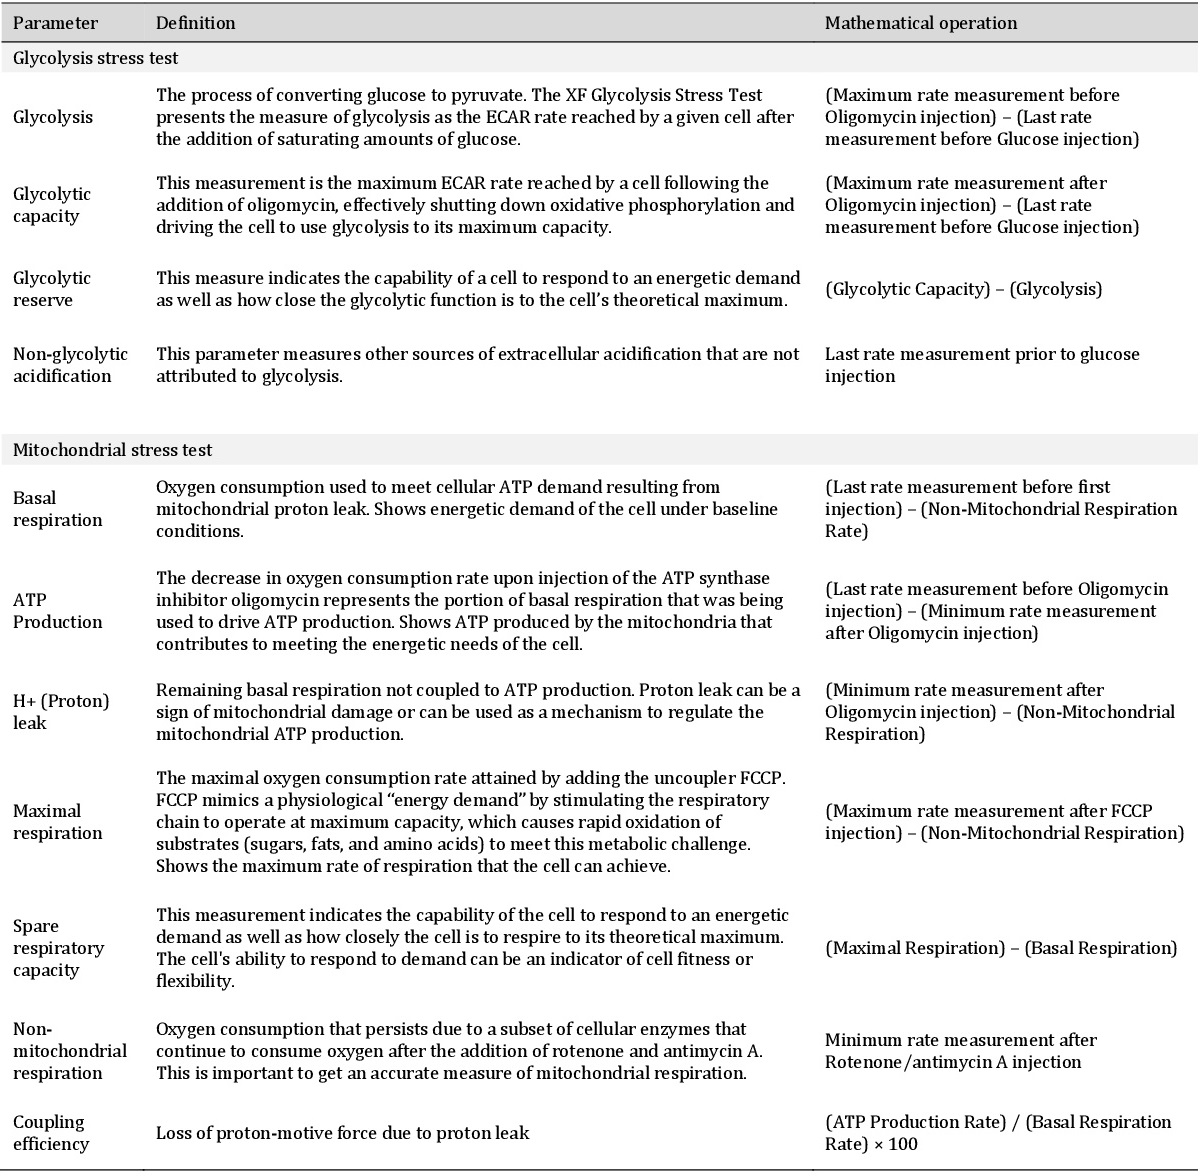
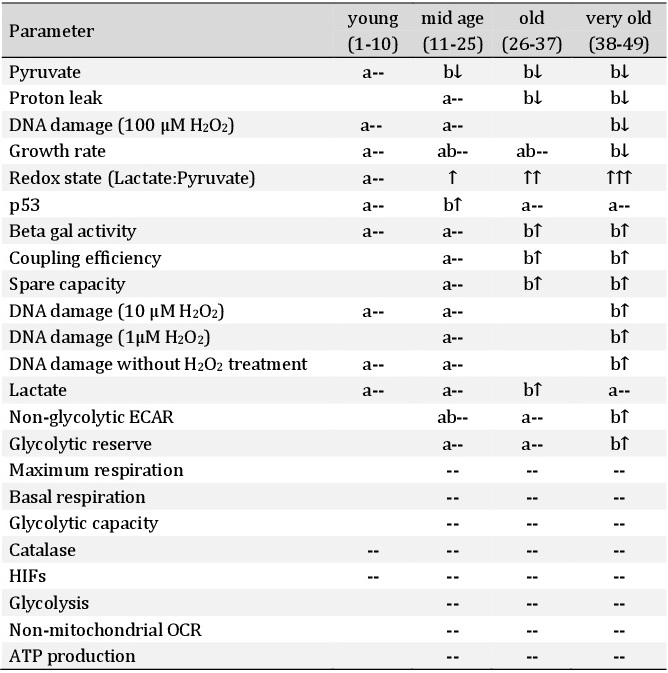
Oxygen consumption rate (OCR) and extracellular acidification rates (ECAR) were measured in mid age, old and very old passage groups. Glycolytic function was determined by applying the glycolysis stress test (Agilent, Fig. 6A). Basal glycolysis did not change between different passages. Non-glycolytic acidification was significantly increased in passage 46 (very old) compared to passage 33 (old) (Fig. 6B). The glycolytic reserve increased in passage 46 (Fig. 6C). The parameters are explained in more detail in Table 1 as stated in the glycolysis stress test (and mitochondrial stress test) user manual provided by the kit manufacturer (Agilent).
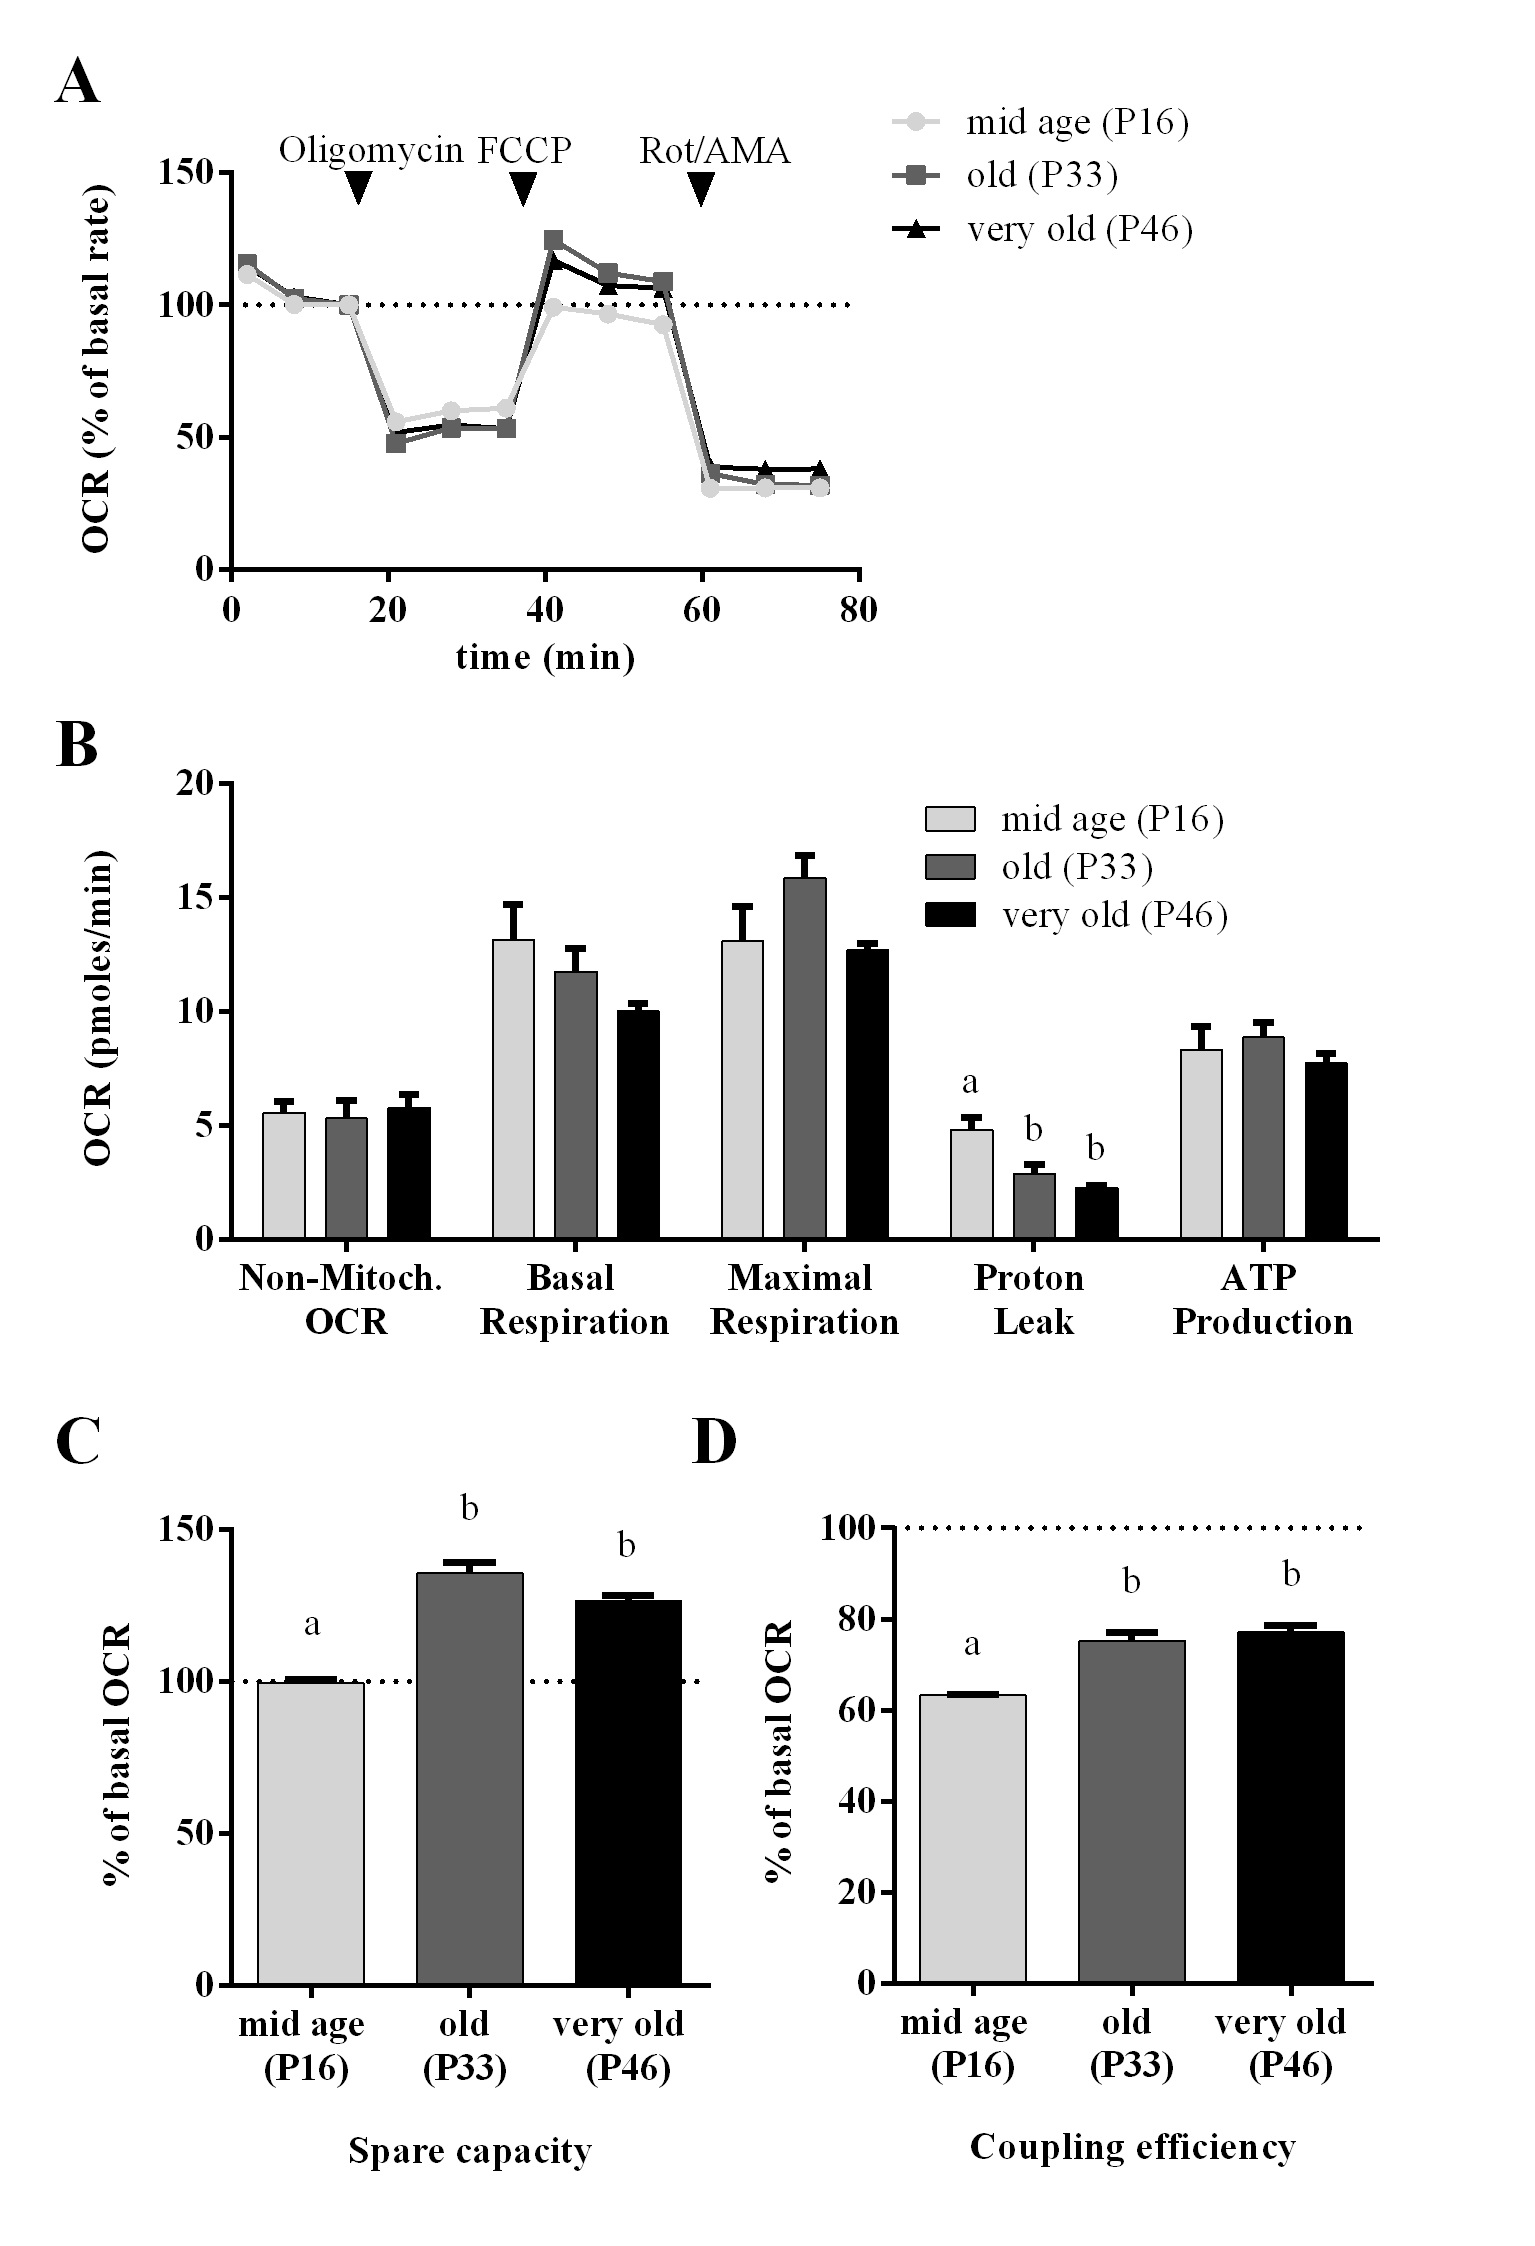
A mitochondrial stress test (Agilent) revealed that non-mitochondrial OCR, basal- and maximum respiration as well as ATP production did not change (Fig. 7A-B). However, proton leak decreased in higher passages and coupling efficiency as well as spare capacity increased significantly (Fig. 7B-C).
Regarding glycolytic function and mitochondrial parameters, we can assume that the metabolic potential (glycolytic reserve and mitochondrial spare capacity) of cells from higher passages increased.
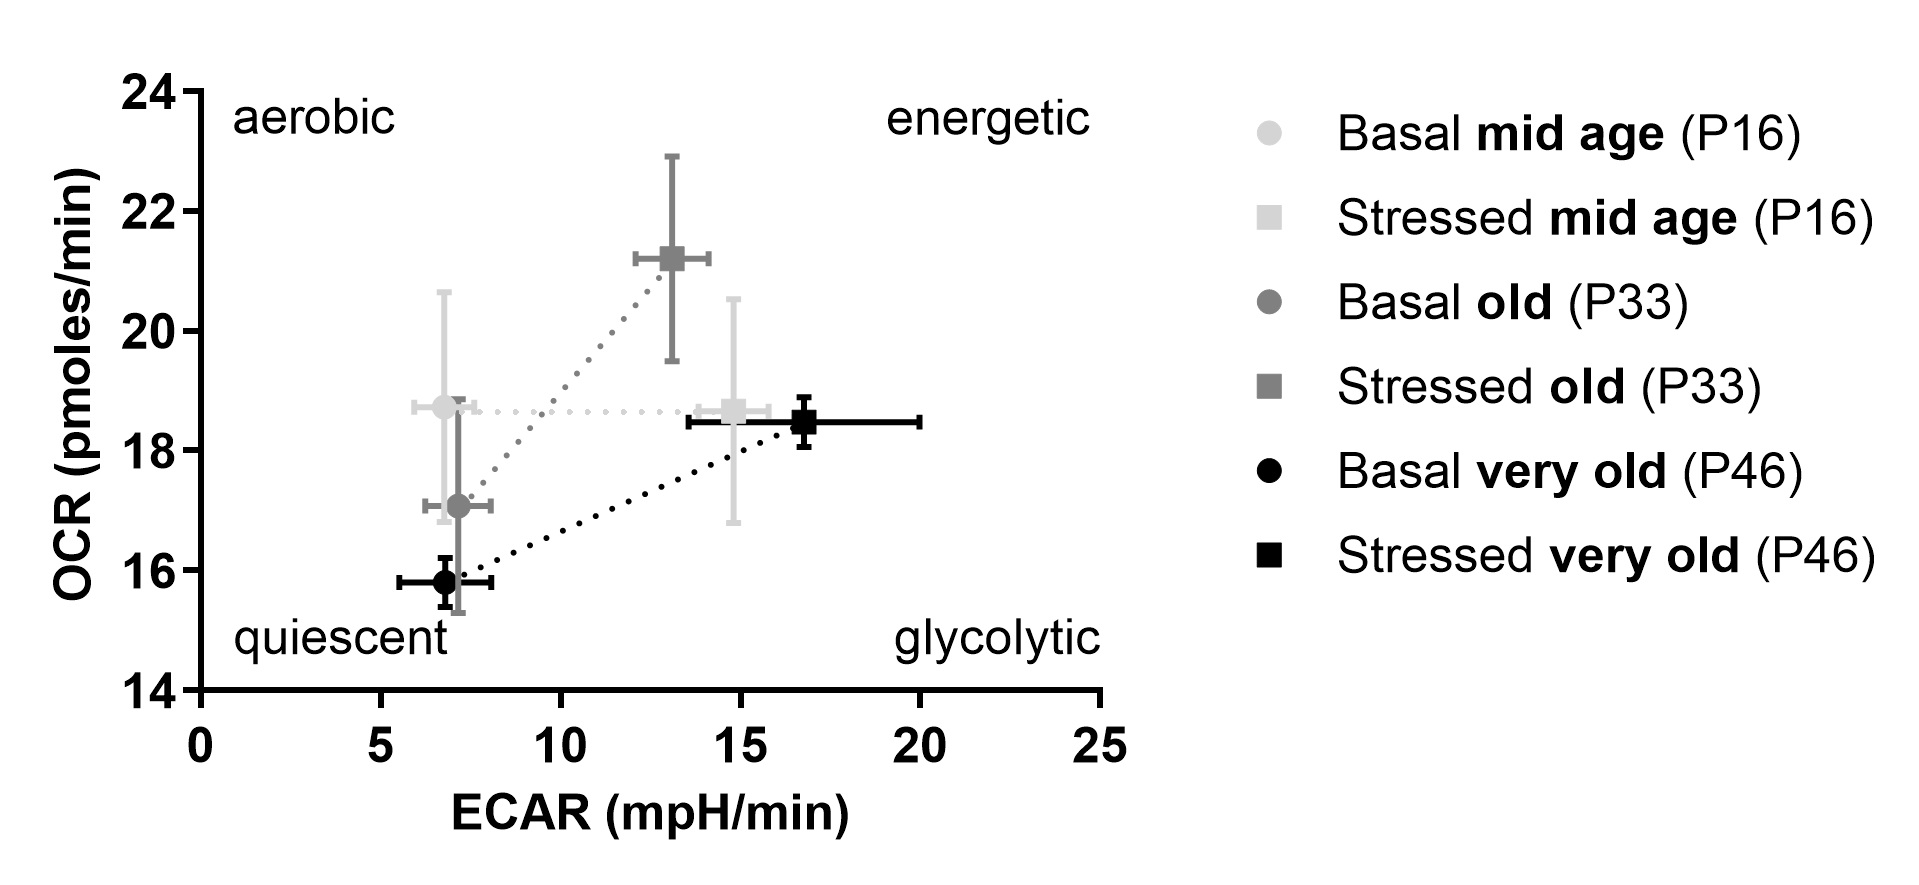
Finally, the stress response of OCR and ECAR to inhibition with FCCP and Oligomycin can be plotted against each other to depict the energy phenotype of the cells (Fig. 8) and to investigate metabolic switching. Under FCCP and Oligomycin inhibition OCR as well as ECAR are at maximum due to mitochondrial uncoupling and glycolysis-restricted ATP production, respectively. Interestingly, all three age groups upregulate their ECAR whereas only old and very old age groups also respond with a higher OCR to the stress. Table 2 gives a summary and overview of all the results.
HIF protein expression
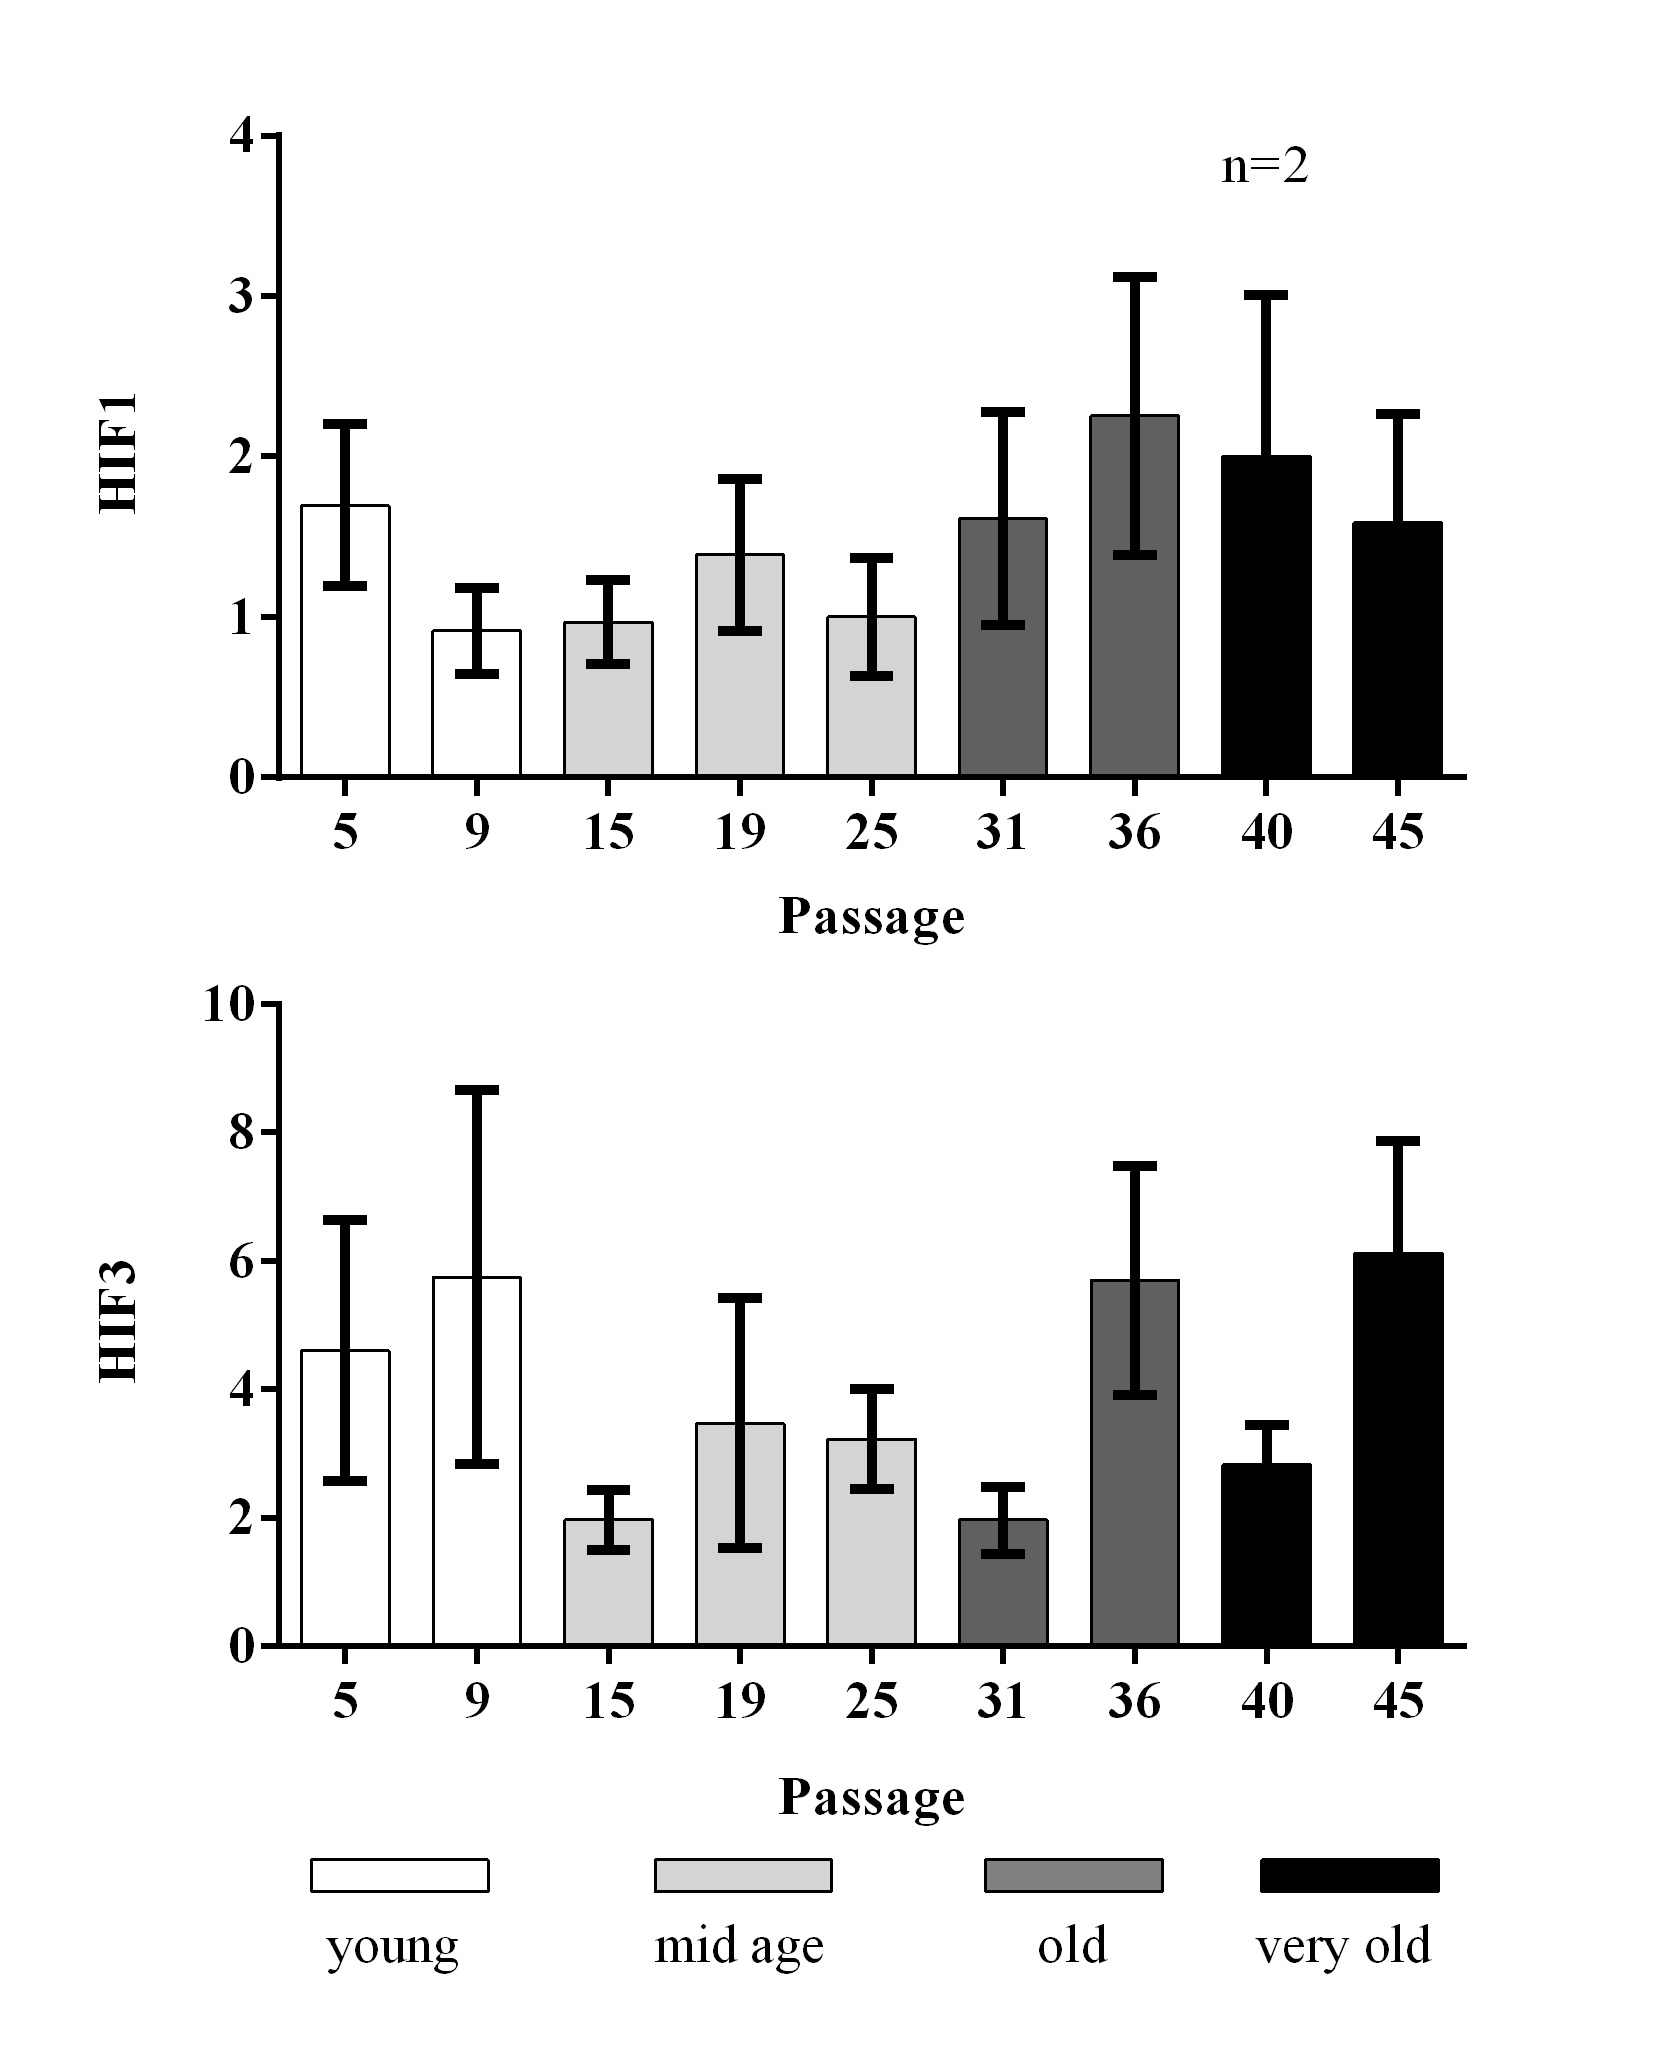
Since longevity has been linked to hypoxia and therefore also the hypoxia inducible factor (HIF), we determined HIF1 and HIF3 protein levels, which did not change in different cell passages (Fig. 9).
Multidimensional scaling (MDS) or Principal Co-ordinate analysis
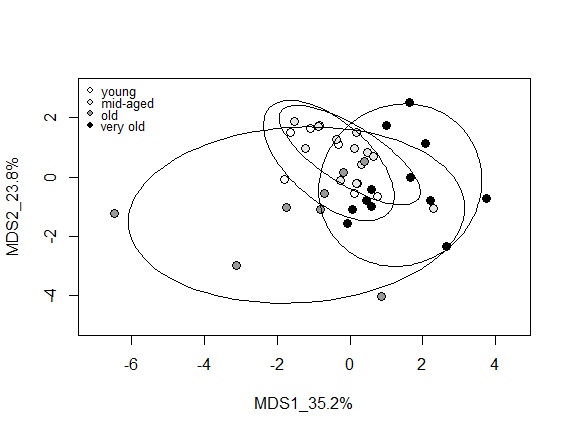
MDS analysis was performed on 8 variables (beta-gal activity, p53, DNA damage, lactate, pyruvate, catalase, HF1, HF3) and passage numbers 5, 9, 15 (young), 19, 25 (mid aged), 31, 36 (old), 40, 45, 50 (very old cells). This dataset encompassed those analyses that were performed on most passage numbers. Significant separation between cell passages based on age class was observed in both MDS dimensions. In MDS1 young and old cells were significantly separated from very old cells and in MDS2 young and mid-aged cells cells separated significantly from old cells. It is evident that young and mid-aged cells group closely together, whereas old and very old cells are more spread out, pointing to the inconsistent response (Fig. 10).
• Very old cells show an increased level of basal DNA damage.
• Higher passage numbers show an increased metabolic capacity.
• A continuous shift in aging cells to a reduced cellular redox state can be observed.
• Young and mid-aged cells cluster together and show more similarity to very old rather than old cells.
• Non-linear effects of several physiological parameters have been observed from cells of different passage numbers.
We thank Lorenz Spechtenhauser for his contribution to literature search and Scarlett Treml for her contribution to the lab work.
Author Contributions
MS Investigation, Writing – Original Draft, Review and Editing; BP Investigation; BF Investigation; ME Conceptualisation, Writing – Review and Editing; AS Investigation, Formal analysis, Writing – Review and Editing; MH Visualization, Conceptualization, Formal analysis, Writing – Original Draft, Review and Editing.
The authors declare that no conflicts of interest exist.
| 1 Pouliott C, Dupuis M, Appler K, Brunt S, Rudd R, Davis A: Susceptibility of neuroblastoma cells to rabies virus may be affected by passage number. J Virol Methods 2017;247:28-31. https://doi.org/10.1016/j.jviromet.2017.05.005 |
||||
| 2 Pronsato L, La Colla A, Ronda AC, Milanesi L, Boland R, Vasconsuelo A: High passage numbers induce resistance to apoptosis in C2C12 muscle cells. Biocell 2013;37:1-9. https://doi.org/10.32604/biocell.2013.37.001 |
||||
| 3 Kwist K, Bridges WC, Burg KJL: The effect of cell passage number on osteogenic and adipogenic characteristics of D1 cells. Cytotechnology 2016;68:1661-1667. https://doi.org/10.1007/s10616-015-9883-8 |
||||
| 4 Mouriaux F, Zaniolo K, Bergeron MA, Weidmann C, De La Fouchardière A, Fournier F, Droit A, Morcos MW, Landreville S, Guérin SL: Effects of long-term serial passaging on the characteristics and properties of cell lines derived from uveal melanoma primary tumors. Investig Ophthalmol Vis Sci 2016;57:5288-5301. https://doi.org/10.1167/iovs.16-19317 |
||||
| 5 Mohammadi Farsani T, Motevaseli E, Neyazi N, Khorramizadeh MR, Zafarvahedian E, Ghahremani MH: Effect of Passage Number and Culture Time on the Expression and Activity of Insulin-Degrading Enzyme in Caco-2 Cells. Iran Biomed J 2018;22:70-75. | ||||
| 6 Senarathna SMDKG, Crowe A: The influence of passage number for Caco2 cell models when evaluating P-gp mediated drug transport. Pharmazie 2015;70:798-803. | ||||
| 7 Hughes P, Marshall D, Reid Y, Parkes H, Gelber C: The costs of using unauthenticated, over-passaged cell lines: How much more data do we need? Biotechniques 2007;43:575-586. https://doi.org/10.2144/000112598 |
||||
| 8 Wenger SL, Senft JR, Sargent LM, Bamezai R, Bairwa N, Grant SG: Comparison of established cell lines at different passages by karyotype and comparative genomic hybridization. Biosci Rep 2004;24:631-639. https://doi.org/10.1007/s10540-005-2797-5 |
||||
| 9 Inzunza J, Sahlén S, Holmberg K, Strömberg AM, Teerijoki H, Blennow E, Hovatta O, Malmgren H: Comparative genomic hybridization and karyotyping of human embryonic stem cells reveals the occurrence of an isodicentric X chromosome after long-term cultivation. Mol Hum Reprod 2004;10:461-466. https://doi.org/10.1093/molehr/gah051 |
||||
| 10 Xie X, Hiona A, Lee AS, Cao F, Huang M, Li Z, Cherry A, Pei X, Wu JC: Effects of long-term culture on human embryonic stem cell aging. Stem Cells Dev 2011;20:127-138. https://doi.org/10.1089/scd.2009.0475 |
||||
| 11 Mitalipova MM, Rao RR, Hoyer DM, Johnson JA, Meisner LF, Jones KL, Dalton S, Stice SL: Preserving the genetic integrity of human embryonic stem cells. Nat Biotechnol 2005;23:19-20. https://doi.org/10.1038/nbt0105-19 |
||||
| 12 Cao J, Wu X, Qin X, Li Z: Uncovering the Effect of Passage Number on HT29 Cell Line Based on the Cell Metabolomic Approach. J Proteome Res 2021;20:1582-1590. https://doi.org/10.1021/acs.jproteome.0c00806 |
||||
| 13 Gilbert SF: Aging: The Biology of Senescence. Developmental Biology. Sunderland (MA), Sinauer Associates, 2000, ed 6. URL: https://www.ncbi.nlm.nih.gov/books/NBK10041/. | ||||
| 14 Sharpless NE, Sherr CJ: Forging a signature of in vivo senescence. Nat Rev Cancer 2015;15:397-408. https://doi.org/10.1038/nrc3960 |
||||
| 15 Pando MP, Pinchak AB, Cermakian N, Sassone-Corsi P: A cell-based system that recapitulates the dynamic light-dependent regulation of the vertebrate clock. Proc Natl Acad Sci U S A. 2001;98:10178-10183. https://doi.org/10.1073/pnas.181228598 |
||||
| 16 Hirayama J, Cardone L, Doi M, Sassone-Corsi P: Common pathways in circadian and cell cycle clocks: Light-dependent activation of Fos/AP-1 in zebrafish controls CRY-1a and WEE-1. Proc Natl Acad Sci 2005;102:10194-10199. https://doi.org/10.1073/pnas.0502610102 |
||||
| 17 Kopp R, Köblitz L, Egg M, Pelster B: HIF signaling and overall gene expression changes during hypoxia and prolonged exercise differ considerably. Physiol Genomics 2011;43:506-516. https://doi.org/10.1152/physiolgenomics.00250.2010 |
||||
| 18 Singh NP, McCoy MT, Tice RR, Schneider EL: A simple technique for quantitation of low levels of DNA damage in individual cells. Exp Cell Res 1988;175:184-191. https://doi.org/10.1016/0014-4827(88)90265-0 |
||||
| 19 Koñca K, Lankoff a, Banasik a, Lisowska H, Kuszewski T, Góźdź S, Koza Z, Wojcik A: A cross platform public domain PC image analysis program for the comet assay. Mutat Res 2003;534:15-20. https://doi.org/10.1016/S1383-5718(02)00251-6 |
||||
| 20 R Core Team: R: A languabe and Environment for statistical computing. R Foundation for Statistical Computing, Vienna, Austria, 2020. URL: https://www.eea.europa.eu/data-and-maps/indicators/oxygen-consuming-substances-in-rivers/r-development-core-team-2006. | ||||
| 21 Sun F, Dai C, Xie J, Hu X: Biochemical Issues in Estimation of Cytosolic Free NAD/NADH Ratio. PLoS One 2012;7:e34525. https://doi.org/10.1371/journal.pone.0034525 |
||||
| 22 Sandbichler AM, Jansen B, Peer BA, Paulitsch M, Pelster B, Egg M. Metabolic Plasticity Enables Circadian Adaptation to Acute Hypoxia in Zebrafish Cells. Cell Physiol Biochem 2018;46:1159-1174. https://doi.org/10.1159/000489058 |
||||
| 23 Maier AB, Westendorp RGJ, Van Heemst D: β-Galactosidase activity as a biomarker of replicative senescence during the course of human fibroblast cultures. Ann N Y Acad Sci 2007;1100:323-332. https://doi.org/10.1196/annals.1395.035 |
||||
| 24 Levy SF, Ziv N, Siegal ML: Bet Hedging in Yeast by Heterogeneous, Age-Correlated Expression of a Stress Protectant. PLoS Biol 2012;10:e1001325. https://doi.org/10.1371/journal.pbio.1001325 |
||||
| 25 James EL, Michalek RD, Pitiyage GN, De Castro AM, Vignola KS, Jones J, Mohney RP, Karoly ED, Prime SS, Parkinson EK: Senescent Human Fibroblasts Show Increased Glycolysis and Redox Homeostasis with Extracellular Metabolomes That Overlap with Those of Irreparable DNA Damage, Aging, and Disease. J Proteome Res 2015;14:1854-1871. https://doi.org/10.1021/pr501221g |
||||
| 26 Liu B, Chen Y, St Clair DK: ROS and p53: A versatile partnership. Free Radic Biol Med 2008;44:1529-1535. https://doi.org/10.1016/j.freeradbiomed.2008.01.011 |
||||
| 27 Vousden KH, Prives C: Blinded by the Light: The Growing Complexity of p53. Cell 2009;137:413-431. https://doi.org/10.1016/j.cell.2009.04.037 |
||||
| 28 Wu D, Prives C: Relevance of the p53-MDM2 axis to aging. Cell Death Differ 2018;25:169-179. https://doi.org/10.1038/cdd.2017.187 |
||||
| 29 Nicolai S, Rossi A, Di Daniele N, Melino G, Annicchiarico-Petruzzelli M, Raschellà G: DNA repair and aging: the impact of the p53 family. Aging (Albany NY) 2015;7:1050-1065. https://doi.org/10.18632/aging.100858 |
||||
| 30 Moskalev AA, Shaposhnikov M V., Plyusnina EN, Zhavoronkov A, Budovsky A, Yanai H, Fraifeld VE: The role of DNA damage and repair in aging through the prism of Koch-like criteria. Ageing Res Rev 2013;12:661-684. https://doi.org/10.1016/j.arr.2012.02.001 |
||||
| 31 López-Diazguerrero NE, Luna-López A, Gutiérrez-Ruiz MC, Zentella A, Königsberg M: Susceptibility of DNA to oxidative stressors in young and aging mice. Life Sci 2005;77:2840-2854. https://doi.org/10.1016/j.lfs.2005.05.034 |
||||
| 32 Maslov AY, Ganapathi S, Westerhof M, Quispe-Tintaya W, White RR, Van Houten B, Reiling E, Dollé MET, van Steeg H, Hasty P, Hoeijmakers JHJ, Vijh G: DNA damage in normally and prematurely aged mice. Aging Cell 2013;12:467-77. https://doi.org/10.1111/acel.12071 |
||||
| 33 Wang JL, Wang PC: The effect of aging on the DNA damage and repair capacity in 2BS cells undergoing oxidative stress. Mol Biol Rep 2012;39:233-241. https://doi.org/10.1007/s11033-011-0731-4 |
||||
| 34 Van Meter M, Simon M, Tombline G, May A, Morello TD, Hubbard BP, Bredbenner K, Park R, Sinclair DA, Bohr VA, Gorbunova V, Seluanov A: JNK Phosphorylates SIRT6 to Stimulate DNA Double-Strand Break Repair in Response to Oxidative Stress by Recruiting PARP1 to DNA Breaks. Cell Rep 2016;16:2641-2650. https://doi.org/10.1016/j.celrep.2016.08.006 |
||||
| 35 Wolf FI, Torsello A, Covacci V, Fasanella S, Montanari M, Boninsegna A, Cittadini A: Oxidative DNA damage as a marker of aging in WI-38 human fibroblasts. Exp Gerontol 2002;37:647-656. https://doi.org/10.1016/S0531-5565(02)00005-0 |
||||
| 36 Dikova V, Vorhauser J, Geng A, Pelster B, Sandbichler AM: Metabolic interaction of hydrogen peroxide and hypoxia in zebrafish fibroblasts. Free Radic Biol Med 2020;152:469-481. https://doi.org/10.1016/j.freeradbiomed.2019.11.015 |
||||
| 37 Štambuk A, Pavlica M, Malović L, Klobučar GIV: Persistence of DNA damage in the freshwater mussel Unio pictorum upon exposure to ethyl methanesulphonate and hydrogen peroxide. Environ Mol Mutagen 2008;49:217-225. https://doi.org/10.1002/em.20376 |
||||
| 38 Sandbichler AM, Höckner M: Cadmium Protection Strategies--A Hidden Trade-Off? Int J Mol Sci 2016;17:139. https://doi.org/10.3390/ijms17010139 |
||||
| 39 Berkers CR, Maddocks ODK, Cheung EC, Mor I, Vousden KH: Metabolic regulation by p53 family members. Cell Metab 2013;18:617-633. https://doi.org/10.1016/j.cmet.2013.06.019 |
||||
| 40 Contractor T, Harris CR: p53 negatively regulates transcription of the pyruvate dehydrogenase kinase Pdk2 Cancer Res 2012;72:560-567. https://doi.org/10.1158/0008-5472.CAN-11-1215 |
||||
| 41 Zelenka J, Dvořák A, Alán L: L-Lactate protects skin fibroblasts against aging-Associated mitochondrial dysfunction via mitohormesis. Oxid Med Cell Longev 2015;2015:351698. https://doi.org/10.1155/2015/351698 |
||||
| 42 Philp A, Macdonald AL, Watt PW: Lactate - a signal coordinating cell and systemic function. J Exp Biol 2005;208:4561-4575. https://doi.org/10.1242/jeb.01961 |
||||
| 43 Yu DM, Jung SH, An HT, Lee S, Hong J, Park JS, Lee H, Lee H, Bahn MS, Lee HC, Han NK, Ko J, Lee JS, Ko YG: Caveolin-1 deficiency induces premature senescence with mitochondrial dysfunction. Aging Cell 2017;16:773-784. https://doi.org/10.1111/acel.12606 |
||||
| 44 Braidy N, Guillemin GJ, Mansour H, Chan-Ling T, Poljak A, Grant R: Age related changes in NAD+ metabolism oxidative stress and Sirt1 activity in wistar rats. PLoS One 2011;6:e19194. https://doi.org/10.1371/journal.pone.0019194 |
||||
| 45 Gaude E, Schmidt C, Gammage PA, Dugourd A, Blacker T, Chew SP, Saez-Rodriguez J, O'Neill JS, Szabadkai G, Minczuk M, Frezza C: NADH Shuttling Couples Cytosolic Reductive Carboxylation of Glutamine with Glycolysis in Cells with Mitochondrial Dysfunction. Mol Cell 2018;69:581-593.e7. https://doi.org/10.1016/j.molcel.2018.01.034 |
||||
| 46 Schwartzenberg-Bar-Yoseph F, Armoni M, Karnieli E: The Tumor Suppressor p53 Down-Regulates Glucose Transporters GLUT1 and GLUT4 Gene Expression. Cancer Res 2004;64:2627-2633. https://doi.org/10.1158/0008-5472.CAN-03-0846 |
||||
| 47 Mehta R, Steinkraus KA, Sutphin GL, Ramos FJ, Shamieh LS, Huh A, Davis C, Chandler-Brown D, Kaeberlein M: Proteasomal Regulation of the Hypoxic Response Modulates Aging in C. elegans. Science 2009;324:1196-1198. https://doi.org/10.1126/science.1173507 |
||||
| 48 Poulios E, Trougakos IP, Chondrogianni N, Gonos ES: Exposure of human diploid fibroblasts to hypoxia extends proliferative life span. Ann N Y Acad Sci 2007;1119:9-19. https://doi.org/10.1196/annals.1404.025 |
||||
| 49 Leiser SF, Kaeberlein M: The hypoxia-inducible factor HIF-1 functions as both a positive and negative modulator of aging. Biol Chem 2010;391:1131-1137. https://doi.org/10.1515/bc.2010.123 |
||||