×
![]()
Corresponding Author: Marta Wołosowicz
Medical University of Bialystok, Department of Physiology, Medical University of Bialystok, 2c Mickiewicza Street, Bialystok, Podlaskie, 15222 (Poland)
Tel. +48691530998 , E-Mail marta.wolosowicz@umb.edu.pl
Diverse Impact of N-Acetylcysteine or Alpha-Lipoic Acid Supplementation during High-Fat Diet Regime on Matrix Metalloproteinase-2 and Matrix Metalloproteinase-9 in Visceral and Subcutaneous Adipose Tissue
Marta Wołosowicza Bartłomiej Łukaszuka Irena Kasackab Adrian Chabowskia
aDepartment of Physiology, Medical University of Bialystok, Bialystok, Poland, bDepartment of Histology and Cytophysiology, Medical University of Bialystok, Bialystok, Poland
Introduction
Nowadays, overweight and obesity are considered global epidemics and are the leading causes of death (roughly 2.8 million people die each year because of the conditions) [1]. Obesity is the main factor predisposing to the development of cardiovascular, respiratory, neurological, gastrointestinal, hepatic, endocrine, skeletal, and renal complications, as well as to a significant psychosocial burden or an increased incidence of cancer [2, 3]. The risk of obesity-related complications is associated with the amount of adipose tissue, its location (abdominal obesity or gluteal-femoral obesity), and the duration of the underlying disease [3].
Recent studies have demonstrated that matrix metalloproteinases (MMPs) are involved in processes taking place in adipose tissue, such as adipogenesis and angiogenesis. The sources of MMPs include adipocytes, preadipocytes, fibroblasts, endothelial cells, as well as immune cells [4]. MMPs are involved in physiological and pathological complications of obesity through the degradation and remodeling of the extracellular matrix (ECM) molecules [5]. In this research, we were focused on metalloproteinases 2 (MMP2) and 9 (MMP9), otherwise known as gelatinases A and B, which belong to type IV collagenases. The main function of the gelatinases is the degradation of type IV collagen, which is the main component of the vascular basement membrane. Damage to this barrier facilitates the migration of leukocytes to adipose tissue, thus enhancing its inflammation. The activation of the leukocytes causes the release of pro-inflammatory cytokines and MMPs, the above drives the vicious circle even further [6].
A high-fat diet (HFD) regime, and thus a positive energy balance, causes obesity and contributes to the development of oxidative stress in the cells, the production of reactive oxygen species (ROS), and the progress of inflammation [7, 8]. The increase in the amount of ROS in adipose tissue leads to impaired adipogenesis, recruitment, and activation of macrophages, secretion of inflammatory adipokines, or damage to the tissue’s biological structures. The coexistence of oxidative stress and inflammation in adipose tissue contributes to the subsequent development of obesity and the formation of a vicious circle [9]. It was proved that antioxidants supplementation, e.g. with N-acetylcysteine (NAC) or alpha-lipoic acid (ALA), can reduce oxidative stress, the number of inflammatory cytokines, macrophage infiltration, and ultimately other complications of obesity [9, 10]. Hence, alteration in MMPs metabolism (e.g., MMP2 and MMP9) may be a therapeutic strategy for obesity and its complication. Thus, the goal of this study was to elucidate changes in adipose tissue matrix metalloproteinases, especially MMP2 and MMP9 after chronic antioxidants administration (NAC and ALA) after an HFD regime as a potential therapeutic strategy for obesity-related complications prevention.
Materials and Methods
Animals and Study Design
After six days of adaptation to the conditions in an animal facility, male Wistar rats were divided into the following four groups – control (CTRL), high-fat diet (HFD), a high-fat diet supplemented with N-acetylcysteine (HFD+NAC), and a high-fat diet supplemented with α-lipoic acid (HFD+ALA) (10 rats in each group). The CTRL group was formulated as the control for HFD, HFD+NAC, and HFD+ALA. Forty male Wistar rats were housed under standard conditions (21°C ± 2°C, 12h reverse light/dark cycle) with ad libitum access to a control standard chow (LSM, Agropol, Motycz, Poland; containing 10.3% fat, 24.2% protein, and 65.5% carbohydrate) or a high-fat diet (Research Diet, USA, catalog number D12492; containing 59.8% fat, 20.1% protein, 20.1% carbohydrate; 279.6 mg/kg of the cholesterol) from weaning until sacrifice. Wistar rats were fed a high-fat diet not isocaloric relative to control animals. After six weeks of the experiment, once daily, each morning between 8 and 9 am, the animals in the HFD+NAC group received N-acetylcysteine at a dose of 500 mg/kg body weight, whereas the rats from the HFD+ALA group received α-lipoic acid solution at a dose of 30 mg/kg body weight (once a day, every day for the consecutive 4 weeks). The solutions of NAC (Sigma-Aldrich, catalog number: A9165) and ALA (Sigma-Aldrich, catalog number: PHR2561-1G) were prepared by dissolving the substances in the saline solution and immediately applied intragastrically by gastric gavage to rats from appropriate groups. The doses were based on the literature analysis [11, 12]. We decided to use 500 mg/kg body weight of NAC and 30 mg/kg body weight of ALA as those are the most frequently used, non-toxic doses with proven antioxidative effects [11–13]. Similarly, saline (2 ml/kg body weight) was administered to the CTRL and HFD-fed rats. Body weight was monitored every day and the amount of NAC, ALA, or saline solution was adjusted accordingly. The intragastric administration of antioxidants ensured that rats obtained a full dose calculated for their body weight. According to each rat’s body weight, which was controlled every two days, the dose of antioxidants administration was adjusted. After ten weeks, the rats fasted twelve hours and were anesthetized by intraperitoneal phenobarbital injection (80 mg/kg body weight). The rats were placed lying down on a heating pad (37°C). Blood was drawn from the abdominal aorta and was immediately centrifuged to obtain plasma. Samples of adipose tissue (visceral and subcutaneous) were taken from the abdominal area. The harvested tissues were immediately frozen using aluminum forceps precooled with liquid nitrogen. All the obtained samples (adipose tissue and plasma) were stored at -80OC until further analysis. All the experimental procedures were approved by the Ethical Committee for Animal Experiments at the Medical University of Bialystok, Poland.
Adipose tissue Histopathology
The samples of visceral and subcutaneous adipose tissue of the rats were taken and immediately fixed in 10% buffered formalin and processed routinely for embedding in paraffin. The paraffin blocks were cut into 4 µm sections, attached to positively charged glass slides (Superfrost Plus; Menzel Gläser, Braunschweig, Germany), and stained with hematoxylin and eosin.
Paraffin-embedded sections were deparaffined and hydrated in pure alcohols.
Toluidine Blue Stain Kit (no cat. SS057 BioGenex; 49026 Milmont Drive, Fremont, CA 94538 USA) was used to stain mast cells. The kit included: potassium permanganate, potassium metabisulphite, Scott’s solution, Toluidine Blue Solution. The staining was done by following the manufacturer’s instructions attached to the kit.
Immunostaining was performed by the following protocol: for antigen retrieval, the sections were subjected to pretreatment in a pressure chamber and heated using Target Retrieval Solution (S 1699 Agilent Technologies, Inc. 5301 Stevens Creek Blvd Santa Clara, CA 95051, USA). After cooling down to room temperature, the sections were incubated with Peroxidase-Blocking Solution for 10 minutes to block endogenous peroxidase activity.
The sections with the monoclonal mouse primary antibody (Agilent Technologies, Inc.), CD68 (M0876), were incubated for 1 hour at RT in a humidified chamber. The antiserum was previously diluted in Antibody Diluent, Background Reducing, Ready-to-use diluent (S 3022 Agilent Technologies, Inc.) in a ratio of 1:50 for CD68.
The procedure was followed by incubation (30 minutes) with secondary antibody (EnVision FLEX, High pH (Link), HRP. Rabbit/Mouse. (K800021-2 Agilent Technologies, Inc. 5301 Stevens Creek Blvd Santa Clara, CA 95051, USA). The bound antibody was visualized by 1-min incubation with DAB Flex chromogen. Finally, the sections were counterstained in hematoxylin QS (H-3404, Vector Laboratories; Burlingame, CA), mounted, and evaluated under the light microscope. Appropriate washing with Wash Buffer (S 3006 Agilent Technologies, Inc.) was performed between each step (3 times for 2 minutes). Sections were dehydrated with absolute alcohol followed by xylene, and coverslipped with Entellan (Merck). The specificity of the antibody was confirmed using a negative control, which involved replacing the antibody with the Antibody Diluent (no staining), and positive control, which involved staining a human tonsil with CD68.
The assessment of the cell size and number of CD68 was performed by two experienced histologists (independent from each other) and analyzed with ImageJ software (The National Institutes of Health, MD, USA). Images were converted to 8-bit greyscale, and the background was subtracted. Then, the binary threshold function was adjusted to separate the cells from background staining. The total cells area was calculated as the total number of pixels in images with a set threshold [14, 15]. Results were plotted in GraphPad Prism 8 (GraphPad Software, La Jolla, CA, USA). Results are depicted as mean ± standard deviations. The statistical significance level was set as p <0.05.
Quantitative Real-Time Polymerase Chain Reaction (RT-PCR)
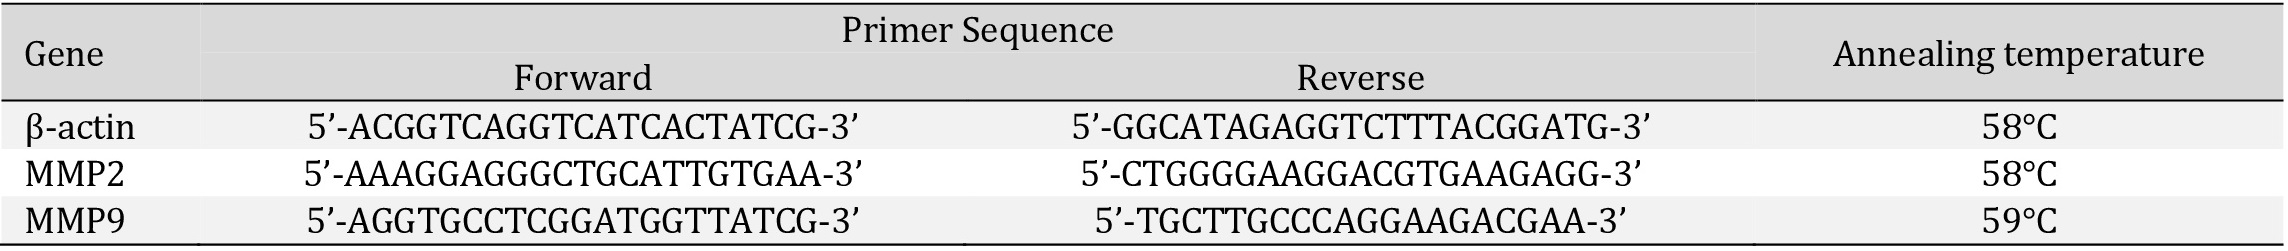
Total RNA was isolated from the rats’ visceral and subcutaneous adipose tissue using the TriRreagent RNA Isolation Reagent according to the manufacturer’s protocol (Sigma-Aldrich). The total RNA amount was determined by spectrophotometry and RNA quality was verified by measuring the sample’s absorbencies at 260 and 280 nm [16]. The synthesis of the complementary DNA was done using the EvoScript universal cDNA master kit (Roche Molecular Systems, Boston, MA, USA). Specific primers used in this study are presented in Table 1. Real-time PCR was carried out using the LightCycler 96 System Real-Time thermal cycler with FastStart Essential DNA Green Master (Roche Molecular Systems). Cycling conditions were: 15s denaturation at 95°C, 15s annealing at 58°C for β-actin, MMP2, and 59°C for MMP9, and 15s extension at 72°C for 45 cycles. Melting curve analysis was performed before each reaction to verify PCR product specificity. The mRNA levels of the target genes were normalized to the rat’s β-actin and calculated according to the Pfaffl method [17].
Proteins Analysis
To investigate the protein expression of various MMPs in visceral and subcutaneous adipose tissue extracts, we used Western blot analysis. The samples were homogenized in an ice-cold RIPA buffer containing a cocktail of protease and phosphatase inhibitors (Roche Diagnostics GmbH, Mannheim, Germany). The total protein concentration was determined using the BCA method with bovine serum albumin (BSA) as a standard. Next, homogenates (20 μg of the total protein) were reconstituted in Laemmli buffer, separated with sodium dodecyl sulfate-polyacrylamide gel electrophoresis, and transferred to polyvinylidene difluoride (PVDF) membranes. The PVDF membranes were incubated overnight with antibodies i.e., MMP2 (1:2500, cat. no. ab92536, Abcam, Cambridge, UK), MMP9 (1:10000, cat. no. ab76003, Abcam, Cambridge, UK), and β-actin (1:200, cat. no. ab115777, Abcam, Cambridge, UK). Thereafter, the PVDF membranes were incubated with secondary antibodies conjugated with anti-rabbit IgG conjugated to horseradish peroxidase (cat. no. 7074S, Cell Signaling). Protein bands were visualized using an enhanced chemiluminescence substrate (Thermo Scientific, Waltham, MA, USA) and quantified densitometrically (ChemiDoc visualization system EQ, Bio-Rad Systems). Equal protein concentrations were loaded in each lane, which was confirmed by Ponceau S staining. Protein expression (Optical Density Arbitrary Units) was normalized to β-actin expression. Finally, the control was set to 100, and the experimental groups were expressed relative to the control.
Lipids Analysis
The content of plasma lipids (FFA, DAG, TAG, and PL) was measured using gas-liquid chromatography as described previously [18, 19]. The selected lipid fractions were extracted using Bligh and Dyer’s method [20]. Then, the lipids were separated by thin-layer chromatography (TLC) into specific fractions. Next, they were fractionated on Silica Gel Plates (silica plate 60, 0.25 mm; Merck).
Individual fatty acid methyl esters (FAMEs) present in each fraction were identified and quantified according to the retention times of the standards by gas-liquid chromatography (Hewlett-Packard5890 Series II gas chromatograph, HP-INNOWax capillary column; Agilent Technologies, Santa Clara, CA, USA). The total amount of FFA, DAG, TAG, and PL was estimated as the sum of individual fatty acid species in the evaluated fraction and expressed in nanomoles per mg of protein.
Statistical Analysis
The obtained results were analyzed using GraphPad Prism 8 (GraphPad Software, La Jolla, CA, USA). Briefly, in the first step, the assumptions of the statistical methods were checked. The normality of the results’ distribution was tested using the Shapiro-Wilk test. Analysis of variance (ANOVA) followed by post-hoc pairwise Student’s t-tests was carried out to determine the existence of differences between the studied groups. For all analyses, p values < 0.05 were considered to be statistically significant. The results are expressed as mean ± SD.
Results
Supplementation with antioxidants during a high-fat diet regime affects body weight and plasma metabolic parameters
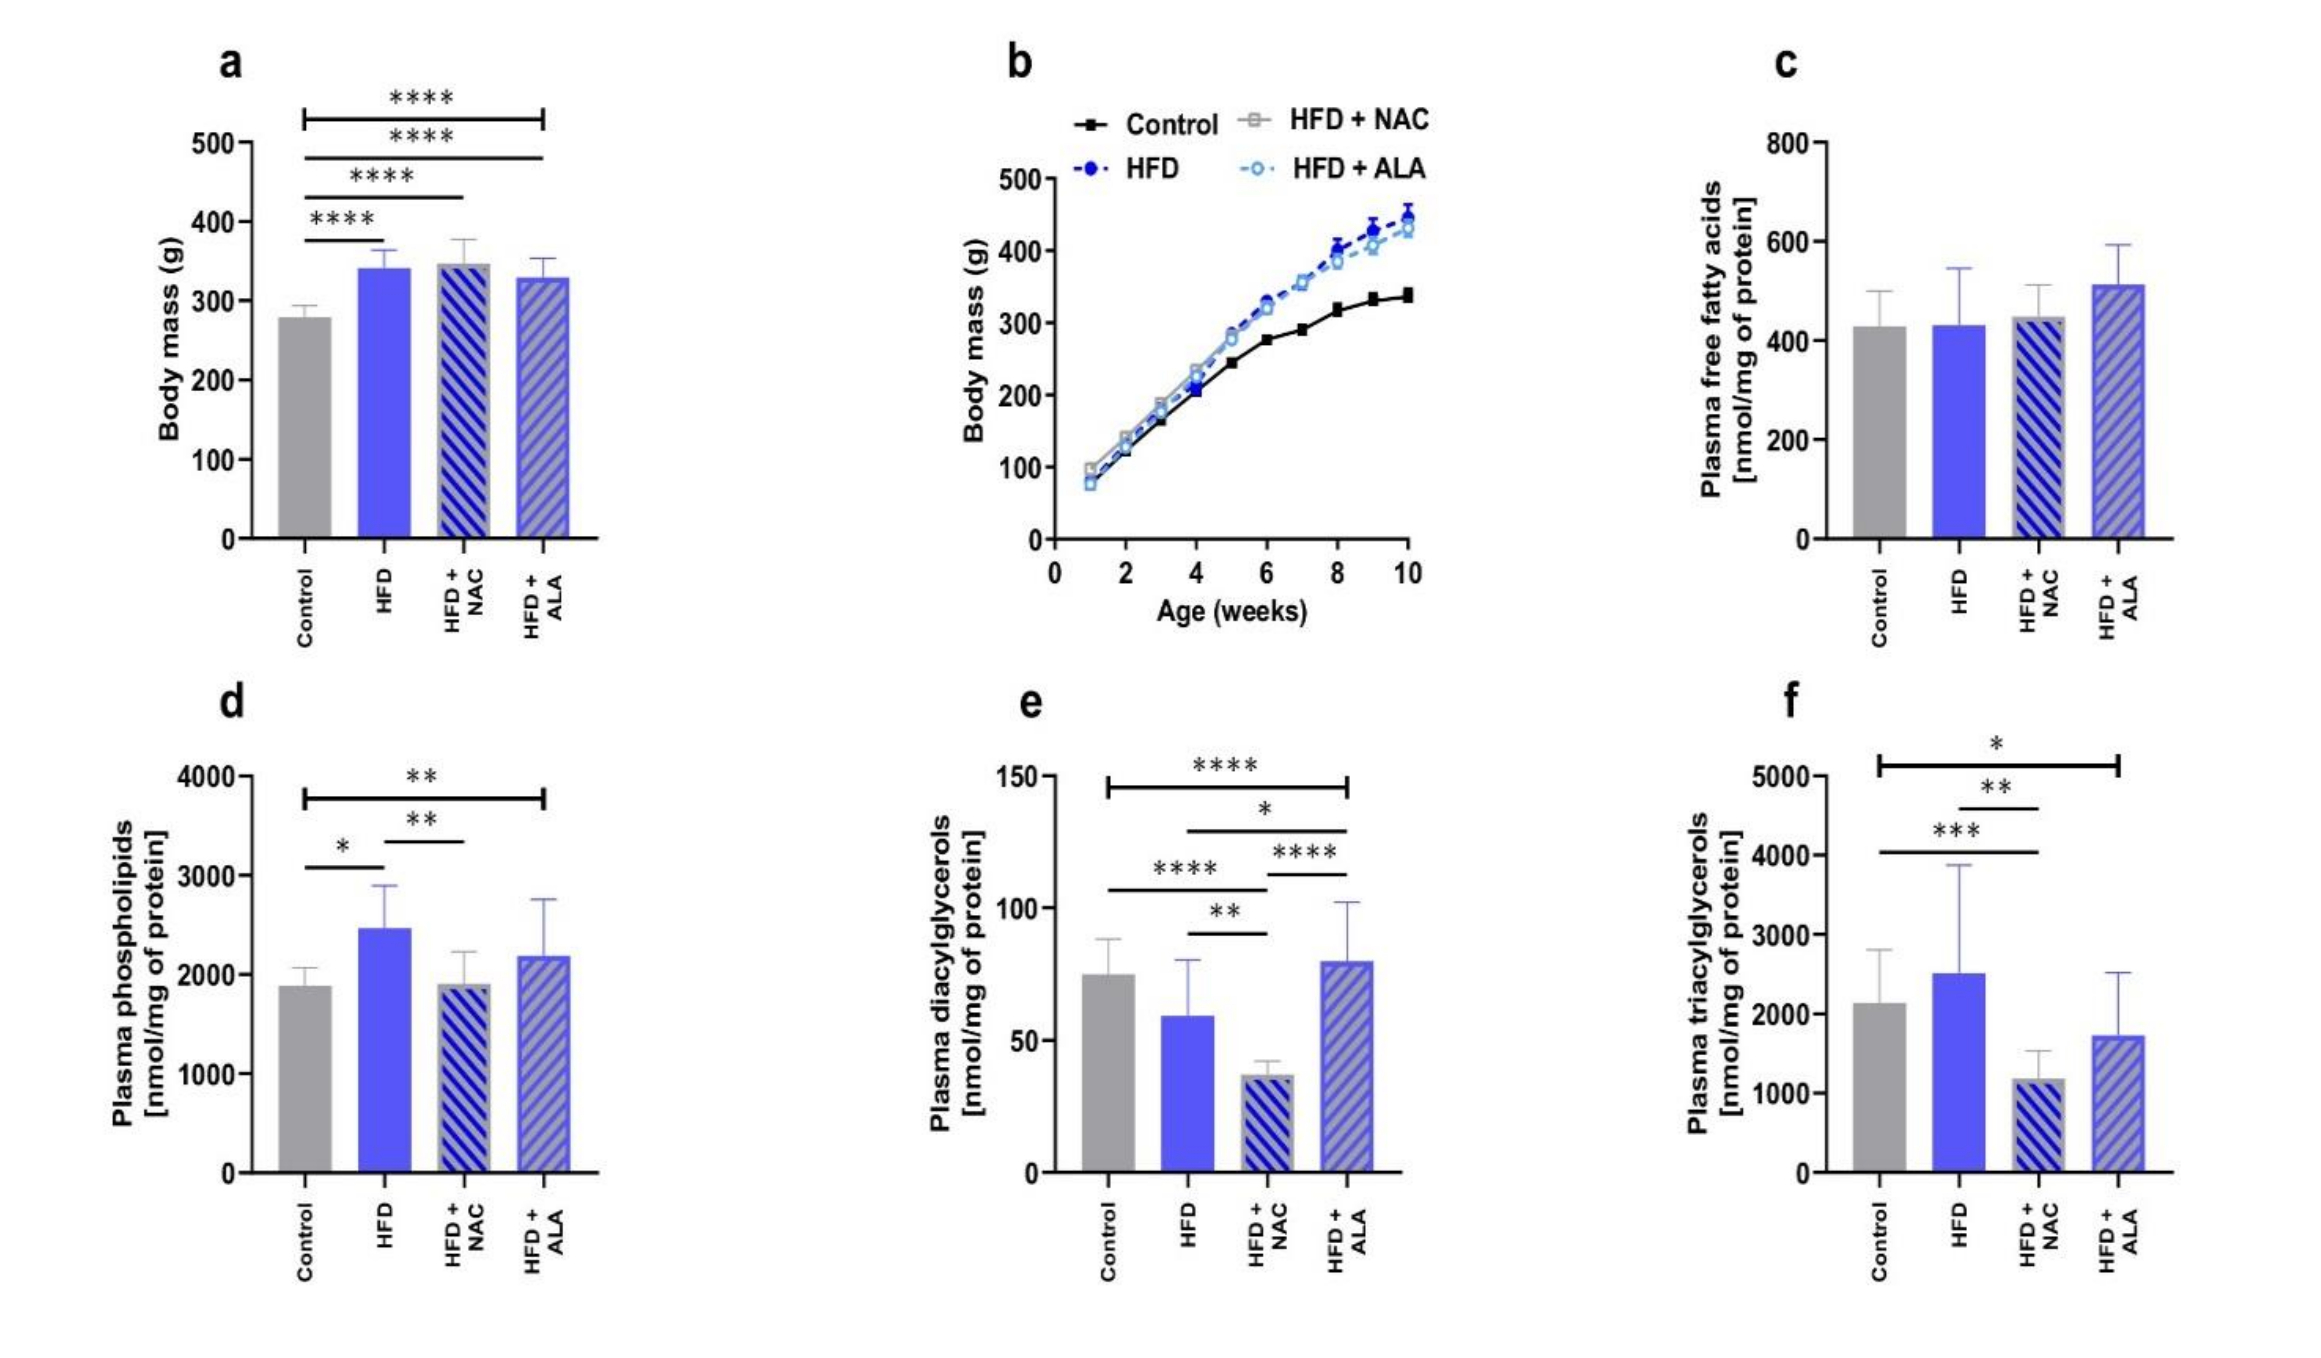
In the present study, high-fat diet feeding was associated with greater body mass and metabolic parameters. To determine the effects of the antioxidants supplementation during the HFD regime, we evaluated weekly weight gain, glucose and insulin levels, as well as HOMA-IR value, and also a plasma lipids content in male Wistar rats, under the nutritional conditions (CTRL and HFD) and in response to the antioxidants supplementation during the HFD regime (HFD+NAC and HFD+ALA). The animals’ body weight was significantly increased after HFD alone (+22%, p <0.0001, HFD vs. control group; Fig. 1a, b) as well as in the rats at HFD regime with NAC or ALA (+24%, p <0.0001; +18%, p <0.0001; HFD+NAC and HFD+ALA vs. control group; respectively; Fig. 1a, b). Our previous study established that the glucose and insulin levels, as well as HOMA-IR values, were significantly increased in HFD groups (+26%, p =0.014, HFD; +123%, p =0.0010, HFD+NAC; +8-fold, p =0.0021, HFD+ALA; vs. control group; respectively) [21]. Glucose and insulin levels, as well as HOMA-IR values were lower in HFD+NAC (-28%, p =0.0016; -51%, p =0.0042; -87%, p =0.0023; HFD+NAC vs. HFD group; respectively) and in HFD+ ALA groups (-19%, p =0.0210; -48%, p =0.0024; -88%, p =0.0022; HFD+ALA vs. HFD groups; respectively) [21]. Interestingly, we also observed significant differences in glucose level between the groups treated with the antioxidants (+12%, p =0.0172, HFD+ALA vs. HFD+NAC) [21]. As expected, the HFD caused an increase in the plasma phospholipid content (+31%, p =0.0009, vs. control group; Fig. 1d). There was a relevant decrease in the plasma diacylglycerols and triglycerides content in the NAC-treated group (-50%, p <0.0001, Fig. 1e; -45%, p =0.0009, Fig. 1f; respectively; vs. control group). Moreover, comparison between HFD and HFD+NAC revealed a pronounced decrease in the plasma phospholipids, diacylglycerols, and triglycerides content in the latter group (-23%, p =0.0040, Fig. 1d; -37%, p =0.0045, Fig. 1e; -53%, p =0.0080, Fig. 1f; respectively; vs. HFD group). On the other hand, we observed significant changes in the plasma diacylglycerols content in the NAC+ALA group (+35%, p =0.0491, vs. HFD group, Fig. 1e) as well as between the two groups with antioxidants treatment (+115%, p <0.0001, HFD+ALA vs. HFD+NAC group, Fig. 1e). Thus, the antioxidants supplementation during the HFD regime affects body weight, plasma glucose, and insulin levels, as well as HOMA-IR value, and plasma lipids content.
Histological changes in adipose tissue
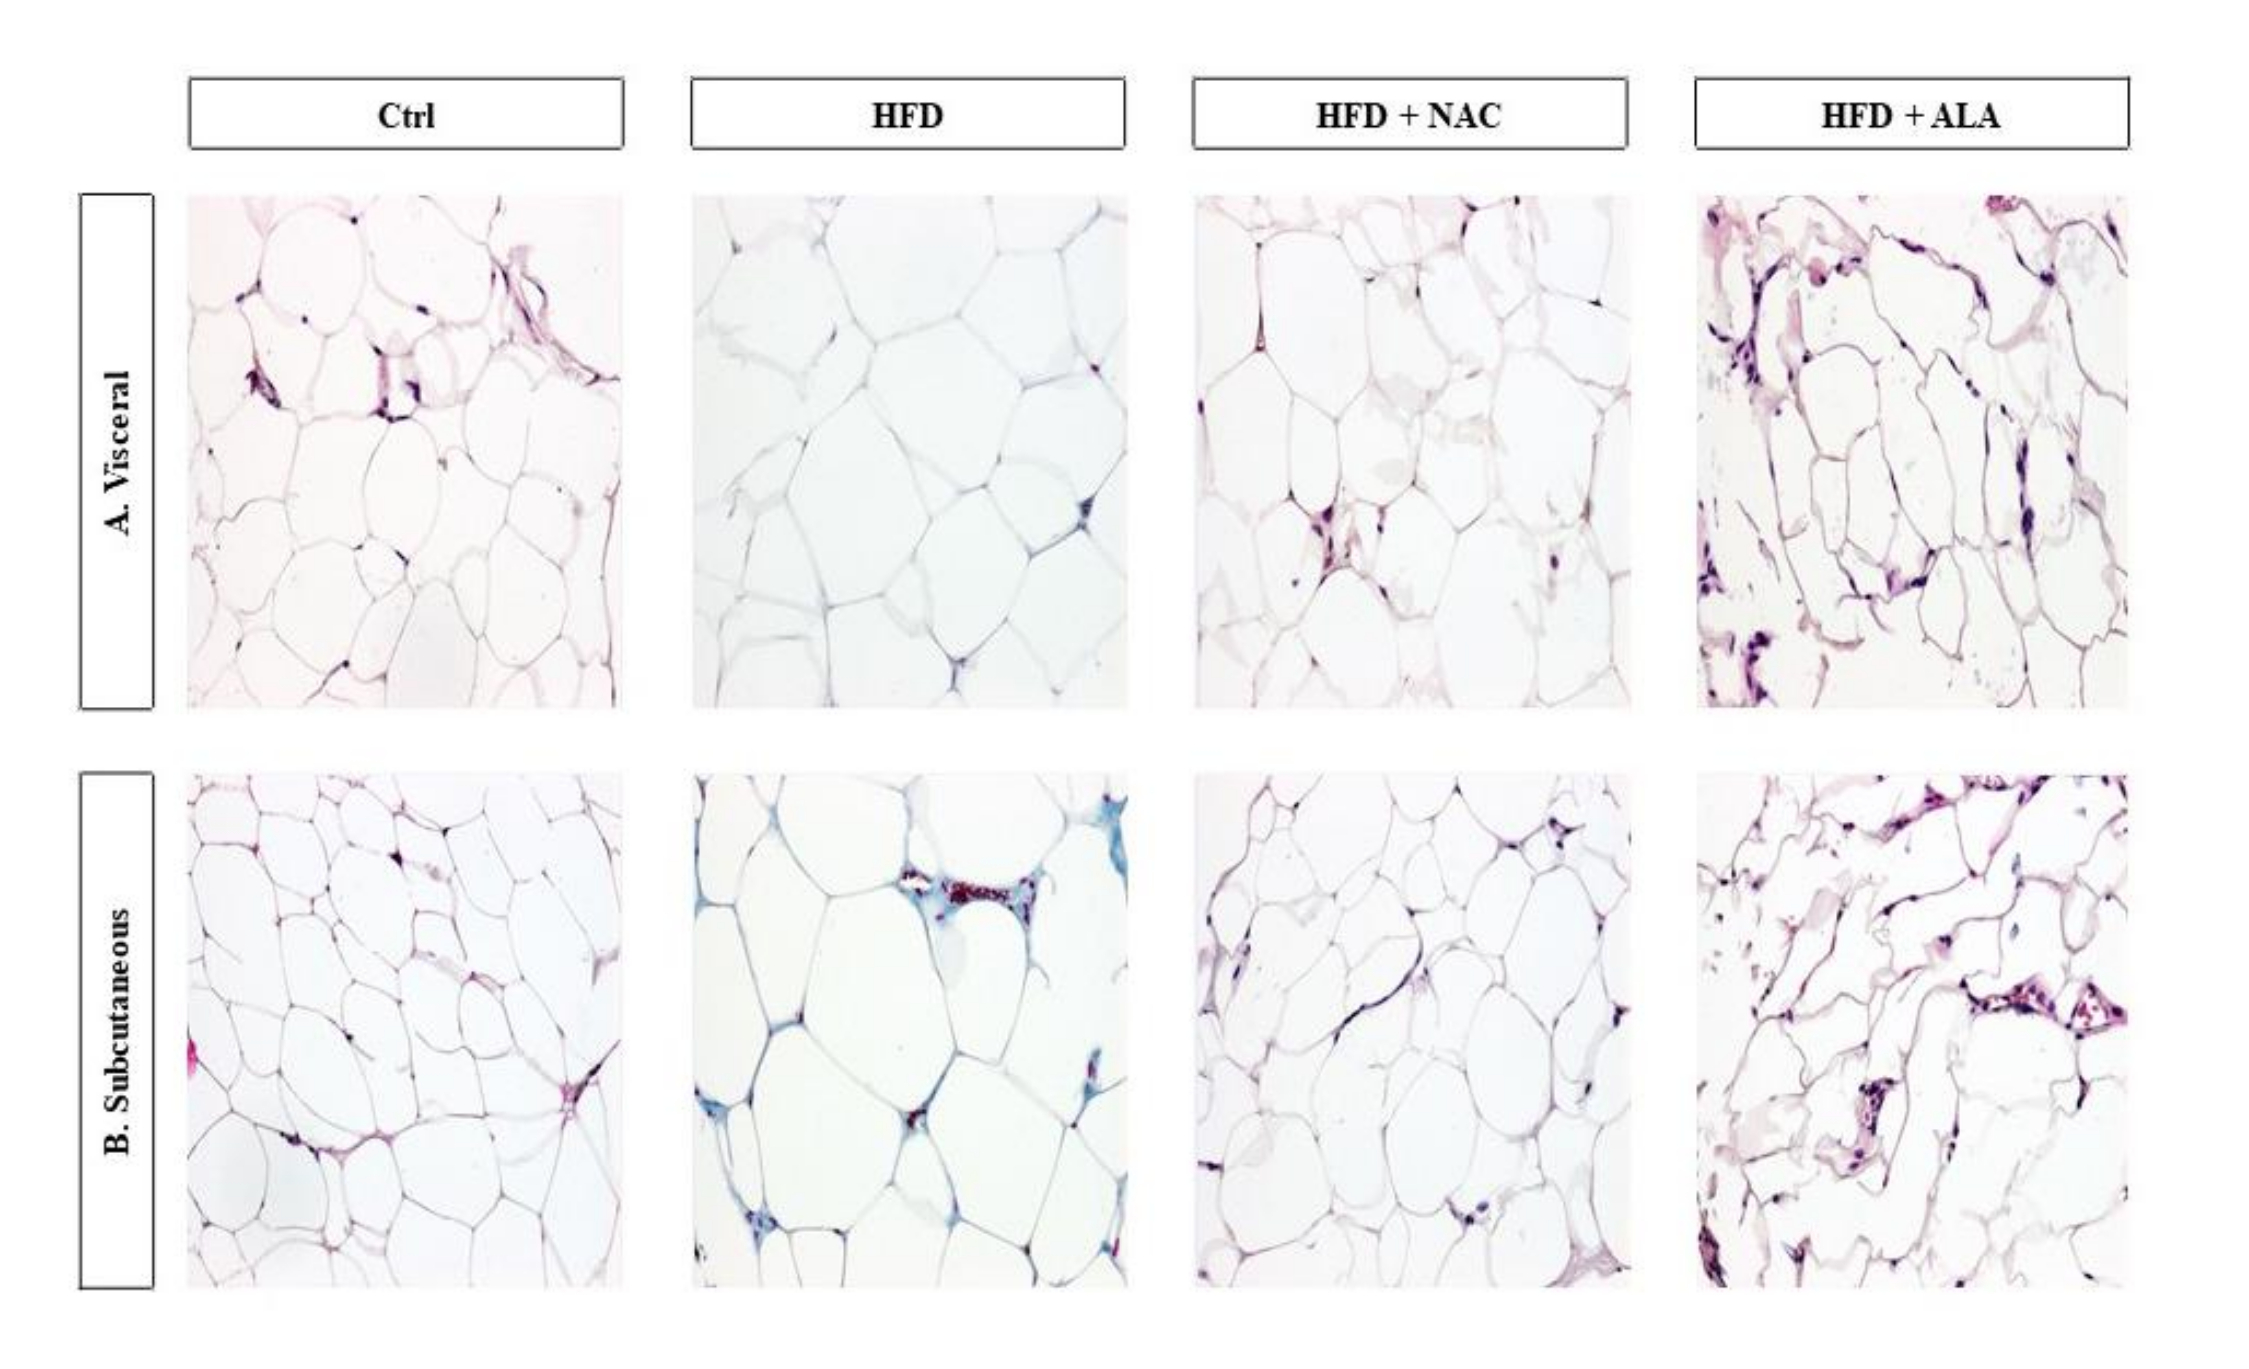
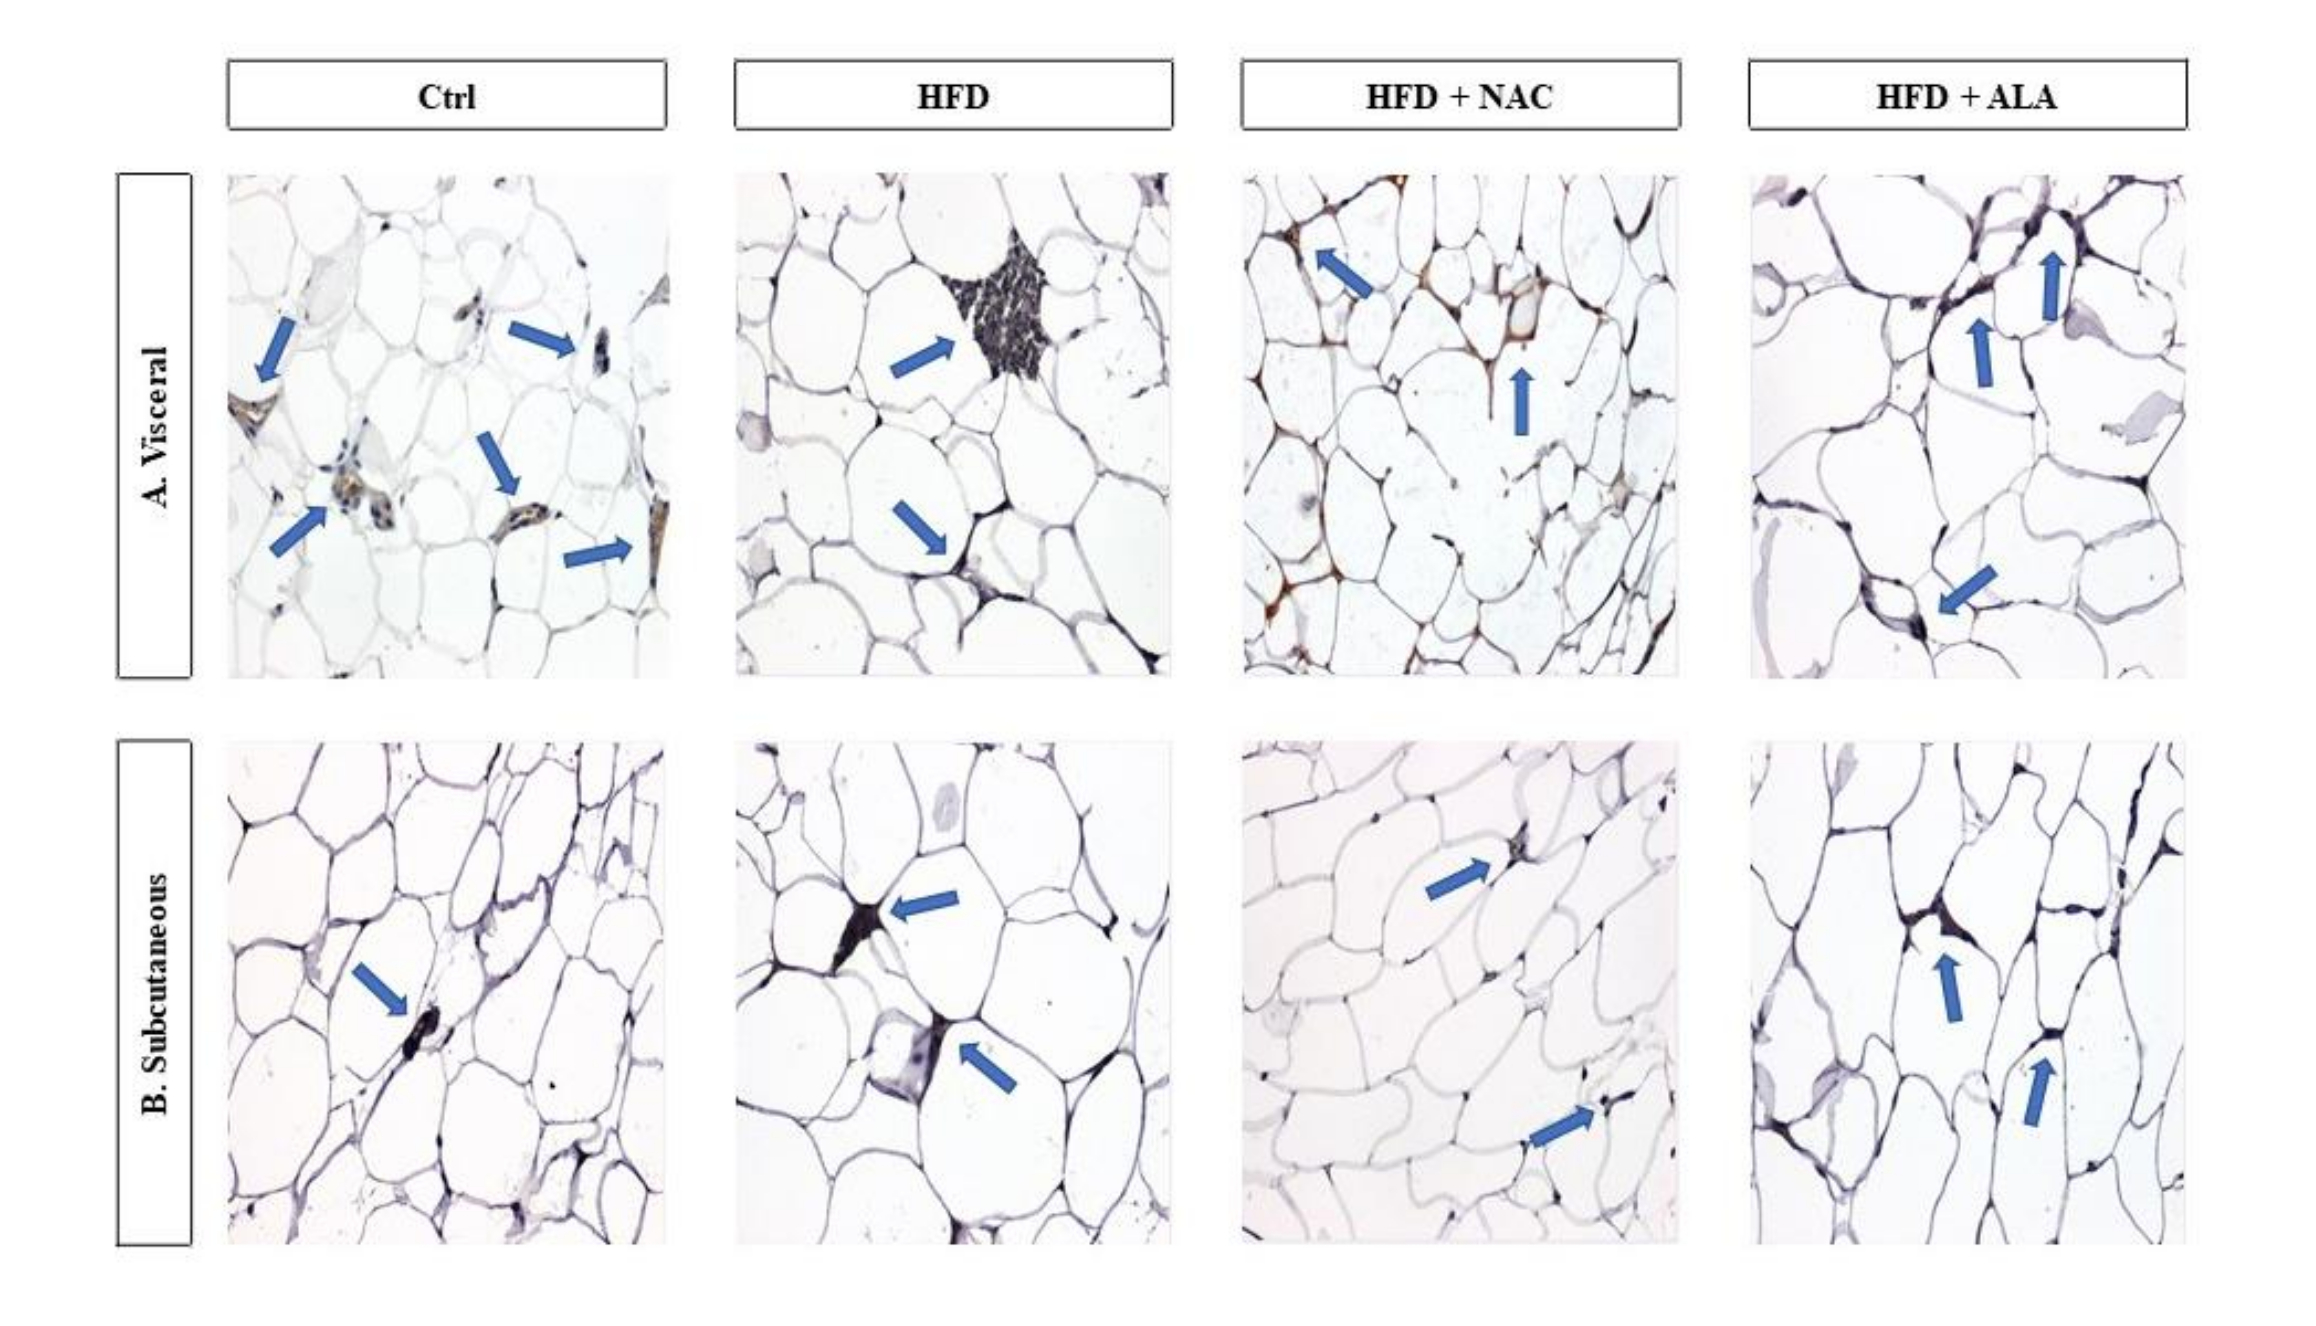
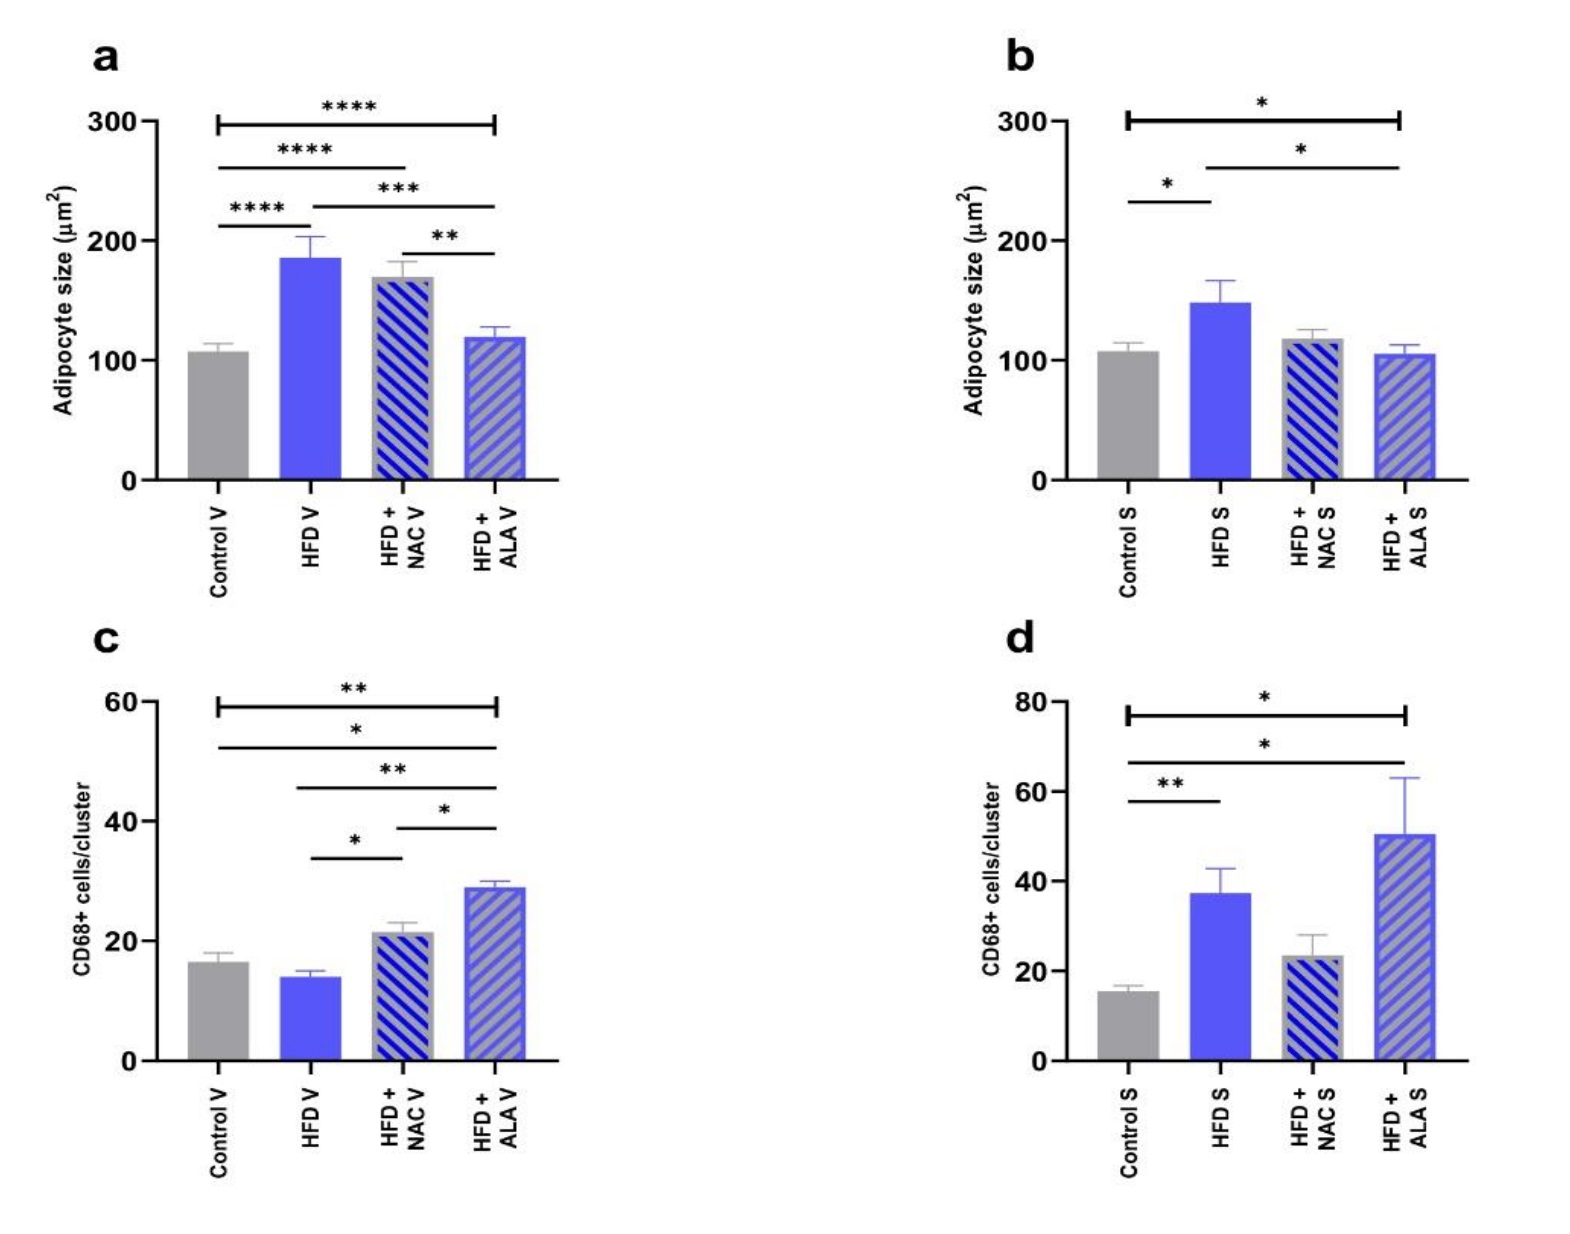
Histological examination of the adipose tissue sections in the HFD group revealed significantly larger dimensions of the fat cells, especially in SAT (Fig. 2b; p <0.0001, HFD V vs. Control V, Fig. 4a; p =0.0165, HFD S vs. Control S, Fig. 4b), when compared to the control. Immunohistochemical analyses in this group showed also an increase in the number of CD68 immunopositive cells (HFD S vs Ctrl S, Fig. 3; p =0.0061, 4d). However, the greatest number of infiltrating macrophages was found in VAT, where they formed large clusters (Fig. 3a). The adipocytes in the VAT and SAT of the HFD+NAC group were slightly smaller than the fat cells of the HFD group, and their cell membrane had a thin rim of folded cytoplasm (Fig. 2, 4a, and b). There was a lower number of macrophages observed in HFD+NAC when compared to HFD (Fig. 3), with more CD68 immunopositive cells compared to VAT (Fig. 3a; p =0.0358, 4c). The shape of the fat cells in the HFD+ALA group was similar to that found in the control group, while the size of the adipocytes was slightly smaller than in the HFD (Fig. 2; p =0.0003, HFD+ALA V vs. HFD V, Fig. 4a; p =0.0209, HFD+ALA S vs. HFD S, Fig. 4b). The number of CD68 immunopositive cells was higher in both VAT and SAT of HFD+ALA compared to HFD (Fig. 3; p =0.0088, HFD+ALA V vs. HFD V, Fig. 4c; Fig. 4d). In the HFD+ALA group, a slightly higher number of macrophages was found in the adipose tissue sections, from both the locations (Fig. 2) compared to the respective control groups (Fig. 2). The number of CD68 immunopositive cells in the HFD+ALA group was higher in both types of adipose tissue compared to HFD+NAC (Fig. 3; p =0.0358, HFD+ALA V vs. HFD+NAC V, Fig. 4c; Fig. 4d). On the other hand, in HFD+ALA the size of the adipocytes, in VAT and SAT, was slightly smaller compared to HFD+NAC (Fig. 2; p =0.0010, HFD+ALA V vs. HFD+NAC V, Fig. 4a; Fig. 4b).
The effects of NAC and ALA on the mRNA levels of MMP2 and MMP9 in the adipose tissues of HFD-fed rats
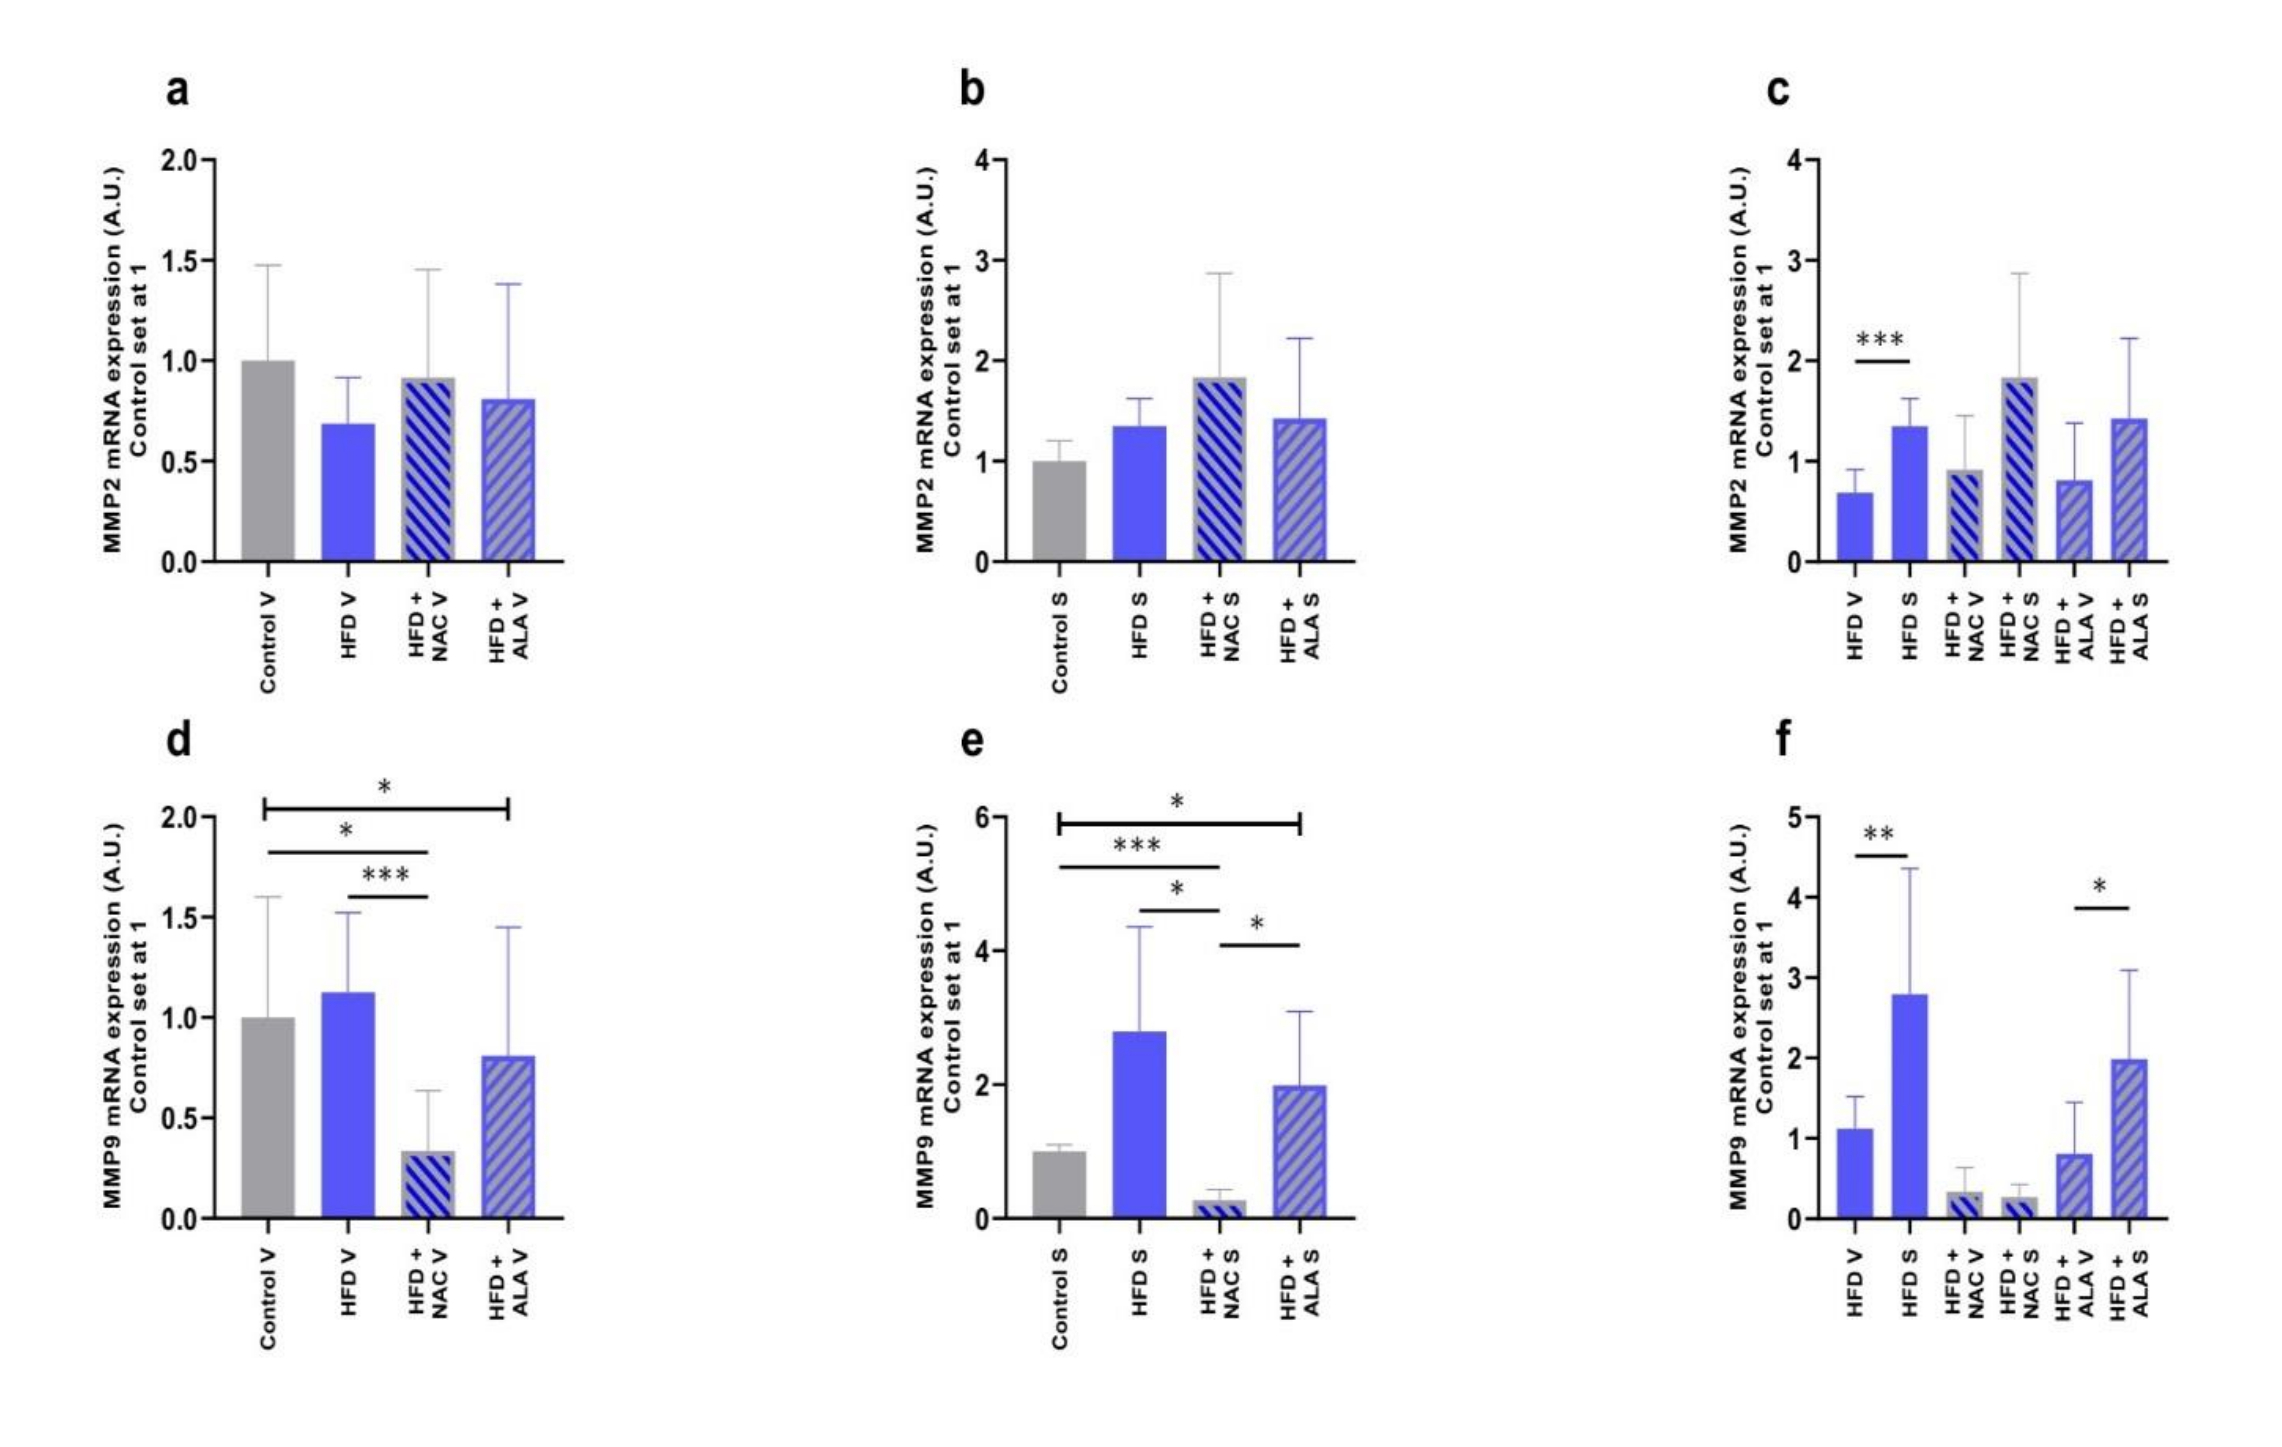
We determined MMP2 and MMP9 mRNA expression levels in VAT and SAT of the rats fed with HFD with/without antioxidants supplementation. The NAC treatment resulted in the decreased MMP9 mRNA expression in VAT and SAT (-66%, p =0.0254, Fig. 5d; -73%, p =0.0009, Fig. 5e; vs. control group; respectively). Interestingly, four-week-long administration of NAC alongside the HFD regime resulted in a significant decrease in the MMP9 mRNA expression in VAT and SAT when compared to HFD alone (-70%, p =0.0009, Fig. 5d; -92%, p =0.0150, Fig. 5e; vs. HFD group; respectively). A comparison between HFD+NAC and HFD+ALA showed a significantly higher MMP9 mRNA expression level in the SAT of the latter group (+6-fold, p =0.0162, Fig. 5e). Overall, we found greater MMP2 and MMP9 mRNA expressions in SAT compared to VAT (+97%, p <0.0001, Fig. 5c; +2-fold, p =0.0089, Fig. 5f; HFD S vs. HFD V; respectively). There was also a significant difference between the tissues in HFD+ALA with respect to MMP9 mRNA expression (+1.5-fold, p =0.0349, HFD+ALA S vs. HFD+ALA V, Fig. 5f).
The effects of NAC and ALA on protein levels of MMP2 and MMP9 in the adipose tissue of HFD-fed rats
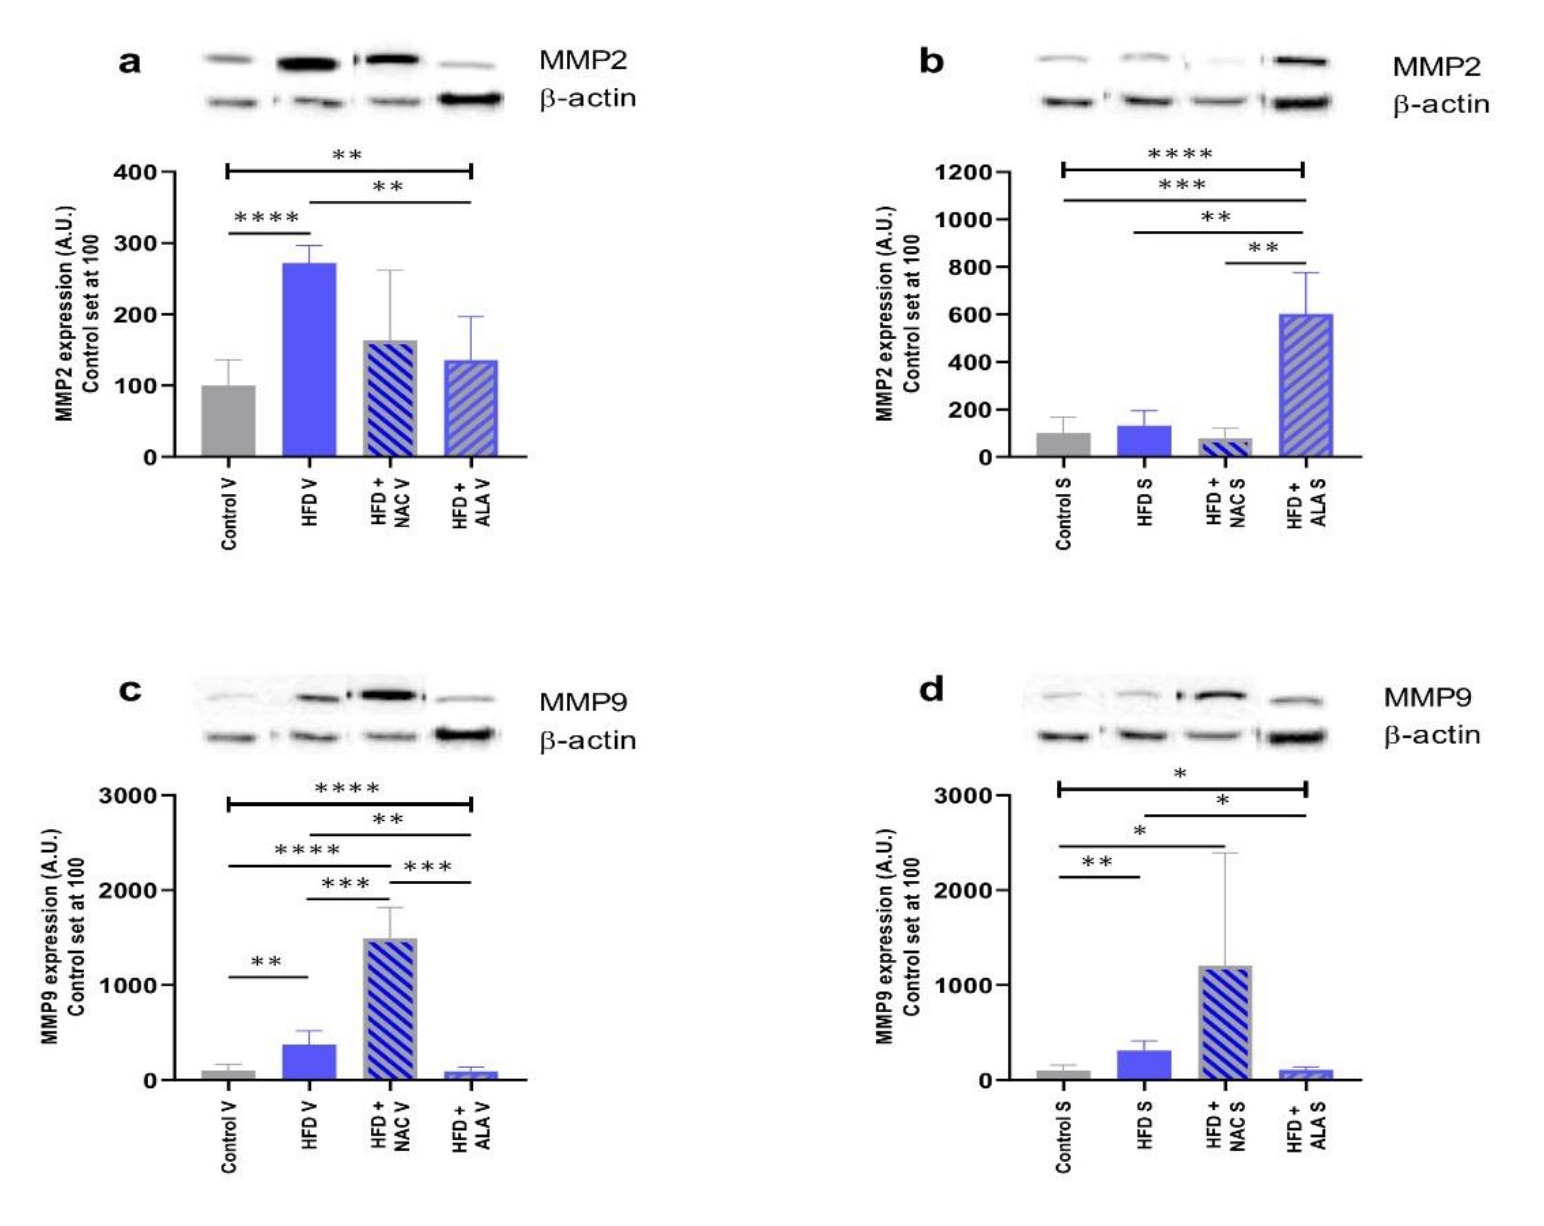
We measured the total expression of MMP2 and MMP9 proteins in VAT and SAT in the obese rats after an HFD with/without antioxidants supplementation. In comparison to the control, the administration of the HFD resulted in an increased protein expression of MMP2 in VAT, and MMP9 in VAT and SAT (+2-fold, p <0.0001, Fig. 6a; +3-fold, p =0.0018, Fig. 6c; +2-fold, p =0.0052, Fig. 6d; vs. control group; respectively). Four-week-long administration of NAC alongside the HFD regime resulted in significant increases in the expression of MMP9 proteins in VAT and SAT when contrasted with the control (+14-fold, p <0.0001, Fig. 6c; +11-fold, p =0.0469, Fig. 6d; vs. control group; respectively). On the other hand, only MMP2 protein expression was greater in SAT when juxtaposing HFD+ALA with the control (+5-fold, p =0.0002, HFD+ALA vs. control, Fig. 6b). The administration of NAC alongside the HFD regime also resulted in a significant increase in the expression of MMP9 proteins in VAT when compared to HFD alone (+3-fold, p =0.0004, vs. HFD, Fig. 6c). Interestingly, the addition of ALA during the HFD regime led to significant changes in MMP2 (VAT: -50%, p =0.0059, Fig. 6a; SAT: +4-fold, p =0.0071, Fig. 6b; vs. HFD; respectively) and MMP9 (VAT: -76%, p =0.0061, Fig. 6c; SAT: -66%, p =0.0126, Fig. 6d; vs. HFD; respectively) protein expression. The juxtaposition of the NAC treatment with the ALA application showed a higher protein expression of MMP2 in SAT and a lower protein expression of MMP9 in VAT, of the latter group (+7-fold, p= 0.011, Fig. 6b; -94%, p= 0.0003, Fig. 6c; HFD+NAC vs. HFD+ALA; respectively).
Unfortunately, so far, no study results have been published, where scientists check the direct activity of MMP2 and MMP9, in the treatment’s context of ALA or NAC, in an obesity model. However, Uemura et al. proved, by using the gelatin zymography and Western blot, that the activity and expression of MMP9, but not MMP2 were significantly increased in vascular tissue and plasma of two distinct rodent models of diabetes mellitus. Enhanced MMP-9 activity was significantly reduced by treatment with the NAC [39]. In other research, Liu et al. investigated the role of MMP2 in pancreatic β-cell injury induced by oxidative stress. Intracellular MMP2 expression and activity were determined by real-time PCR, Western blotting, and zymography. They proved that NAC treatment inhibited MMP2 expression and activity, and partially reversed cell apoptosis and insulin secretion [40]. Bogani et al. sought to determine whether the antioxidants as NAC or ALA affect gelatinase production and secretion. The results show that thiol compounds affect MMPs’ expression and activity in different ways. MMP2 activity is directly inhibited by NAC, while ALA is ineffective. On the other hand, MMP9 expression is inhibited by ALA at a pretrascriptional level [41].
Conclusion
In the current study, we presented presumably the first report about the effects of NAC and ALA supplementation on the MMP2 and MMP9 levels in visceral and subcutaneous adipose tissue of the rats with high-fat diet-induced obesity. Moreover, we believe our study to be the first one that compares the influence of the two antioxidants on the matrix metalloproteinases expression in white adipose tissue. Our data illustrate a potential role for NAC and ALA supplementation in the modulation of matrix metalloproteinases expression in visceral and subcutaneous adipose tissue of the animals fed with an HFD. The antioxidants treatment can help to protect adipose tissue against oxidative stress by regulating MMP2 and MMP9 expression.
Author Contributions
Conceptualization, M.W., A.C.; data curation, M.W., B.L., I.K., A.C.; formal analysis, M.W., A.C.; funding acquisition, M.W.; investigation, M.W., I.K.; methodology, M.W., A.C.; material collection, M.W.; supervision, A.C., B.L.; validation, M.W., B.L., A.C.; visualization, M.W.; writing—original draft, M.W.; writing—review and editing, A.C., B.L..
All authors have read and agreed to the published version of the manuscript.
Funding
This research was funded by the Medical University of Bialystok, grant no. SUB/1/DN/21/008/1118.
The authors declare that no conflicts of interest exist.
| 1 WHO: Obesity (9 June 2021) [Internet]. URL: https://www.who.int/news-room/facts-in-pictures/detail/6-facts-on-obesity. | ||||
| 2 Nuszkiewicz J, Kwiatkowska A, Majko K, Wesołowski R, Szewczyk-Golec K: Stres oksydacyjny i stan zapalny a rozwój otyłości: protekcyjne działanie melatoniny Oxidative stress, inflammation and development of obesity: protective effect of melatonin. Probl Hig Epidemiol 2017;98:226-232. | ||||
| 3 Kubasik M, Bogdański P, Suliburska J: Składniki mineralne w patogenezie otyłości i jej powikłaniach. Forum Zaburzeń Metabolicznych 2018;9:141-151. | ||||
| 4 Berg G, Barchuk M, Miksztowicz V: Behavior of Metalloproteinases in Adipose Tissue, Liver and Arterial Wall: An Update of Extracellular Matrix Remodeling. Cells 2019;8:158. https://doi.org/10.3390/cells8020158 |
||||
| 5 Boumiza S, Chahed K, Tabka Z, Jacob M-P, Norel X, Ozen G: MMPs and TIMPs levels are correlated with anthropometric parameters, blood pressure, and endothelial function in obesity. Sci Rep 2021;11:20052. https://doi.org/10.1038/s41598-021-99577-2 |
||||
| 6 Naduk-Kik J, Hrabec E: Udział metaloproteinaz macierzy w patogenezie cukrzycy i rozwoju retinopatii cukrzycowej. Postepy Higieny i Medycyny Doswiadczalnej 2008;62:442-450. | ||||
| 7 Pawłowska J, Witkowski JM: Zespół metaboliczny - aktualny stan wiedzy o przyczynach i patomechanizmach. Forum Medycyny Rodzinnej 2009;3:278-291. | ||||
| 8 Keshk WA, Ibrahim MA, Shalaby SM, Zalat ZA, Elseady WS: Redox status, inflammation, necroptosis and inflammasome as indispensable contributors to high fat diet (HFD)-induced neurodegeneration; Effect of N-acetylcysteine (NAC). Arch Biochem Biophys 2020;680:108227. https://doi.org/10.1016/j.abb.2019.108227 |
||||
| 9 Prieto-Hontoria PL, Pérez-Matute P, Fernández-Galilea M, Martínez JA, Moreno-Aliaga MJ: Effects of lipoic acid on AMPK and adiponectin in adipose tissue of low- and high-fat-fed rats. Eur J Nutr 2013;52:779-787. https://doi.org/10.1007/s00394-012-0384-7 |
||||
| 10 Šalamon Š, Kramar B, Marolt TP, Poljšak B, Milisav I: Medical and Dietary Uses of N-Acetylcysteine. Antioxidants (Basel) 2019;8:111. https://doi.org/10.3390/antiox8050111 |
||||
| 11 Jaccob A: Protective effect of N-Acetylcysteine against ethanol-induced gastric ulcer: a pharmacological assessment in mice. J Intercult Ethnopharmacol 2015;4:90-95. https://doi.org/10.5455/jice.20150212103327 |
||||
| 12 Mousavi SM, Shab-Bidar S, Kord-Varkaneh H, Khorshidi M, Djafarian K: Effect of alpha-lipoic acid supplementation on lipid profile: A systematic review and meta-analysis of controlled clinical trials. Nutrition 2019;59:121-130. https://doi.org/10.1016/j.nut.2018.08.004 |
||||
| 13 Cremer DR, Rabeler R, Roberts A, Lynch B: Long-term safety of alpha-lipoic acid (ALA) consumption: A 2-year study. Regul Toxicol Pharmacol 2006;46:193-201. https://doi.org/10.1016/j.yrtph.2006.06.003 |
||||
| 14 ImageJ: Analyze Menu [Internet]. URL: https://imagej.nih.gov/ij/docs/menus/analyze.html. | ||||
| 15 Laforest S, Pelletier M, Michaud A, Daris M, Descamps J, Soulet D, Jensen M, Tchernof A: Histomorphometric analyses of human adipose tissues using intact, flash-frozen samples. Histochem Cell Biol 2018;149:209-218. https://doi.org/10.1007/s00418-018-1635-3 |
||||
| 16 Knapp M, Górski J, Lewkowicz J, Lisowska A, Gil M, Wójcik B, Hirnle T, Chabowski A, Mikłosz A: The Gene and Protein Expression of the Main Components of the Lipolytic System in Human Myocardium and Heart Perivascular Adipose Tissue. Effect of Coronary Atherosclerosis. Int J Mol Sci 2020;21:737. https://doi.org/10.3390/ijms21030737 |
||||
| 17 Pfaffl MW: A new mathematical model for relative quantification in real-time RT-PCR. Nucleic Acids Res 2001;29:E45. https://doi.org/10.1093/nar/29.9.e45 |
||||
| 18 Lukaszuk B, Miklosz A, Zendzian-Piotrowska M, Wojcik B, Gorski J, Chabowski A: Changes in the Diaphragm Lipid Content after Administration of Streptozotocin and High-Fat Diet Regime. J Diabetes Res 2017;2017:3437169. https://doi.org/10.1155/2017/3437169 |
||||
| 19 Chabowski A, Żendzian-Piotrowska M, Konstantynowicz K, Pankiewicz W, Mikłosz A, Łukaszuk B, Górski J: Fatty acid transporters involved in the palmitate and oleate induced insulin resistance in primary rat hepatocytes. Acta Physiol (Oxf) 2013;207:346-357. https://doi.org/10.1111/apha.12022 |
||||
| 20 Bligh EG, Dyer WJ: A rapid method of total lipid extraction and purification. Can J Biochem Physiol 1959;37:911-917. https://doi.org/10.1139/o59-099 |
||||
| 21 Hodun K, Sztolsztener K, Chabowski A: Antioxidants Supplementation Reduces Ceramide Synthesis Improving the Cardiac Insulin Transduction Pathway in a Rodent Model of Obesity. Nutrients 2021;13:3413. https://doi.org/10.3390/nu13103413 |
||||
| 22 Wolosowicz M, Prokopiuk S, Kaminski TW: Recent Advances in the Treatment of Insulin Resistance Targeting Molecular and Metabolic Pathways: Fighting a Losing Battle? Medicina 2022;58:472. https://doi.org/10.3390/medicina58040472 |
||||
| 23 Prieto-Hontoria PL, Pérez-Matute P, Fernández-Galilea M, Barber A, Martínez JA, Moreno-Aliaga MJ: Lipoic acid prevents body weight gain induced by a high fat diet in rats: effects on intestinal sugar transport. J Physiol Biochem 2009;65:43-50. https://doi.org/10.1007/BF03165968 |
||||
| 24 Żukowski P, Maciejczyk M, Matczuk J, Kurek K, Waszkiel D, Żendzian-Piotrowska M, Zalewska A: Effect of N-Acetylcysteine on Antioxidant Defense, Oxidative Modification, and Salivary Gland Function in a Rat Model of Insulin Resistance. Oxid Med Cell Longev 2018;2018:6581970. https://doi.org/10.1155/2018/6581970 |
||||
| 25 Gollisch KS, Brandauer J, Jessen N, Toyoda T, Nayer A, Hirshman MF, Goodyear LJ: Effects of exercise training on subcutaneous and visceral adipose tissue in normal- and high-fat diet-fed rats. Am J Physiol Endocrinol Metab 2009;297:E495-E504. https://doi.org/10.1152/ajpendo.90424.2008 |
||||
| 26 le Lay S, Simard G, Martinez MC, Andriantsitohaina R: Oxidative stress and metabolic pathologies: from an adipocentric point of view. Oxid Med Cell Longev 2014;2014:908539. https://doi.org/10.1155/2014/908539 |
||||
| 27 Taherkhani S, Suzuki K, Ruhee RT: A Brief Overview of Oxidative Stress in Adipose Tissue with a Therapeutic Approach to Taking Antioxidant Supplements. Antioxidants (Basel) 2021;10:594. https://doi.org/10.3390/antiox10040594 |
||||
| 28 Lefranc C, Friederich-Persson M, Palacios-Ramirez R, Nguyen Dinh Cat A: Mitochondrial oxidative stress in obesity: role of the mineralocorticoid receptor. J Endocrinol 2018;238:R143-R159. https://doi.org/10.1530/JOE-18-0163 |
||||
| 29 Sun K, Kusminski CM, Scherer PE: Adipose tissue remodeling and obesity. J Clin Invest 2011;121:2094-2101. https://doi.org/10.1172/JCI45887 |
||||
| 30 Moreira MEC, de Oliveira Araújo F, de Sousa AR, Toledo RCL, dos Anjos Benjamin L, Veloso MP, de Souza Reis K, Dos Santos MH, Martino HSD: Bacupari peel extracts (Garcinia brasiliensis) reduces the biometry, lipogenesis and hepatic steatosis in obese rats. Food Res Int 2018;114:169-177. https://doi.org/10.1016/j.foodres.2018.08.004 |
||||
| 31 Manna P, Jain S: Obesity, Oxidative Stress, Adipose Tissue Dysfunction, and the Associated Health Risks: Causes and Therapeutic Strategies. Metab Syndr Relat Disord 2015;13:423-444. https://doi.org/10.1089/met.2015.0095 |
||||
| 32 Furukawa S, Fujita T, Shimabukuro M, Iwaki M, Yamada Y, Nakajima Y, Nakayama O, Makishima M, Matsuda M, Shimomura I: Increased oxidative stress in obesity and its impact on metabolic syndrome. J Clin Invest 2004;114:1752-1761. https://doi.org/10.1172/JCI21625 |
||||
| 33 Higuchi M, Dusting GJ, Peshavariya H, Jiang F, Hsiao STF, Chan EC, Liu G: Differentiation of human adipose-derived stem cells into fat involves reactive oxygen species and Forkhead box O1 mediated upregulation of antioxidant enzymes. Stem Cells Dev 2013;22:878-888. https://doi.org/10.1089/scd.2012.0306 |
||||
| 34 Akhigbe R, Ajayi A: The impact of reactive oxygen species in the development of cardiometabolic disorders: a review. Lipids in Health and Disease 2021;20:23. https://doi.org/10.1186/s12944-021-01435-7 |
||||
| 35 da Silva KS, Pinto PR, Fabre NT, Gomes DJ, Thieme K, Okuda LS, Iborra RT, Freitas VG, Shimizu MHM, Teodoro WR, Marie SKN, Woods T, Brimble MA, Pickford R, Rye KA, Okamoto M, Catanozi S, Correa-Giannela ML, Machado UF, Passarelli M: N-acetylcysteine Counteracts Adipose Tissue Macrophage Infiltration and Insulin Resistance Elicited by Advanced Glycated Albumin in Healthy Rats. Front Physiol 2017;8:723. https://doi.org/10.3389/fphys.2017.00723 |
||||
| 36 Ma Y, Gao M, Liu D: N-acetylcysteine Protects Mice from High Fat Diet-induced Metabolic Disorders. Pharm Res 2016;33:2033-2042. https://doi.org/10.1007/s11095-016-1941-1 |
||||
| 37 Kim MS, Park JY, Namkoong C, Jang PG, Ryu JW, Song HS, Yun JY, Namgoong IS, Ha J, Park IS, Lee IK, Viollet B, Youn JH, Lee HK, Lee KU: Anti-obesity effects of alpha-lipoic acid mediated by suppression of hypothalamic AMP-activated protein kinase. Nat Med 2004;10:727-733. https://doi.org/10.1038/nm1061 |
||||
| 38 Tomita Y, Iwai S, Kumai T, Ohnuma S, Kurahashi C, Tsuboi A, Ohba K, Ono T, Oka Y, Koike J, Kobayashi S, Oguchi K: Visceral Fat Accumulation is Associated with Oxidative Stress and Increased Matrix Metalloproteinase-9 Expression in Atherogenic Factor-overlapped Model Rats. Showa Univ J Med Sci 2010;22:27-40. https://doi.org/10.15369/sujms.22.27 |
||||
| 39 Uemura S, Matsushita H, Li W, Glassford AJ, Asagami T, Lee KH, Harrison DG, Tsao PS: Diabetes mellitus enhances vascular matrix metalloproteinase activity: role of oxidative stress. Circ Res 2001;88:1291-1298. https://doi.org/10.1161/hh1201.092042 |
||||
| 40 Liu C, Wan X, Ye T, Fang F, Chen X, Chen Y, Dong Y: Matrix metalloproteinase 2 contributes to pancreatic Beta cell injury induced by oxidative stress. Plos One 2014;9:e110227. https://doi.org/10.1371/journal.pone.0110227 |
||||
| 41 Bogani P, Canavesi M, Hagen TM, Visioli F, Bellosta S: Thiol supplementation inhibits metalloproteinase activity independent of glutathione status. Biochem Biophys Res Commun 2007;363:651-655. https://doi.org/10.1016/j.bbrc.2007.09.018 |
||||