×
![]()
Corresponding Author: Christian Stock
Department of Gastroenterology, Hepatology & Endocrinology, Hannover Medical School, Carl-Neuberg-Str. 1, 30625 Hannover (Germany)
Tel. +49-511-5322981, E-Mail Stock.Christian@mh-hannover.de
The ACE Inhibitor Lisinopril Stimulates Melanoma Cell Invasiveness by Inducing MMP2 Secretion
Yannic Becker Christian Stock
Department of Gastroenterology, Hepatology & Endocrinology, Hannover Medical School, Hannover, Germany
Introduction
Cutaneous melanoma is the deadliest of all skin cancers [1]. Novel therapeutics for unresectable melanoma, including the use of immune checkpoint and kinase inhibitors, have improved the prognosis of advanced melanoma over the last decade [2, 3]. Yet, malignancies, particularly cutaneous melanoma, remain cruel because of their highly aggressive metastatic behavior and a bad prognosis once the tumor has spread and formed secondary lesions. Major characteristics of the metastatic cascade are cell motility and invasiveness, which enable the cancer cells to move away from the primary tumor by local invasion and intravasation, and to develop metastases at distant sites by invading target tissues after extravasation [4-6]. Cancer cells metastasize preferentially to predestinated target organs [7]. Melanoma tends to colonize lungs (71%) and liver (58%), but also brain (55%), bone (49%) and peritoneum (43%) [8]. The organotropism of uveal melanoma is even more pronounced. 90% of patients suffering from metastatic uveal melanoma show metastatic lesions in the liver [9].
Occurring even more frequently than cancer, cardiovascular disease is the leading cause of death worldwide [10]. 85% of these deaths result from heart attacks and strokes and are therefore attributable to hypertension. The risk of suffering a heart attack or a stroke can be reduced significantly by lowering blood pressure with antihypertensive drugs to values below 140 and 90 mm Hg (systolic and diastolic, respectively), regardless of whether the high blood pressure is age-related or representing an established essential hypertension [11, 12]. Systemic blood pressure is controlled by the renin-angiotensin-aldosterone system (RAAS). Accordingly, the vast majority of antihypertensives target one of the RAAS’ regulatory variables [13, 14]. Key player of RAAS is the liver-derived β2-globuline angiotensinogen that is processed in two steps to become the operational angiotensin II (ATII). First, the protease renin, released by the juxtaglomerular apparatus of the kidney, catalyzes the conversion of angiotensinogen into the decapeptide angiotensin I. Second, the angiotensin converting enzyme (ACE), a single-pass transmembrane protein expressed ubiquitously by endothelial cells with pronounced expression in the pulmonary and renal vasculature, cleaves angio-tensin I (ATI) to form the octapeptide ATII [15]. ATII operates via two G protein-coupled receptors, the angiotensin II receptor type 1 (AT1R) and the angiotensin II receptor type 2 (AT2R).
ATII-stimulated AT1R triggers an increase in blood pressure by (i) mediating the constriction of vascular smooth muscle cells, (ii) activating the sympathetic nervous system, and (iii) inducing the release of aldosterone and vasopressin from the adrenal cortex and the pituitary gland, respectively [16]. Although the signal transduction of AT1R is diverse, differs among tissues and depends on the (patho)physiological status [17], there are some common key components: AT1R is primarily a Gq-coupled receptor, mediating the activation of phospholipase C-β and a subsequent increase in cytoplasmic [Ca2+] via diacylglycerol and inositol 1,4,5-triphosphate (IP3). Ca2+ as a second messenger integrates the signal directly by binding to target proteins such as protein kinase C or indirectly through the Ca2+/calmodulin (CaM) complex. Further activated pathways include the mitogen-activated protein kinase (MAPK) pathway and the generation of reactive oxygen species [18].
AT2R shares rather low (~34%) sequence homology with AT1R [19], and its expression level is comparatively low [20]. To date, its function is less clear than that of AT1R, but it is generally assumed to antagonize the effects caused by its homologue, at least in kidney, heart and vasculature [21]. In the vasculature, AT2R counteracts the AT1R-mediated vasoconstriction by activating the vasodilatory bradykinin/nitric oxide/cyclic GMP axis [22]. AT2R coupling with Gαi and Gαs has been reported, and G-protein independent signaling may result in the activation of a number of signaling pathways [23].
Besides AT1R and AT2R, ACE transduces signals as well, in addition to cleaving ATI. Normally, a serine residue (Ser1270) at the very short cytoplasmic C-terminus of human ACE is phosphorylated by the associated casein kinase 2 (CK2), which prevents extracellular cleavage and the release of soluble and truncated ACE [24]. Interestingly, inhibiting ACE with ramipril increases not only CK2 activity including Ser1270 phosphorylation but also the activity of the ACE-associated c-Jun N-terminal kinase (JNK), followed by an increase in the nuclear fraction of phosphorylated c-Jun which is a major component of the transcription factor AP-1. Physiologically, ACE signaling is triggered by the ACE-mediated inactivation of bradykinin, but not during the process of ATI into ATII conversion [25]. Long-term signaling effects of the ACE inhibitors (ACEIs) ramipril and captopril include the increased expression of ACE itself and a modulated cyclooxygenase 2 (COX2) expression [26, 27]. More recent studies claim that even ATII, the product of ACE activity, is able to elicit signal transduction via ACE. In ACE-transfected Chinese Hamster Ovary (CHO) cells lacking AT1R and AT2R, ATII triggers Ca2+ signaling through IP3 formation [28]. The increase of Ca2+ is observed particularly in the nucleus and can be attributed to phospholipase C-β3 activity. In addition, ATII stimulates the clathrin-mediated internalization and subsequent nuclear translocation of the ATII/ACE complex, resulting in increased cell proliferation [29].
High blood pressure in hypertensive patients is treated preferentially by modulating the systemic RAAS, either with ACEIs in order to (i) prevent the conversion of ATI to ATII and (ii) increase the amount of vasodilatory bradykinin by impeding its degradation, or with angiotensin receptor blockers (ARBs) to block AT1R. ARBs, also called sartans, often have a better compliance due to minor adverse effects. A combination of both, ACEIs and ARBs, has no reasonably additive effect [14].
The expression of RAAS components is not restricted to the tissues and organs typically belonging to the systemic RAAS. Certain tissues are entirely independent from the systemic RAAS. They express not only the receptors for ATII but also their own (pro)renin, angiotensinogen and ACE. This para- and autocrine utilization of the RAAS components is termed “local RAAS”, and is important for tissue homeostasis by regulating proliferation, differentiation, apoptosis, migration and tissue remodeling [30]. These regulatory interrelations also affect carcinogenesis. The inhibition of parts of RAAS can alter the progression of various tumor entities. For example, the treatment of colorectal cancer, non-small-cell lung carcinoma and advanced gastric cancer with a platinum-based chemotherapeutic co-applied with ARBs or ACEI increases overall survival [31-33]. On the other hand, patients treated with ARBs have an increased risk of developing lung cancer [34], kidney cancer and melanoma [35].
In a previous study, we observed increased adhesion and invasion of human melanoma (MV3) cells in response to treatment with the ARB losartan [36]. Prompted by the ambiguity of the previous findings, we here address the assumption that ACE, in addition to AT1R and AT2R, is likely to modulate the metastatic behavior of MV3 cells. Losartan is used to inhibit AT1R, EMA401 (olodanrigan) is applied as a potent AT2R blocker [37], and lisinopril serves as ACEI. MV3 cell adhesion, migration and invasion are monitored in a coculture with hepatocytes to model a contact area between the metastatic cells and the target tissue as it might exist in the liver once CTCs have extravasated across the fenestrated, sinusoidal endothelium.
Materials and Methods
Substances and Drugs
Angiotensin II (ATII; used at a final concentration of 200 nmol l-1), the MMP2-inhibitor ARP-100 (100 nmol l-1), the AT2R inhibitor EMA401 (olodanrigan; 3 µmol l-1), and the AT1R inhibiting losartan potassium salt (1 µmol l-1) were purchased from Hycultec (Beutelsbach, Germany), the ACE inhibitor lisinopril (100 nmol-1) was from Santa Cruz Biotechnology (Dallas, USA). Since DMSO served as a vehicle for EMA401 and MMP2, it was invariably added to all experimental solutions at a final concentration of 0.03% (v/v).
Cell culture
The metastatic human melanoma MV3 cell line [38] and the human hepatocyte-derived carcinoma cell line Huh7 [39] were grown in RPMI 1640 medium (Merck KGaA, Darmstadt, Germany) supplemented with 10% (v/v) fetal bovine serum (FCS, PAA Laboratories GmbH, Pasching, Austria). HEK-293 (human embryonic kidney) cells were cultured in Eagle’s Minimum Essential Medium (EMEM, Lonza Group, Switzerland), supplemented with 10% FCS, non-essential amino acid and penicillin-streptomycin (100 U/ml and 100 µg/ml, respectively; PAN-Biotech, Aidenbach, Germany). All cells were kept in a humidified atmosphere with 5% CO2/ 95% air at 37°C.
qPCR
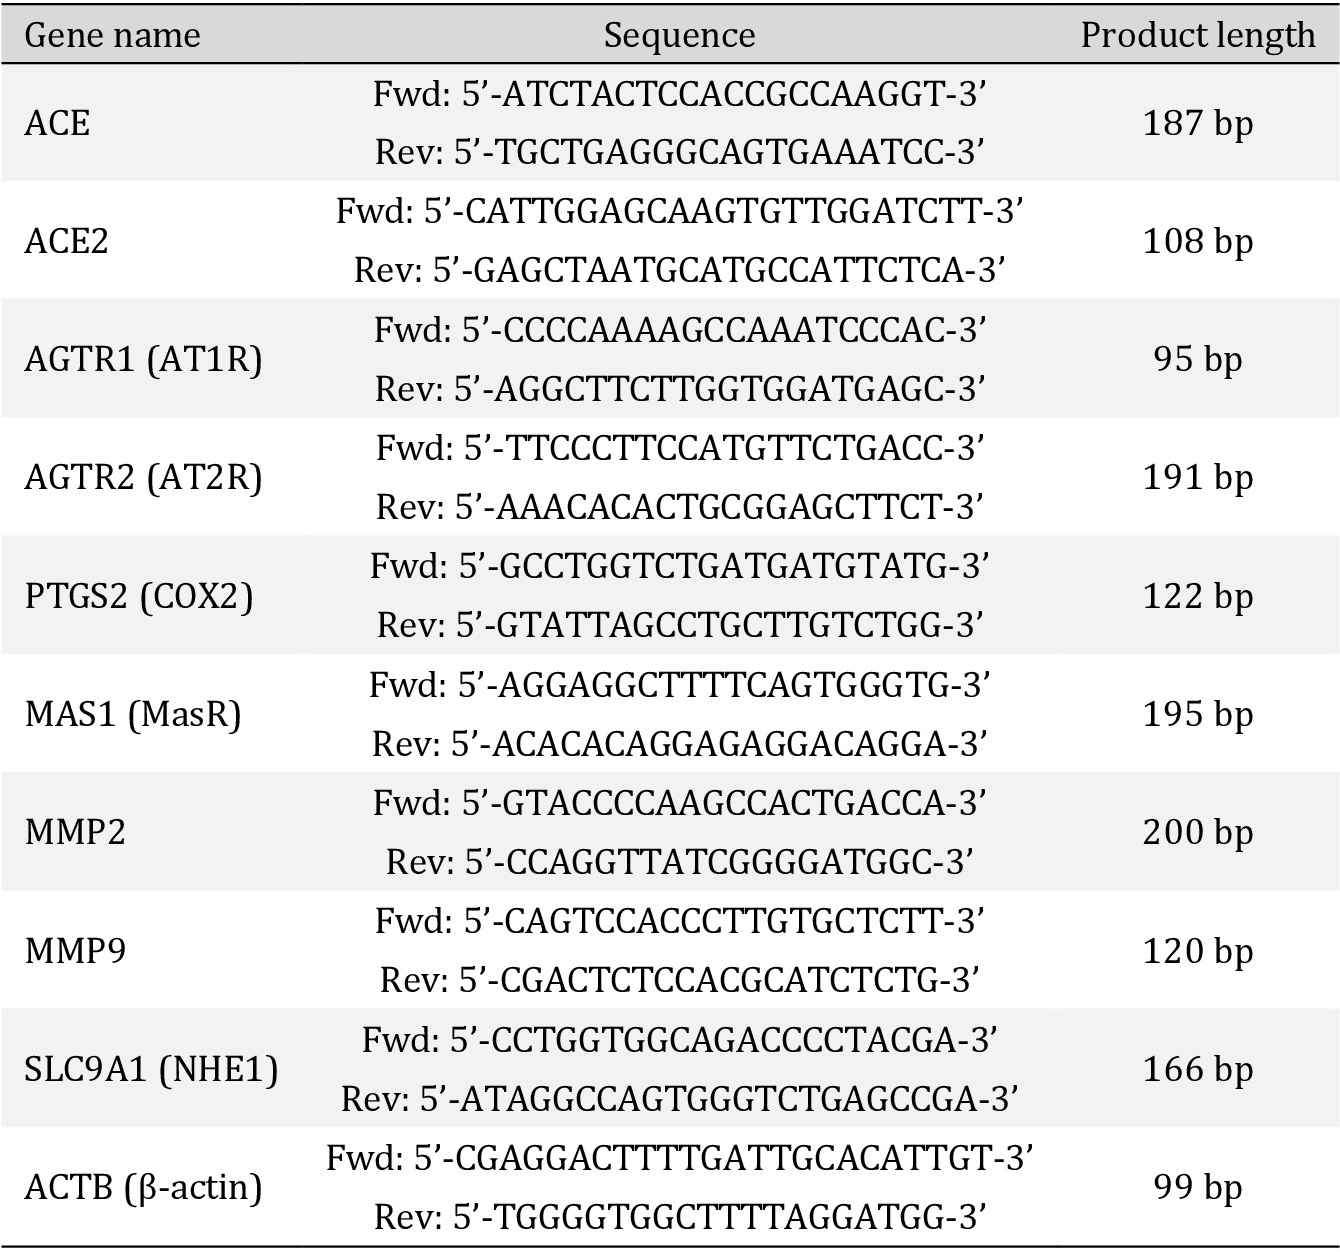
Primers (Table 1) were designed using the Primer Designing Tool (NCBI). Product length was 80-200 bp. All known transcript variants were covered. Melting temperature was 58 ± 2°C, the GC-content 50-60%. Cellular RNA was extracted on ice using the RNeasy Mini Kit (Qiagen, Hilden, Germany) according to the manufacturer’s instructions. The concentration of purified RNA was determined photometrically. 1 µg of total RNA was utilized for cDNA synthesis with the help of the RevertAid First Strand cDNA Synthesis Kit (Thermo Fisher Scientific Inc., Waltham, USA) which included the oligo (dT)18 primers used for mRNA reverse transcription by incubating the samples for 60 min at 42°C followed by a 5 minute termination reaction at 70°C. After cDNA synthesis, a 20-fold dilution of the product with nuclease-free water was subjected to qPCR. 10 µl of a reaction mix was prepared, composed of the diluted cDNA (4 µl), double concentrated (2x) SyGreen reaction mix (5 µl), 10 µmol l-1 forward (0.5 µl) and 10 µmol l-1 reverse primer (0.5 µl). Each gene was measured in triplicate. Independently of the gene to be amplified, each PCR was activated by a denaturing incubation for 5 min at 95°C, followed by 36 cycles: [5 sec at 95°C ó 10 sec at 60°C] and succeeded by a terminal gradual melting at temperatures increasing from 70 to 99°C at a rate of 1°C every 5 sec.
For further verification of length and integrity, qPCR products were loaded on a 1.7% agarose-TAE gel (agarose from VWR International, Randor, USA; TAE composition in mmol l-1: 40 Tris, 20 acetic acid, 1 EDTA) and separated for one hour at a constant voltage of 170V. The samples were visualized by the intercalating dye Roti®-GelStain (Carl Roth, Karlsruhe, Germany) added into the non-polymerized gel.
The ΔCt-value was calculated with the help of β-actin as a constantly expressed housekeeping gene: ΔCt = Ct(transcript) - Ct(β-actin). Assuming that the amount of the specific product perfectly doubled during each cycle, two to the power of -ΔCt was calculated to obtain the relative expression compared to β-actin: 2-ΔCt = relative expression. For comparison of transcriptional regulations between different drug treatments, the ΔΔCt was used for fold change calculation: ΔΔCt = ΔCt(after treatment) – ΔCt(control); fold change = 2-ΔΔCt.
Detection of pERK1/2 and MMP2 by Western blot
pERK1/2. Confluent cells were cultured under serum-free conditions for 24 h, exposed to the respective drug(s) for 10 min, and washed once with cold phosphate-buffered saline (PBS w/o Ca2+, Mg2+; Lonza). Cells were then lysed at 4°C in ice cold lysis buffer (containing: 150 mmol l-1 NaCl, 1 mmol l-1 EDTA, 1 mmol l-1 EGTA, Tris-HCl (pH 7.0), 1% (v/v) NP-40, 0.1 % (w/v) SDS, a protease and a phosphatase inhibitor cocktail (cOmplete, Mini; PhosSTOP; both from Roche, Basel, Switzerland)). Lysates were scraped off, sheared through a 0.9 mm cannula, and then incubated under constant rotation at 4°C overnight. The next day, the lysates were spun down at 7,500⨯g and 4°C for 10 min. Protein concentrations in the supernatants were determined with the PierceTM Bicinchoninic Acid (BCA) Protein Assay Kit (Thermo Fisher Scientific). 30 µg of protein, mixed with Laemmli loading buffer (containing: 2% (w/v) SDS, 50 mmol l-1 Tris-HCl (pH 6.8), 10% (v/v) glycerol, 0.006% (w/v) bromphenol blue indicator, 100 mmol l-1 freshly added dithiothreitol) and boiled at 95°C for 5 min, were loaded, separated by SDS-PAGE (12% acrylamide; Minigel System, Bio-Rad Laboratories (Hercules, USA)), and transferred onto an EtOH-activated polyvinylidene difluoride (PVDF) membrane (GE Healthcare, Chalfont St Giles, UK) at 240 mA. PVDF membranes were then immersed in 5% (w/v) bovine serum albumin (BSA) in Tris-buffered saline Tween (TBST: 150 mmol l-1 NaCl, 4.6 mmol l-1 Tris, 15.2 mmol l-1 Tris-HCl, 0.1% (v/v) Tween20) for 1 h at room temperature, followed by overnight incubation at 4°C with the primary antibody against phosphorylated ERK1/2 (rabbit monoclonal anti phospho-p44/42 MAPK, 1:1,000 in 2% BSA/TBST, Cell Signaling Technology, Cambridge, UK). After washing in TBST, blots were incubated with a horseradish peroxidase conjugated secondary antibody (goat anti-rabbit HRP, 1:10,000 in 2% BSA/TBST, Thermo Fisher Scientific) for 1 h at room temperature, washed again, and then developed using a chemiluminescence kit (ECL Western Blotting detection kit, GE Healthcare). Autoluminography was carried out with a Fusion FX imaging system (Vilber Lourmat, Eberhardzell, Germany), the Fusion FX software was used to perform densitometric quantification. After detection of the phosphorylated fraction (pERK), the membrane was stripped with stripping buffer (2% (w/v) SDS, 0.8% (w/v) β-mercaptoethanol, 62.5 mmol l-1 Tris (pH 6.8)) at 50°C under agitation for 60 min. Another cycle of blocking, overnight incubation with a primary antibody against the total ERK-fraction (tERK) (rabbit monoclonal anti p44/42 MAPK, 1:1,000 in 2% BSA/TBST, Cell Signaling Technology) and chemiluminescence detection followed, and the pERK/tERK ratios were calculated.
MMP2. Nearly confluent MV3 cells, grown in a 6-well plate, were washed once with PBS before the cell were exposed to 1 ml of serum-depleted medium containing the drug(s). After 24 h of incubation, the supernatant was harvested and proteins were precipitated by adding 112 µl aqueous trichloracetic acid and 11 µl 10% (v/v) Triton X-100 to the medium. After 30 min incubation on ice, the precipitated proteins were spun down at 20,000⨯g and 4°C for 20 min. The pellet was washed with acetone, spun down again, and resuspended in 50 µl Laemmli loading buffer. 25 µl of the total volume were separated by SDS-PAGE (10% acrylamide) as described above (2.4.1.). After blotting, the PVDF membrane was washed in distilled water and stained with Ponceau S (0.5% (v/v) Ponceau S (Merck) in 1% (v/v) acetic acid) for several minutes. Excess dye was removed by washing the membrane with distilled water until protein bands were clearly visible. The membrane was photographed and the dye was then washed out with TBST, followed by overnight incubation with the primary antibody against MMP2 (rabbit polyclonal, 1:1,000, Cell Signaling Technology) and the above-described chemiluminescence detection procedure.
Proliferation
In Huh7 conditioned medium. 1.5⨯105 MV3 cells/well were seeded into 6-well plates and cultured in RPMI 1640 medium conditioned by either Huh7 or MV3 cells over a period of 120 h. The conditioned medium accounted for 33% of the total medium amount. After 48 h, three wells per condition were trypsinized and pooled for cell counting. To discriminate between live and dead cells, 10 µl of each sample were mixed with 10 µl trypan blue solution before being counted by an automated cell counter (LUNA-IITM automated cell counter & LUNATM cell counting slides, Logos Biosystems, Donga-gu-Anyang-si, South Korea). Each sample was measured in triplicate.
In serum-containing medium. 3⨯104 MV3 cells/well were seeded into 24-well plates and exposed to drug-containing media. After 24 h, ATII was renewed and after another 24 h, proliferation was determined. Four wells per condition were trypsinized and pooled for counting in duplicate according to the trypan blue procedure.
In serum-free medium. 24 h serum-starved MV3 cells were seeded into a 24-well plate at a density of 6⨯104 cells/well and exposed to the selected drugs for 96 h. ATII was renewed every 24 h and proliferation analyzed as described for serum-containing medium.
Adhesion
To a collagen type I-based matrix. A collagen I substrate was prepared by gently mixing 210 µl of 5x RPMI1640, 210 µl of 5x HEPES (final concentration in the polymerized gels: 10 mmol l-1) and 570 µl of Collagen G (containing acid-soluble calfskin collagen I at a concentration of ~4 mg ml-1; Merck). The pH value of the mixture was adjusted to 7.2 with 1 M NaOH. 24-well plates were coated with ~60 µl/well of this mixture which then polymerized overnight at 37°C in a humidified atmosphere. 3⨯104 MV3 cells/well were seeded onto the polymerized matrix and allowed to attach at 37°C in serum-containing RPMI1640 mixed with the selected drugs. After 60 min, the medium including the non-adherent cells was washed away with cold PBS, the remaining cells were fixed with 3.5% PFA and counted microscopically (inverse microscope Axio Vert.A1 and 10x objective LD A-Plan, Carl Zeiss, Oberkochen, Germany). Each experiment included four wells with the same condition. The number of adhesive cells was determined by capturing four different images per well at comparable positions and calculating the average per well with the help of the NIH ImageJ Cell Counter plugin.
To a Huh7 cell layer. 5⨯104 MV3 cells/well (24 well plate) were seeded on top of a fully confluent Huh7 cell layer. The medium, half-fresh and half Huh7 conditioned RPMI1640, was mixed with the selected drug(s). After 3 h of incubation at 37°C, media were removed and the adherent cells were examined as outlined above.
Migration and invasion of MV3 in coculture with Huh7 cells
Huh7 cells were grown in Falcon® 12.5 cm2 culture flasks (Corning, NY, USA). After 7 days, when the hepatocytes had formed a confluent, tight cell layer, 2.5x10⁵ MV3 cells, resuspended in RPMI 1640, were seeded on top, followed by a 60 min incubation in the presence of the selected drugs at 37°C in the humidified incubator. The flask was then tightly closed and placed in a heating chamber (37°C) mounted on an AxioVert.A1 inverted microscope (Carl Zeiss). Cell migration was recorded by time-lapse microscopy at 10 min intervals over 12 h using a digital camera (CCD, C8484-05G02) and the HCImageLive image acquisition software (both from Hamamatsu Photonics K.K., Hamamatsu City, Japan). The cell center represented the coordinates indicating its current position. Well definable central nucleoli were tracked once the MV3 cell had invaded the hepatocyte layer. Point of invasion was defined as the point in time at which the MV3 cell penetrated the hepatocyte layer by pushing the subjacent Huh7 cells aside. Migration velocity, total distance covered, translocation and invasion were analyzed with the help of the Manual Tracking plugin of the NIH ImageJ software. Translocation means the net distance between starting and end point, directionality is the ratio of the translocation divided by the total distance covered.
MV3 cell invasion of an extracellular matrix
Invasion of collagen I-coated filter inserts (8.0 µm pore size, 24-well plate) was determined by employing the Boyden chamber technique. 6x10⁴ MV3 cells in fresh medium were seeded on the upper side of a matrix-coated filter membrane. A chemogradient was generated filling the lower compartment with medium conditioned by Huh7 cells for 24 h. Drugs were added in both the upper and the lower compartment and cells were incubated at 37°C. After 24 h the media including the drugs were renewed in both compartments followed by another 24 h of incubation. Cells were then fixed and stained with crystal violet (0.25% (w/v) crystal violet, 1% (v/v) PFA, 1% (v/v) methanol in PBS with Mg2+/Ca2+). The matrix including the remaining cells on the upper side of the filter were carefully removed with a cotton swab. The cells remaining on the lower side of the filter and those on the bottom of the well were counted microscopically.
Transepithelial electrical resistance (TEER) measurements
Huh7 cells were seeded on the upper side of a transwell insert (pore size 0.4 µm, 6 well plate). TEER of the hepatocyte monolayer was measured at 24 h intervals using an epithelial Volt/Ohm meter 3 (EVOM3) with an STX2 electrode (World Precision Instruments, Sarasota, USA). Medium (including drugs) was exchanged every other day. Drugs were added when TEER reached a first plateau at 650-800 Ω⨯cm2 for two consecutive days. One hour after drug application TEER was measured again and then further monitored every 24 h.
In order to identify the impact of soluble factors released from MV3 cells on TEER, transwell inserts were flipped over and Huh7 cells were seeded on the lower side of the filter membrane. The cells were allowed to adhere for 3 h before the filter membranes were turned back and placed in the wells as usual. TEER was measured every 24 h until reaching values of 600-650 Ω⨯cm2. Pairs of wells with comparable, stable TEER values were selected. 1.25⨯106 MV3 cells were seeded on the upper side of the insert, without physical contact to the hepatocytes, and treated with the drugs. At 24 h intervals TEER was determined as well as the drugs renewed. Media were not substituted once the MV3 cells had been added, in order to enrich secreted, potentially pro-invasive components.
NHE1 activity
Intracellular pH (pHi) and the activity of the Na+/H+ exchanger 1 (NHE1) were measured ratiometrically employing the ammonium prepulse method [40]. MV3 cells were seeded on uncoated coverslips (Ø 25 mm) one day before the experiment. The next day, the cells were allowed to adapt to HEPES-buffered Ringer’s solution (in mmol l-1: 122.5 NaCl, 5.4 KCl, 1.2 CaCl2, 0.8 MgCl2, 1 NaH2PO4, 5.5 glucose, 10 HEPES; pH 7.2) for one hour at 37°C. Upon addition of the antihypertensive(s), they were incubated for another hour. Cells were then loaded with BCECF-AM (3.125 µg ml-1; Thermo Fisher Scientific). After loading, the coverslips were placed on the stage of an inverted microscope (Axio Observer A1, Carl Zeiss) and continuously superfused (flow rate 1.1 ml min-1) with prewarmed HEPES-buffered Ringer’s solution containing the relevant drugs. The BCECF was excited at alternating waveleghts of 440 and 490 nm with a polychromator system (Visichrome, Visitron Systems, Puchheim, Germany) controlled by the VisiView software. A Photometrics® camera (CoolSnap HQ2, Visitron Systems) detected the emitted fluorescence at 500 nm. Regions of interest were placed over the cytosol between the plasma membrane and the nucleus. Fluorescence intensities were measured at 30 s intervals and corrected for background fluorescence. After reaching a steady state pHi in the HEPES-buffered Ringer’s solution, cells were superfused with NH4Cl solution (containing in mmol l-1: 20 NH4Cl, 102.5 NaCl, 5.4 KCl, 1.2 CaCl2, 0.8 MgCl2, 10 HEPES; pH 7.2). This NH4+ prepulse led to an intracellular alkalinization. As soon as a plateau became apparent, the cells were superfused with Na+-free TMA (tetramethylammonium)-solution (122.5 mmol l-1 (TMA)Cl) and pHi decreased instantly. When the minimum pHi was reached, TMA was removed and cells were superfused with Na+-containing HEPES-buffered Ringer’s solution again, to enable Na+-dependent, NHE1-mediated H+ transport across the plasma membrane. As a function of the Na+-dependent NHE1-activity pHi recovered to eventually reach the original value obtained at the beginning of the measurement. NHE1 activity was quantified based on the initial slope immediately after the re-addition of the Na+-containing HEPES-buffered solution. At the end of each pHi measurement, the cells were consecutively exposed to calibration solutions of pH 7.5 and 6.5 containing (mmol l-1): 125 KCl, 1.2 CaCl2, 0.8 MgCl2, 20 HEPES and 10 µmol l-1 nigericin (Merck KGaA) [41].
Statistics
Bar charts display mean values + S.D.. Box plots show the median; the second and the third quartile are drawn with whiskers within the 1.5 IQR value. Significance was determined with the Student’s paired or unpaired t-test when two groups were compared. More than two groups were compared using ANOVA followed by the Tukey post hoc test. In addition, the Chi-Square test was applied to the proportion of invasive cells in the coculture experiments. All tests were performed using the R software. p-values ≤ 0.05 were considered as significant (* = p ≤ 0.05; ** = p ≤ 0.01; ***= p ≤ 0.001).
Results
MV3 cells express RAAS components
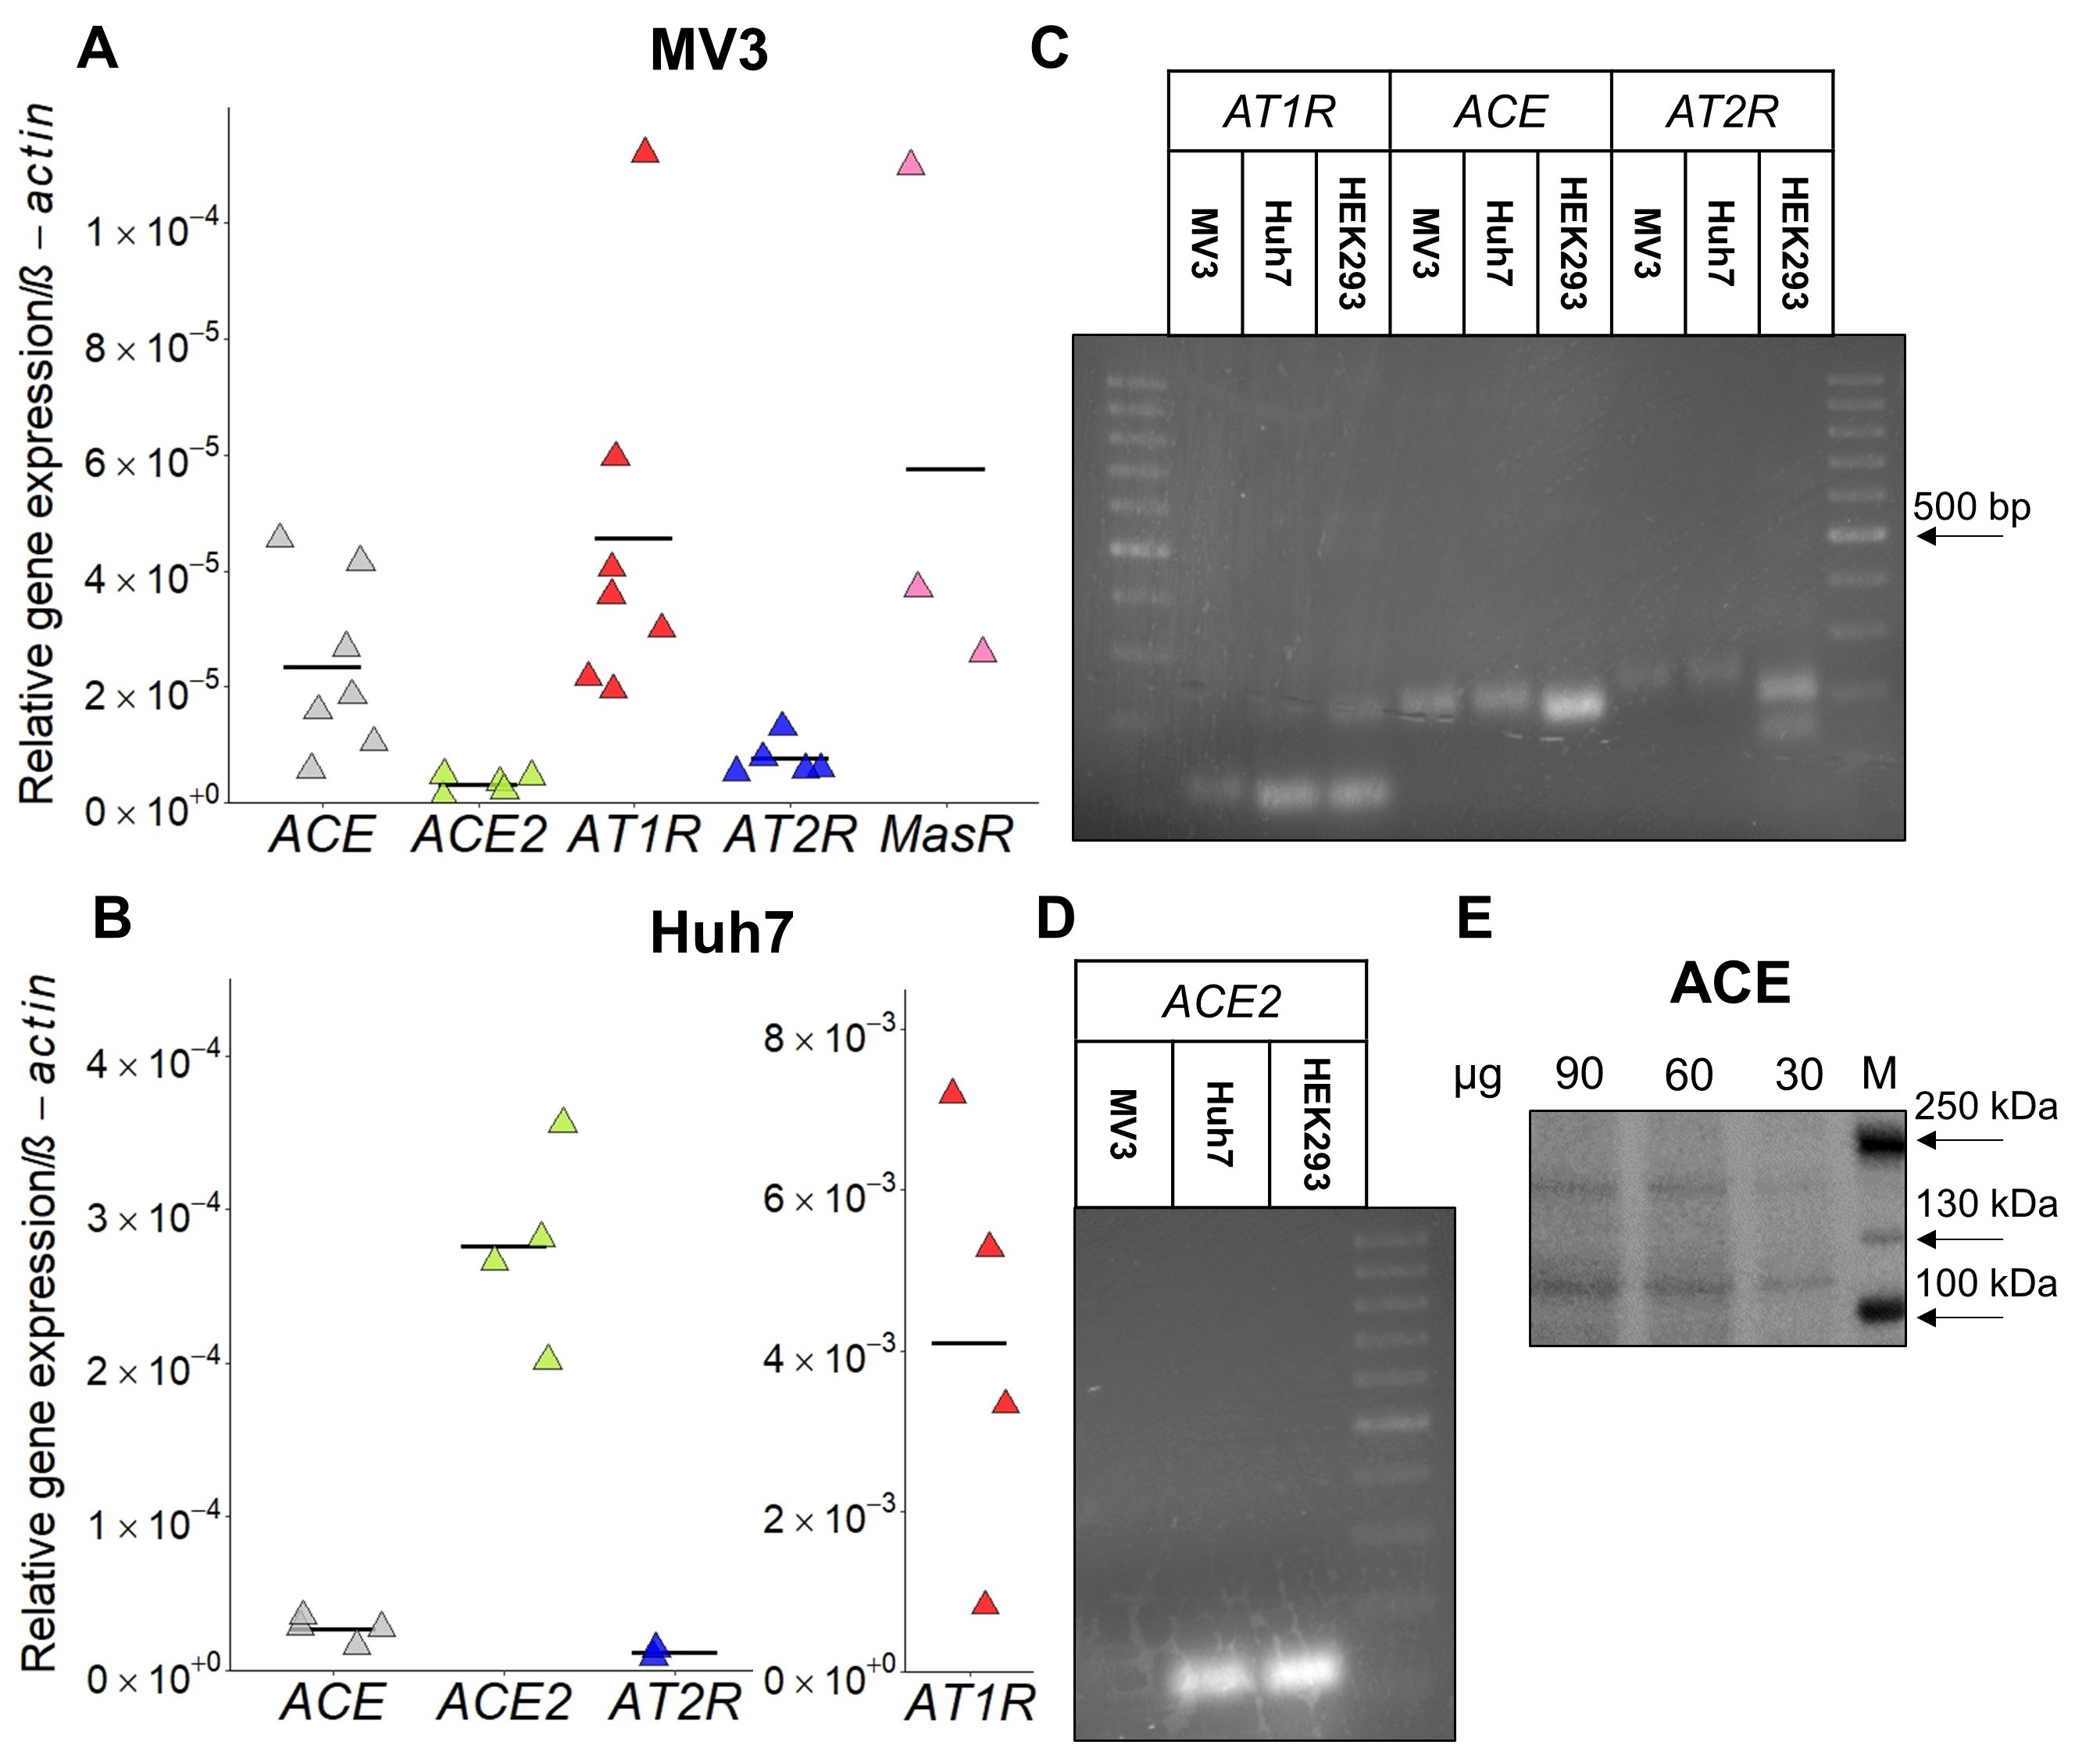
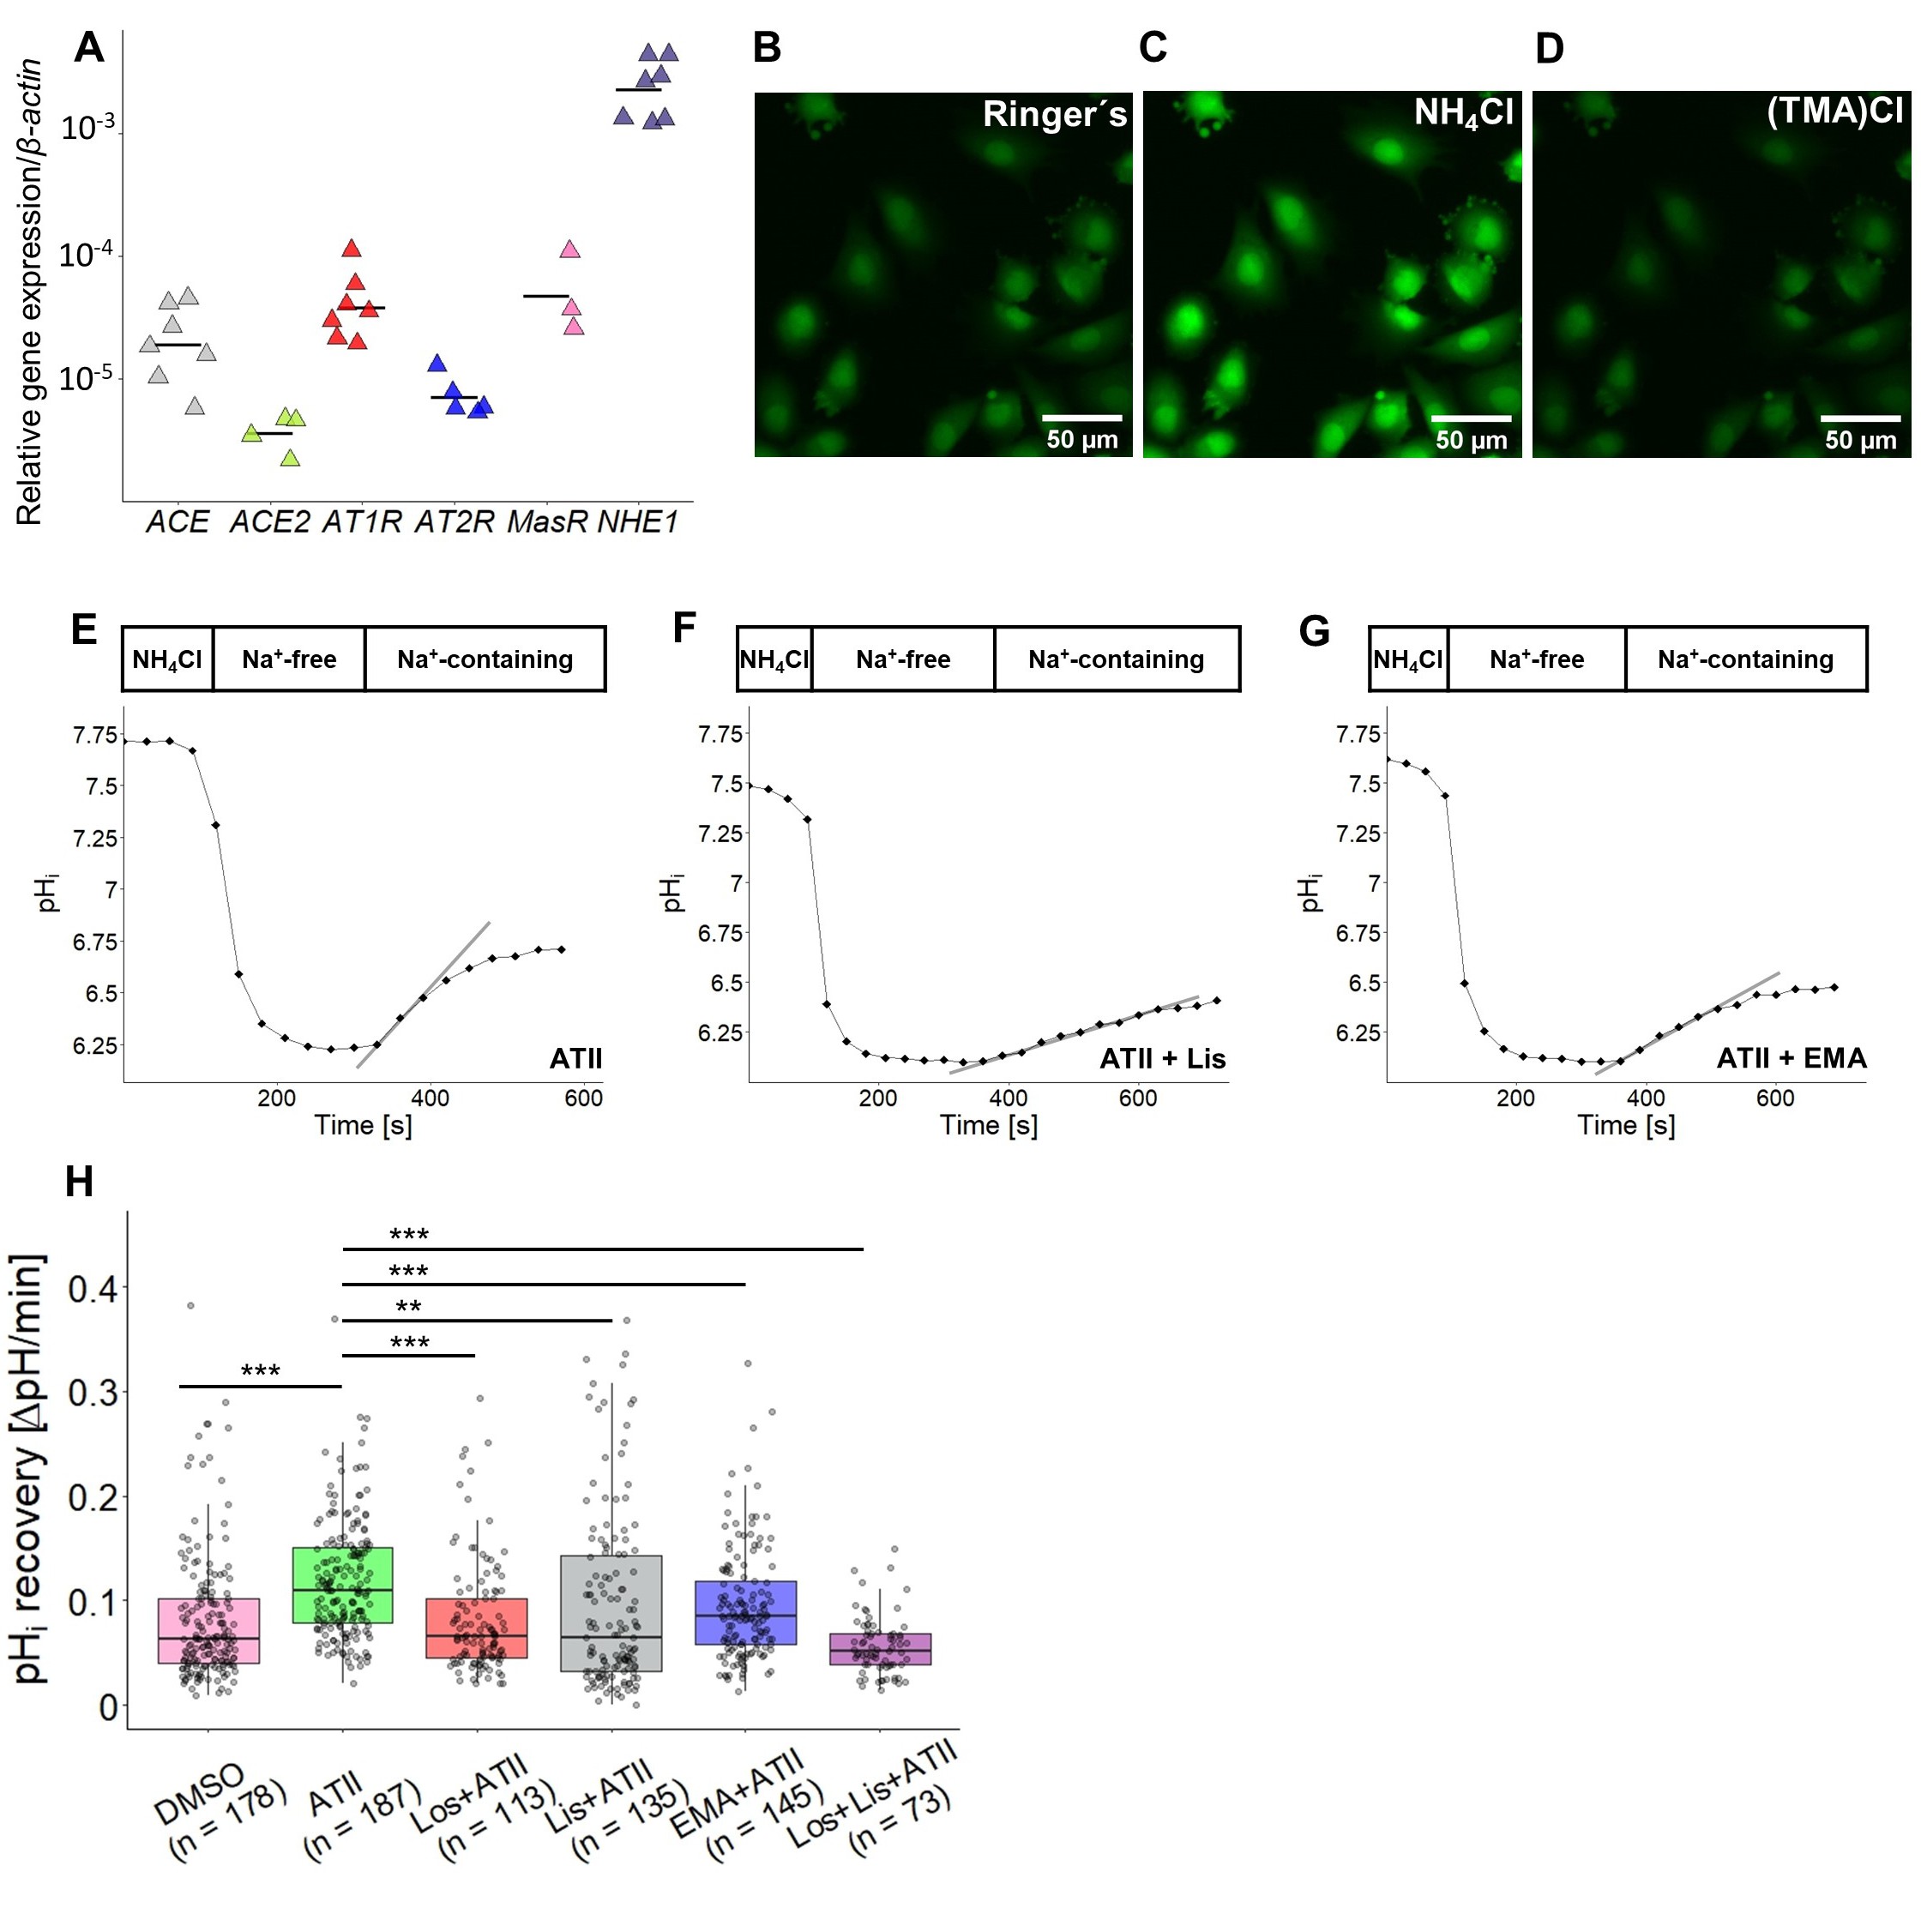
The expression of RAAS components in MV3 and Huh7 cells was determined by qPCR (Fig. 1). MV3 cells expressed both types of the angiotensin II receptor, AT1R and AT2R, albeit AT2R expression was rather week. They also expressed ACE, but not ACE2. This expression profile is in line with that of tissue samples of metastatic melanomas from both primary tumors in the head/neck region and melanoma-derived brain metastases, supporting the existence of an auto-/paracrine RAAS in malignant melanomas [42, 43].
Due to a lack of specific antibodies directed against AT1R and AT2R [44], expression at protein level could be confirmed merely for ACE (Fig. 1E) In view of the coculture experiments, we examined the expression of RAAS components also in Huh7 cells because RAAS modulators may potentially alter their behavior as well. Huh7 cells expressed ACE, ACE2 and, more strongly than MV3 cells, AT1R (Fig. 1B). AT2R was just marginally expressed, if at all.
Relying on information from the Human Protein Atlas, HEK293 cells were meant to serve as a negative control for AT1R and AT2R expression. However, they did express AT1R and AT2R (Fig. 1C), and also ACE and ACE2 (Fig 1C, D, quantitative data not shown).
RAAS modulators stimulate MV3 cell invasion of a hepatocyte monolayer
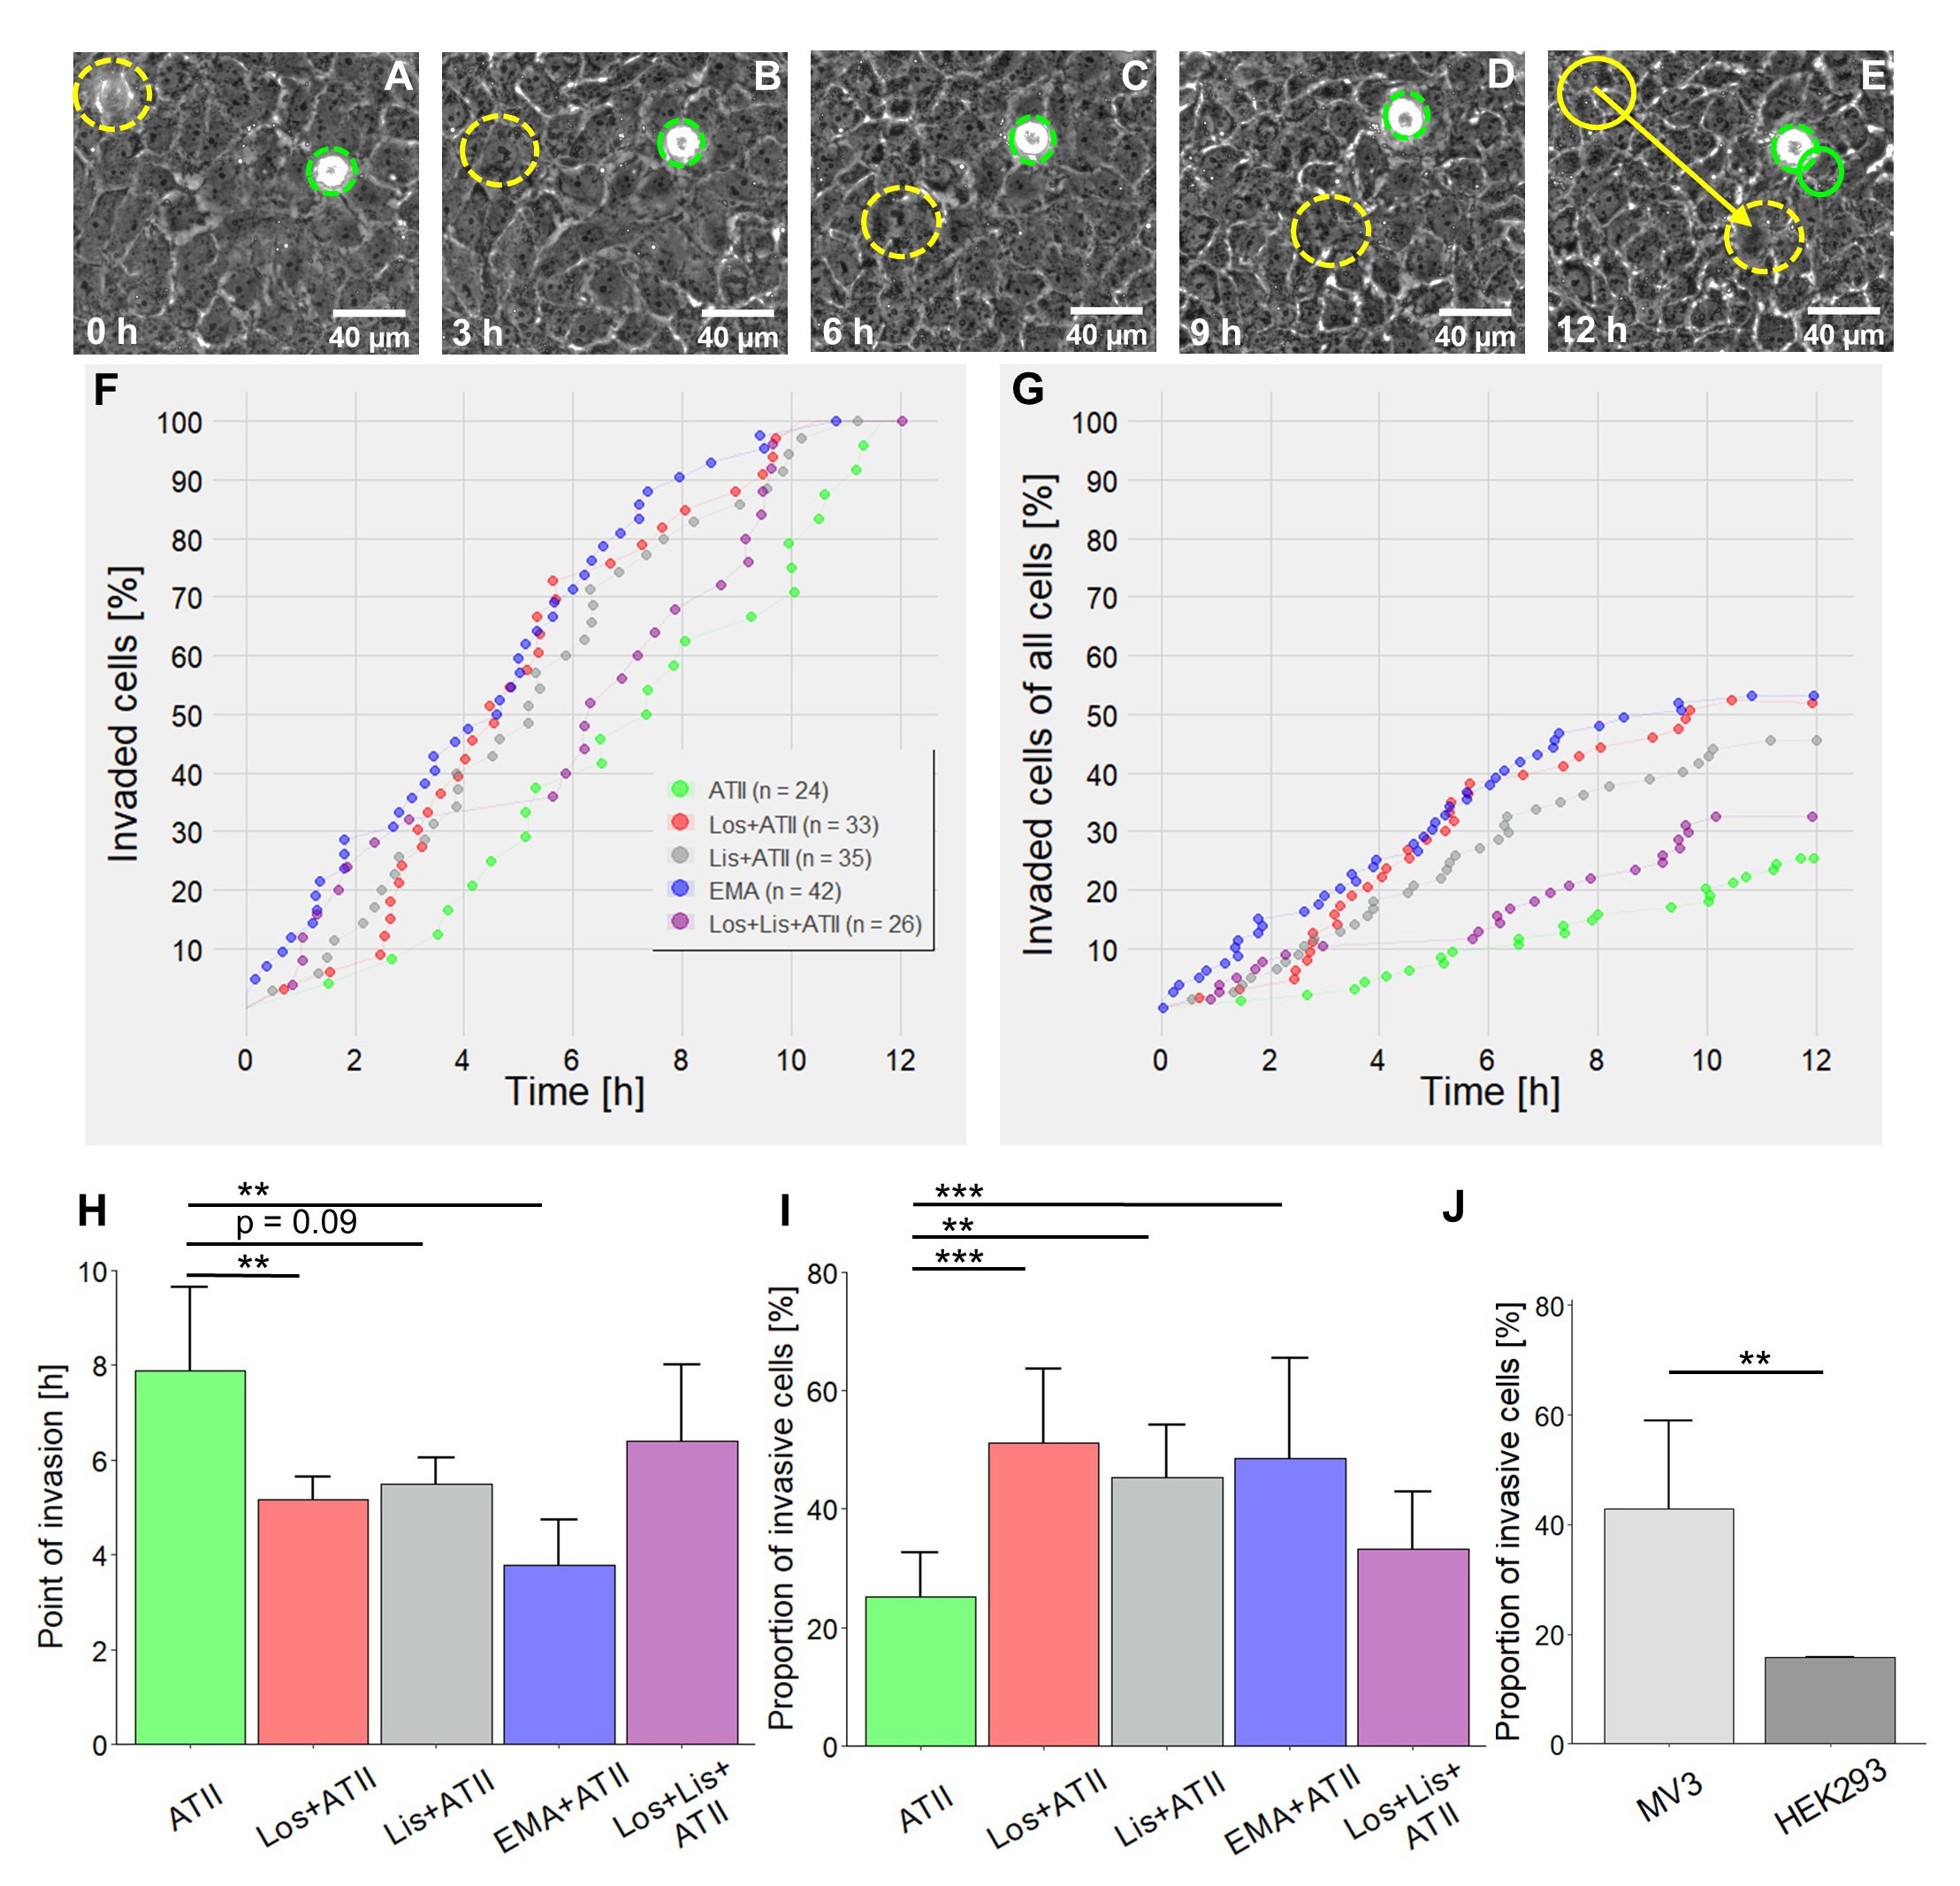
The liver is one of the preferred target organs for metastatic melanoma cells. For this reason, we investigated the impact of RAAS modulators in a coculture model consisting of highly invasive MV3 cells and the hepatocellular carcinoma cell line Huh7, which is characterized by a well differentiated, epithelial like phenotype [45]. MV3 cells placed on a confluent, tight monolayer of Huh7 hepatocytes showed an active migratory and invasive behavior (Fig. 2, 3). Quite a number of MV3 cells invaded the hepatocyte layer through intercellular clefts. Once inside or underneath the hepatocyte layer, the MV3 cells covered considerable distances (Fig. 2A-E, 3C-J). Non-invasive MV3 cells remaining on top of the hepatocytes retained their spherical shape with occasional attempts to become flat and spread. Treating the coculture with RAAS-modulators caused a change in the time course of invasion (Fig. 2F). MV3 cells treated with losartan+ATII (mean time of invasion = 5.2 h), lisinopril+ATII (mean = 5.5 h), or EMA401+ATII (mean = 3.8 h) invaded the hepatocyte layer clearly earlier than those exposed to ATII alone (mean = 7.8 h; Fig. 2F, H). Furthermore, combined application of ATII and a RAAS modulator significantly augmented the total amount of invasive cells (Fig. 2G, I). More precisely, in cocultures treated with ATII alone 25% of the MV3 cells were invasive whereas combined application of ATII and one of the RAAS modulators increased the proportion of invasive cells to 45-50% (Fig. 2I). Surprisingly, the combination of losartan, lisinopril and ATII did not increase the percentage of invasive cells. To verify that the observed invasive phenotype is an attribute of malignant cells, we compared the behavior of non-malignant HEK293 cells with that of completely untreated MV3 cells. HEK293 cells were indeed considerably less invasive (Fig. 2J).
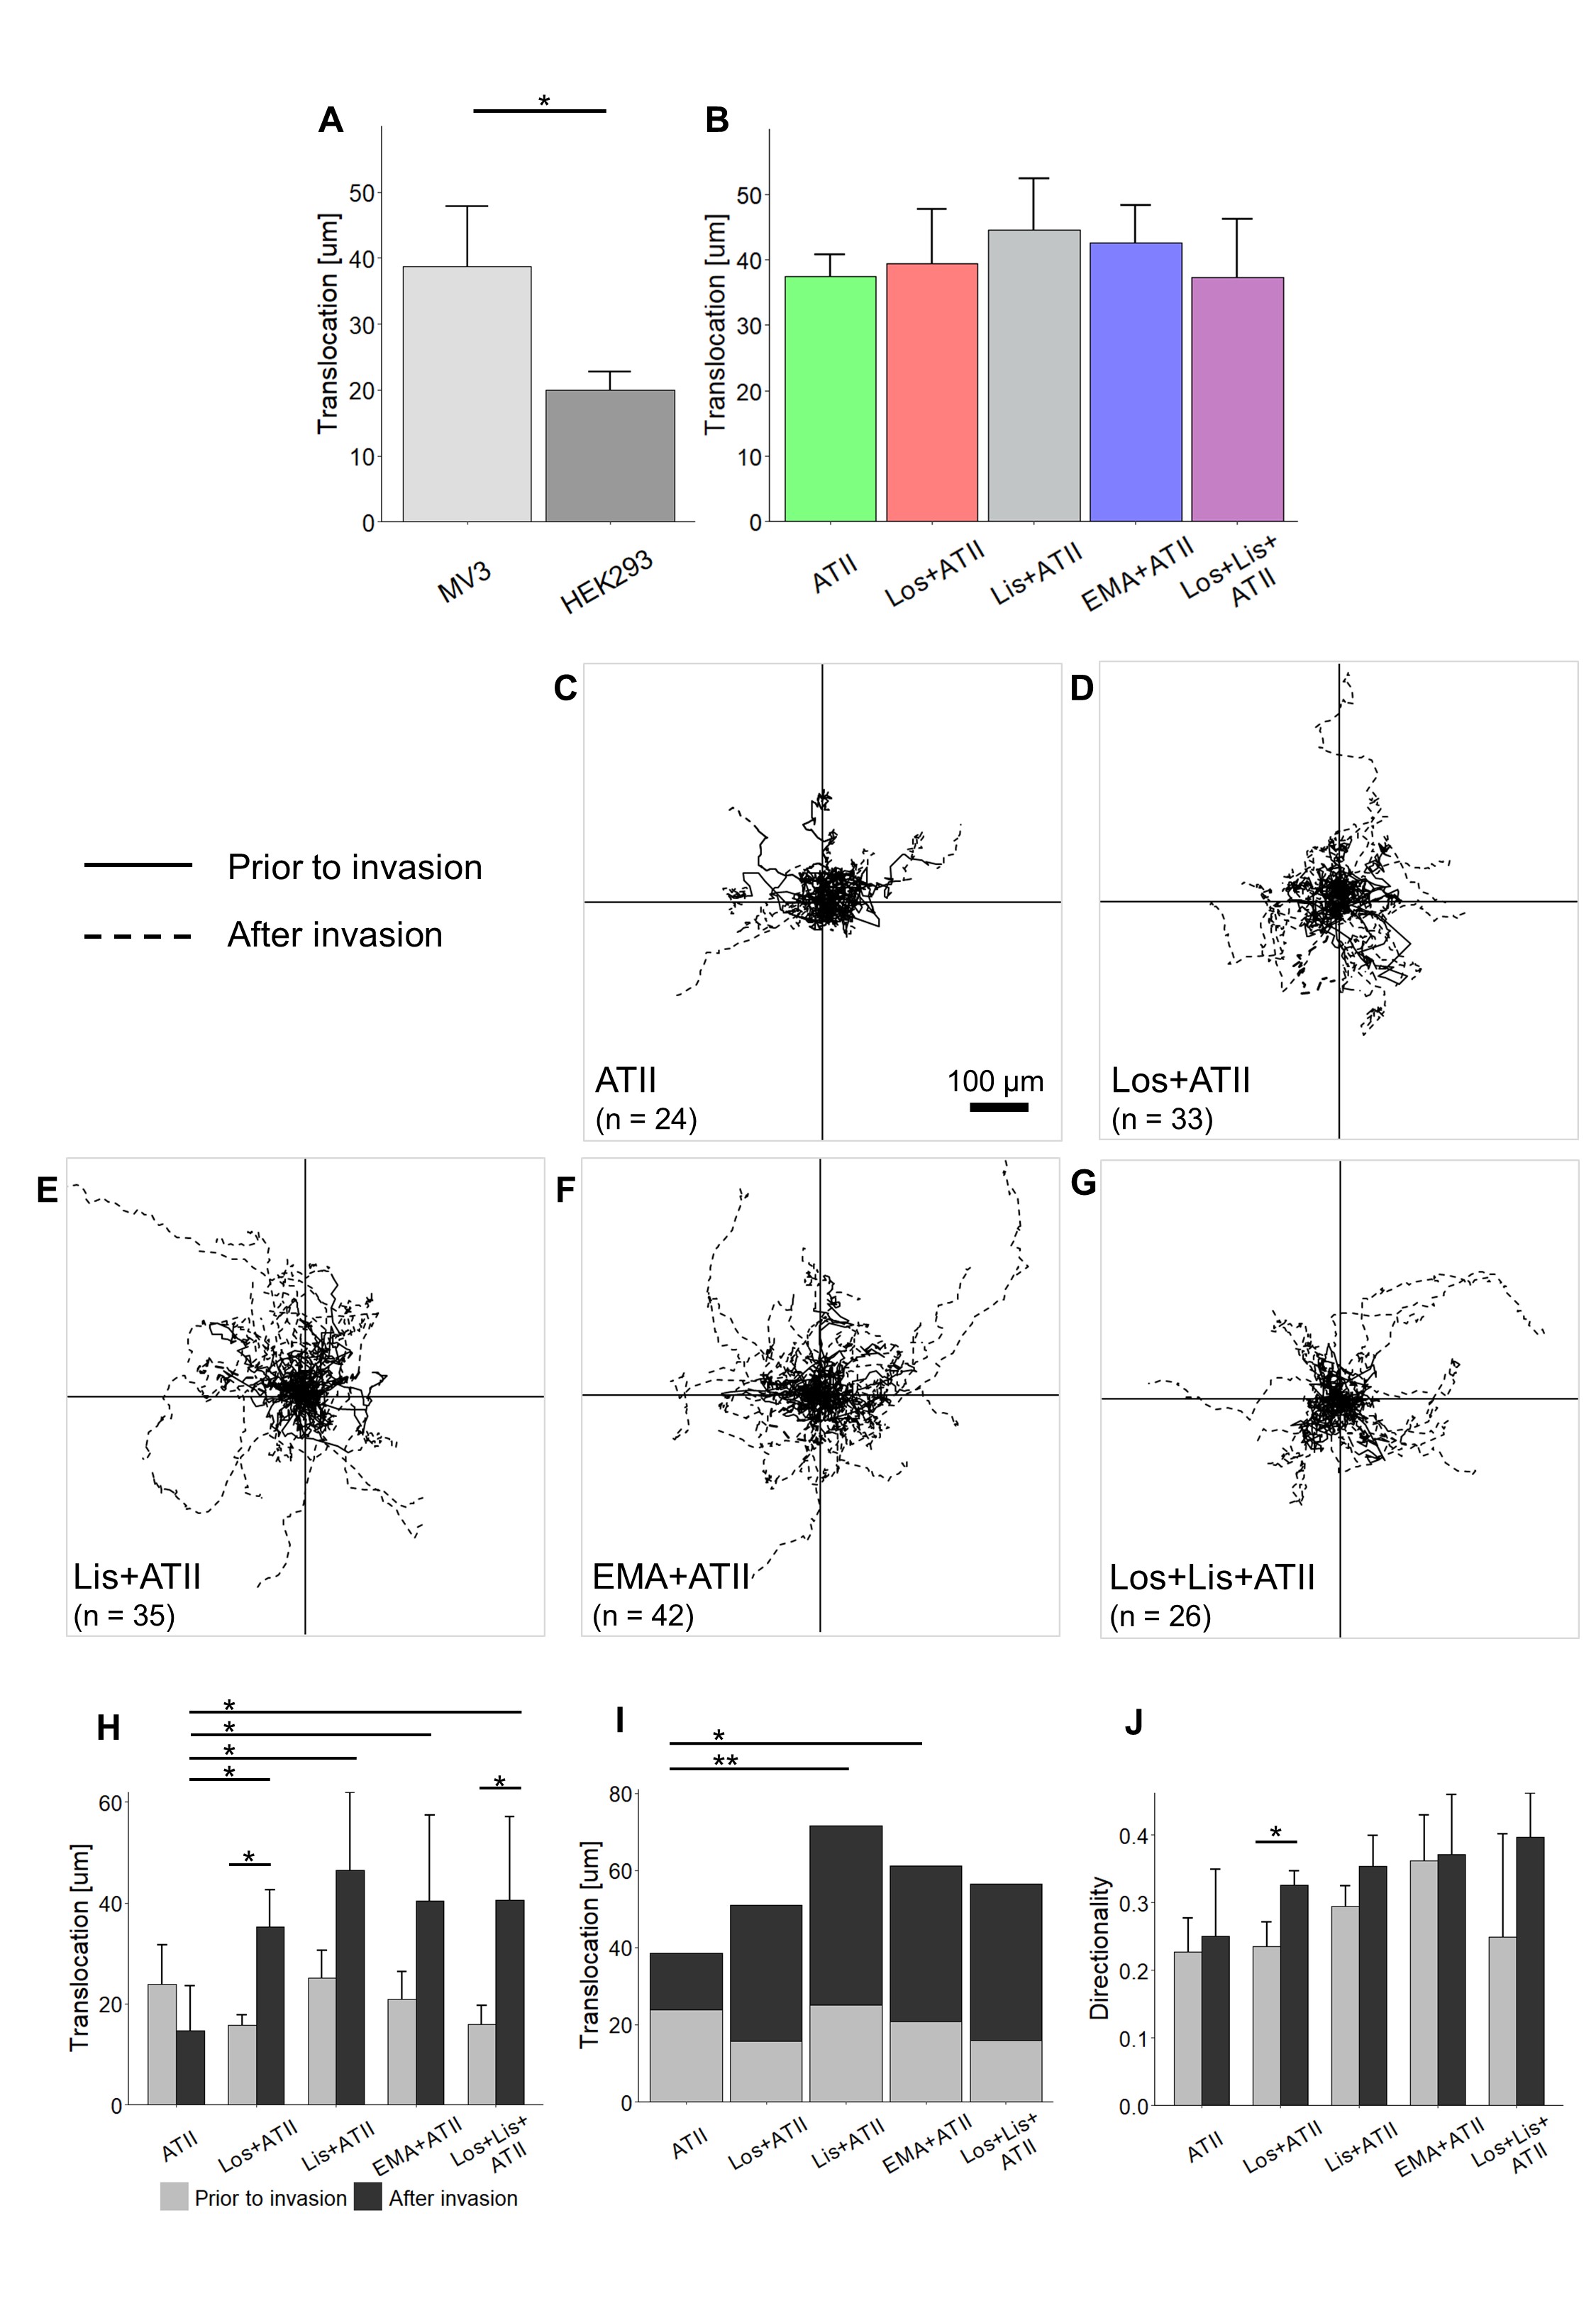
The migratory activity of MV3 cells, given as translocation (µm) within 12 h, was also clearly higher than that of HEK293 cells (Fig. 3A). The different RAAS modulators, always applied in the presence of ATII, did not change the overall translocation of MV3 cells (Fig. 3B). However, drug-dependent differences in migratory activity became apparent, particularly after invasion, when taking a closer look at the group of invasive cells (Fig. 3C-J). Trajectories of single cells illustrate how the RAAS modulators fueled MV3 cell motility, especially once the cells had invaded the Huh7 cell monoloayer (Fig. 3C-G). Quantitative data affirmed this pattern: RAAS modulators increased the post-invasive translocation when compared to the ATII control (Fig. 3H), leading to the observation that the total translocation (=prior to + after invasion) tended to be increased whenever RAAS modulators were applied in addition to ATII. It was significantly increased in cells exposed to lisinopril (+ATII) or EMA401 (+ATII) (Fig. 3I). The post-invasive directionality also showed a tendency to be increased in cells treated with RAAS-modulators (Fig. 3J). No changes in the mean migration velocity were found (data not shown).
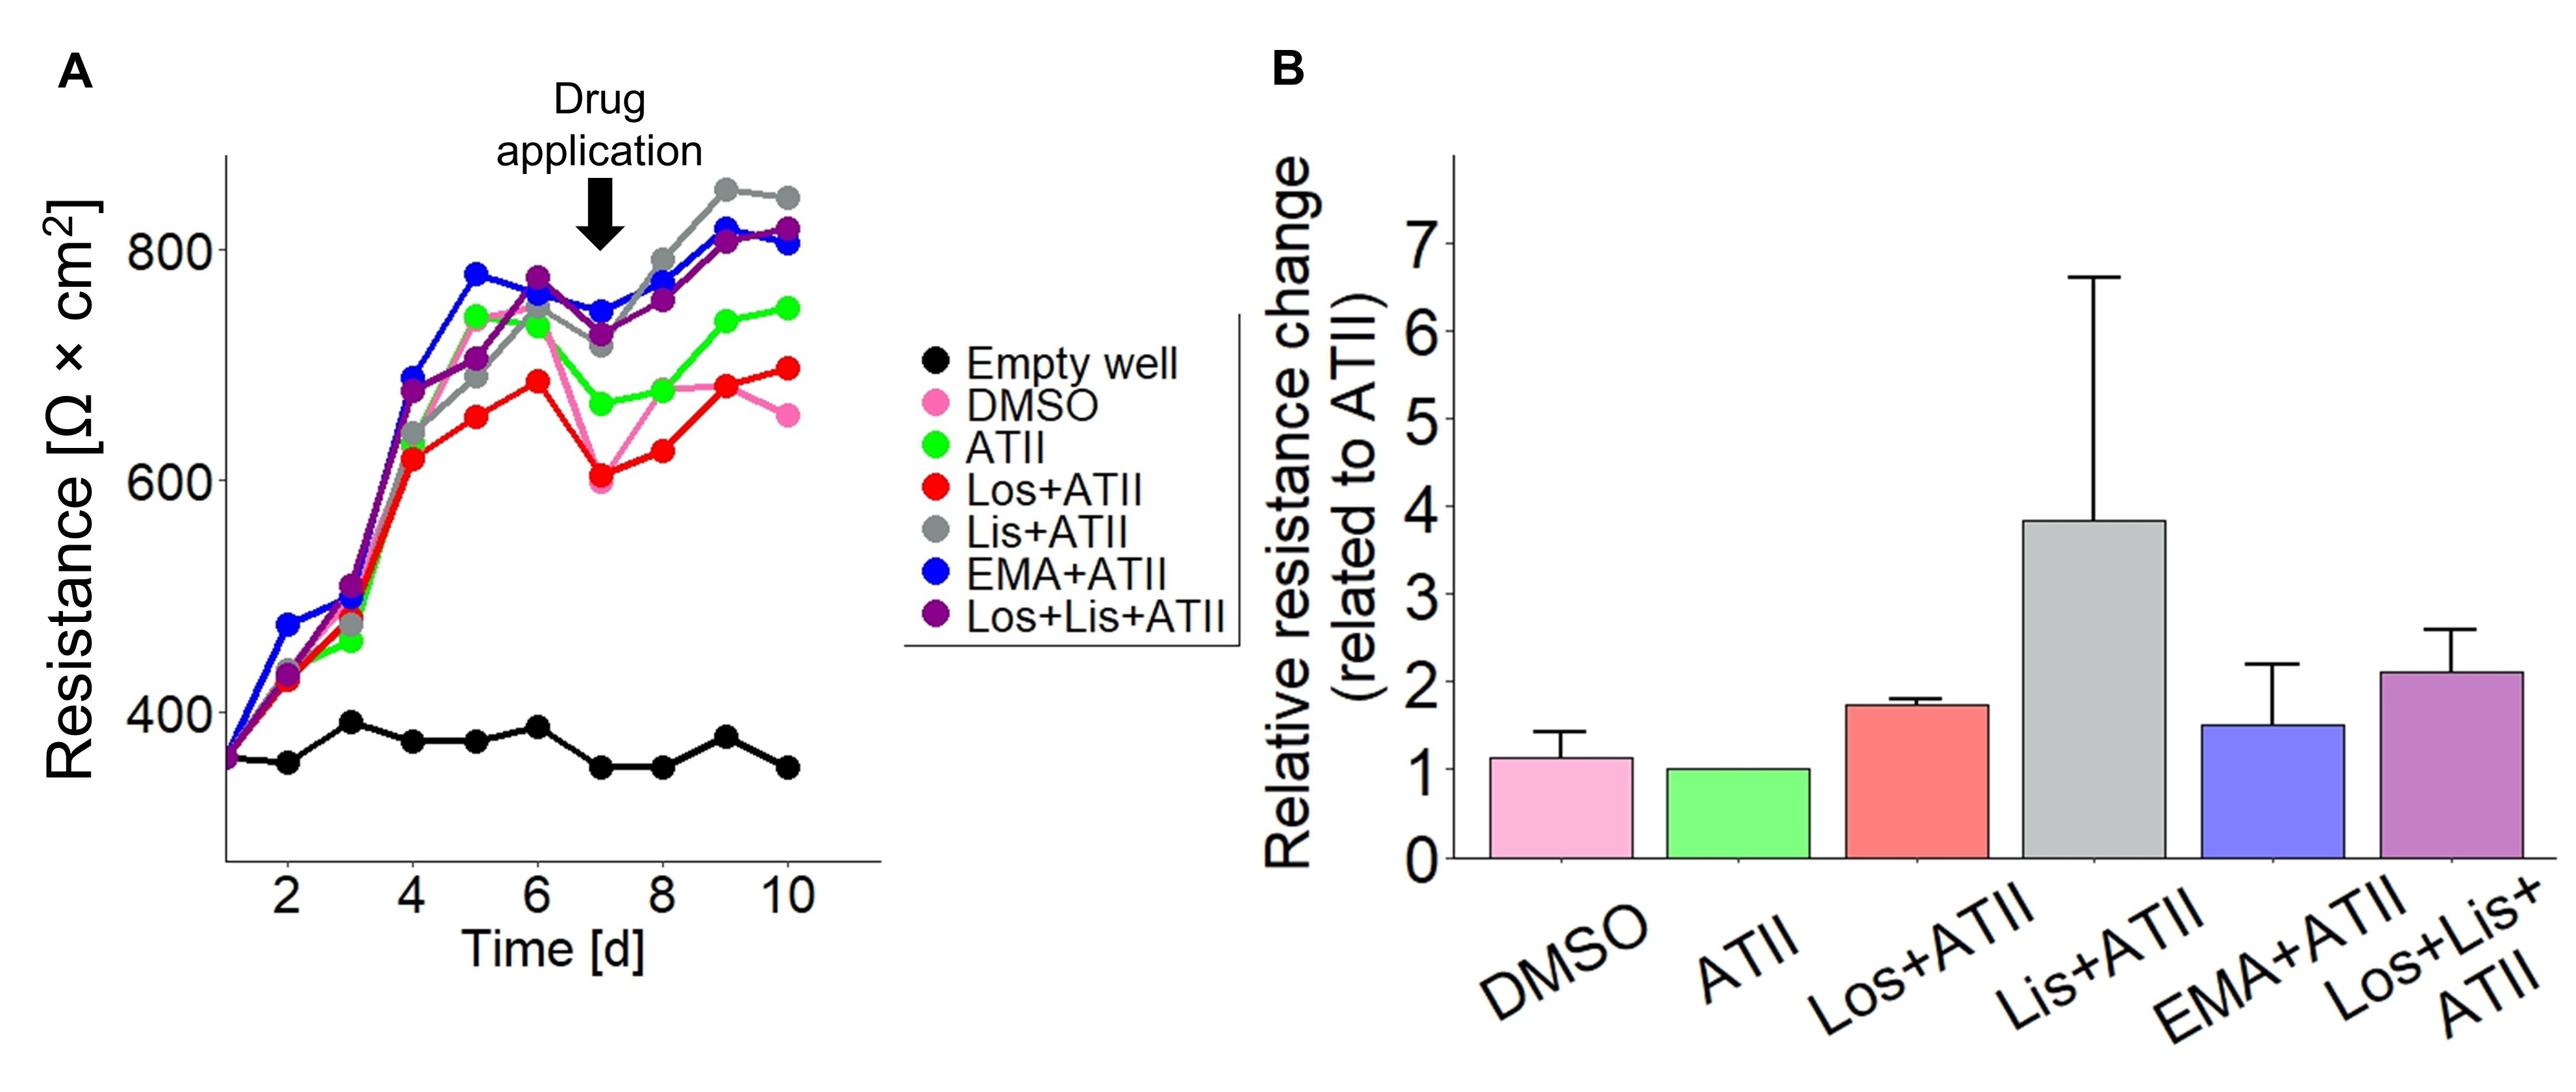
It seemed reasonable that the drugs might have facilitated MV3 cell invasion through a Huh7 cell-mediated mechanism because Huh7 cells also express targets for the applied RAAS-modulators (Fig. 1B). To examine the effect of the drugs on Huh7 cells, we performed transepithelial electrical resistance (TEER) measurements and monitored the integrity of the hepatocyte monolayer (Fig. 4). TEER of untreated Huh7 cell layers strongly increased within the first days after seeding before stagnating at a rather stable plateau of 600-800 W ⨯ cm2 on day 6 (Fig. 4A). This period matched the growth time of the Huh7 culture before the migration/invasion experiments were started by seeding the MV3 cells and administering the drugs. Therefore, day 7 was chosen to add ATII and the RAAS modulating drugs. 24 h after application of the substances TEER had increased in all samples to reach another steady state on days 9 and 10. The TEER increase tended to be stronger when RAAS modulators were added, compared to that induced by ATII or DMSO alone (Fig. 4B). Based on this observation we exclude that the RAAS modulators facilitated MV3 cell invasion by making the Huh7 cell layer more permeable.
Effects of RAAS modulators on MV3 cell transmigration across a collagen I-based matrix
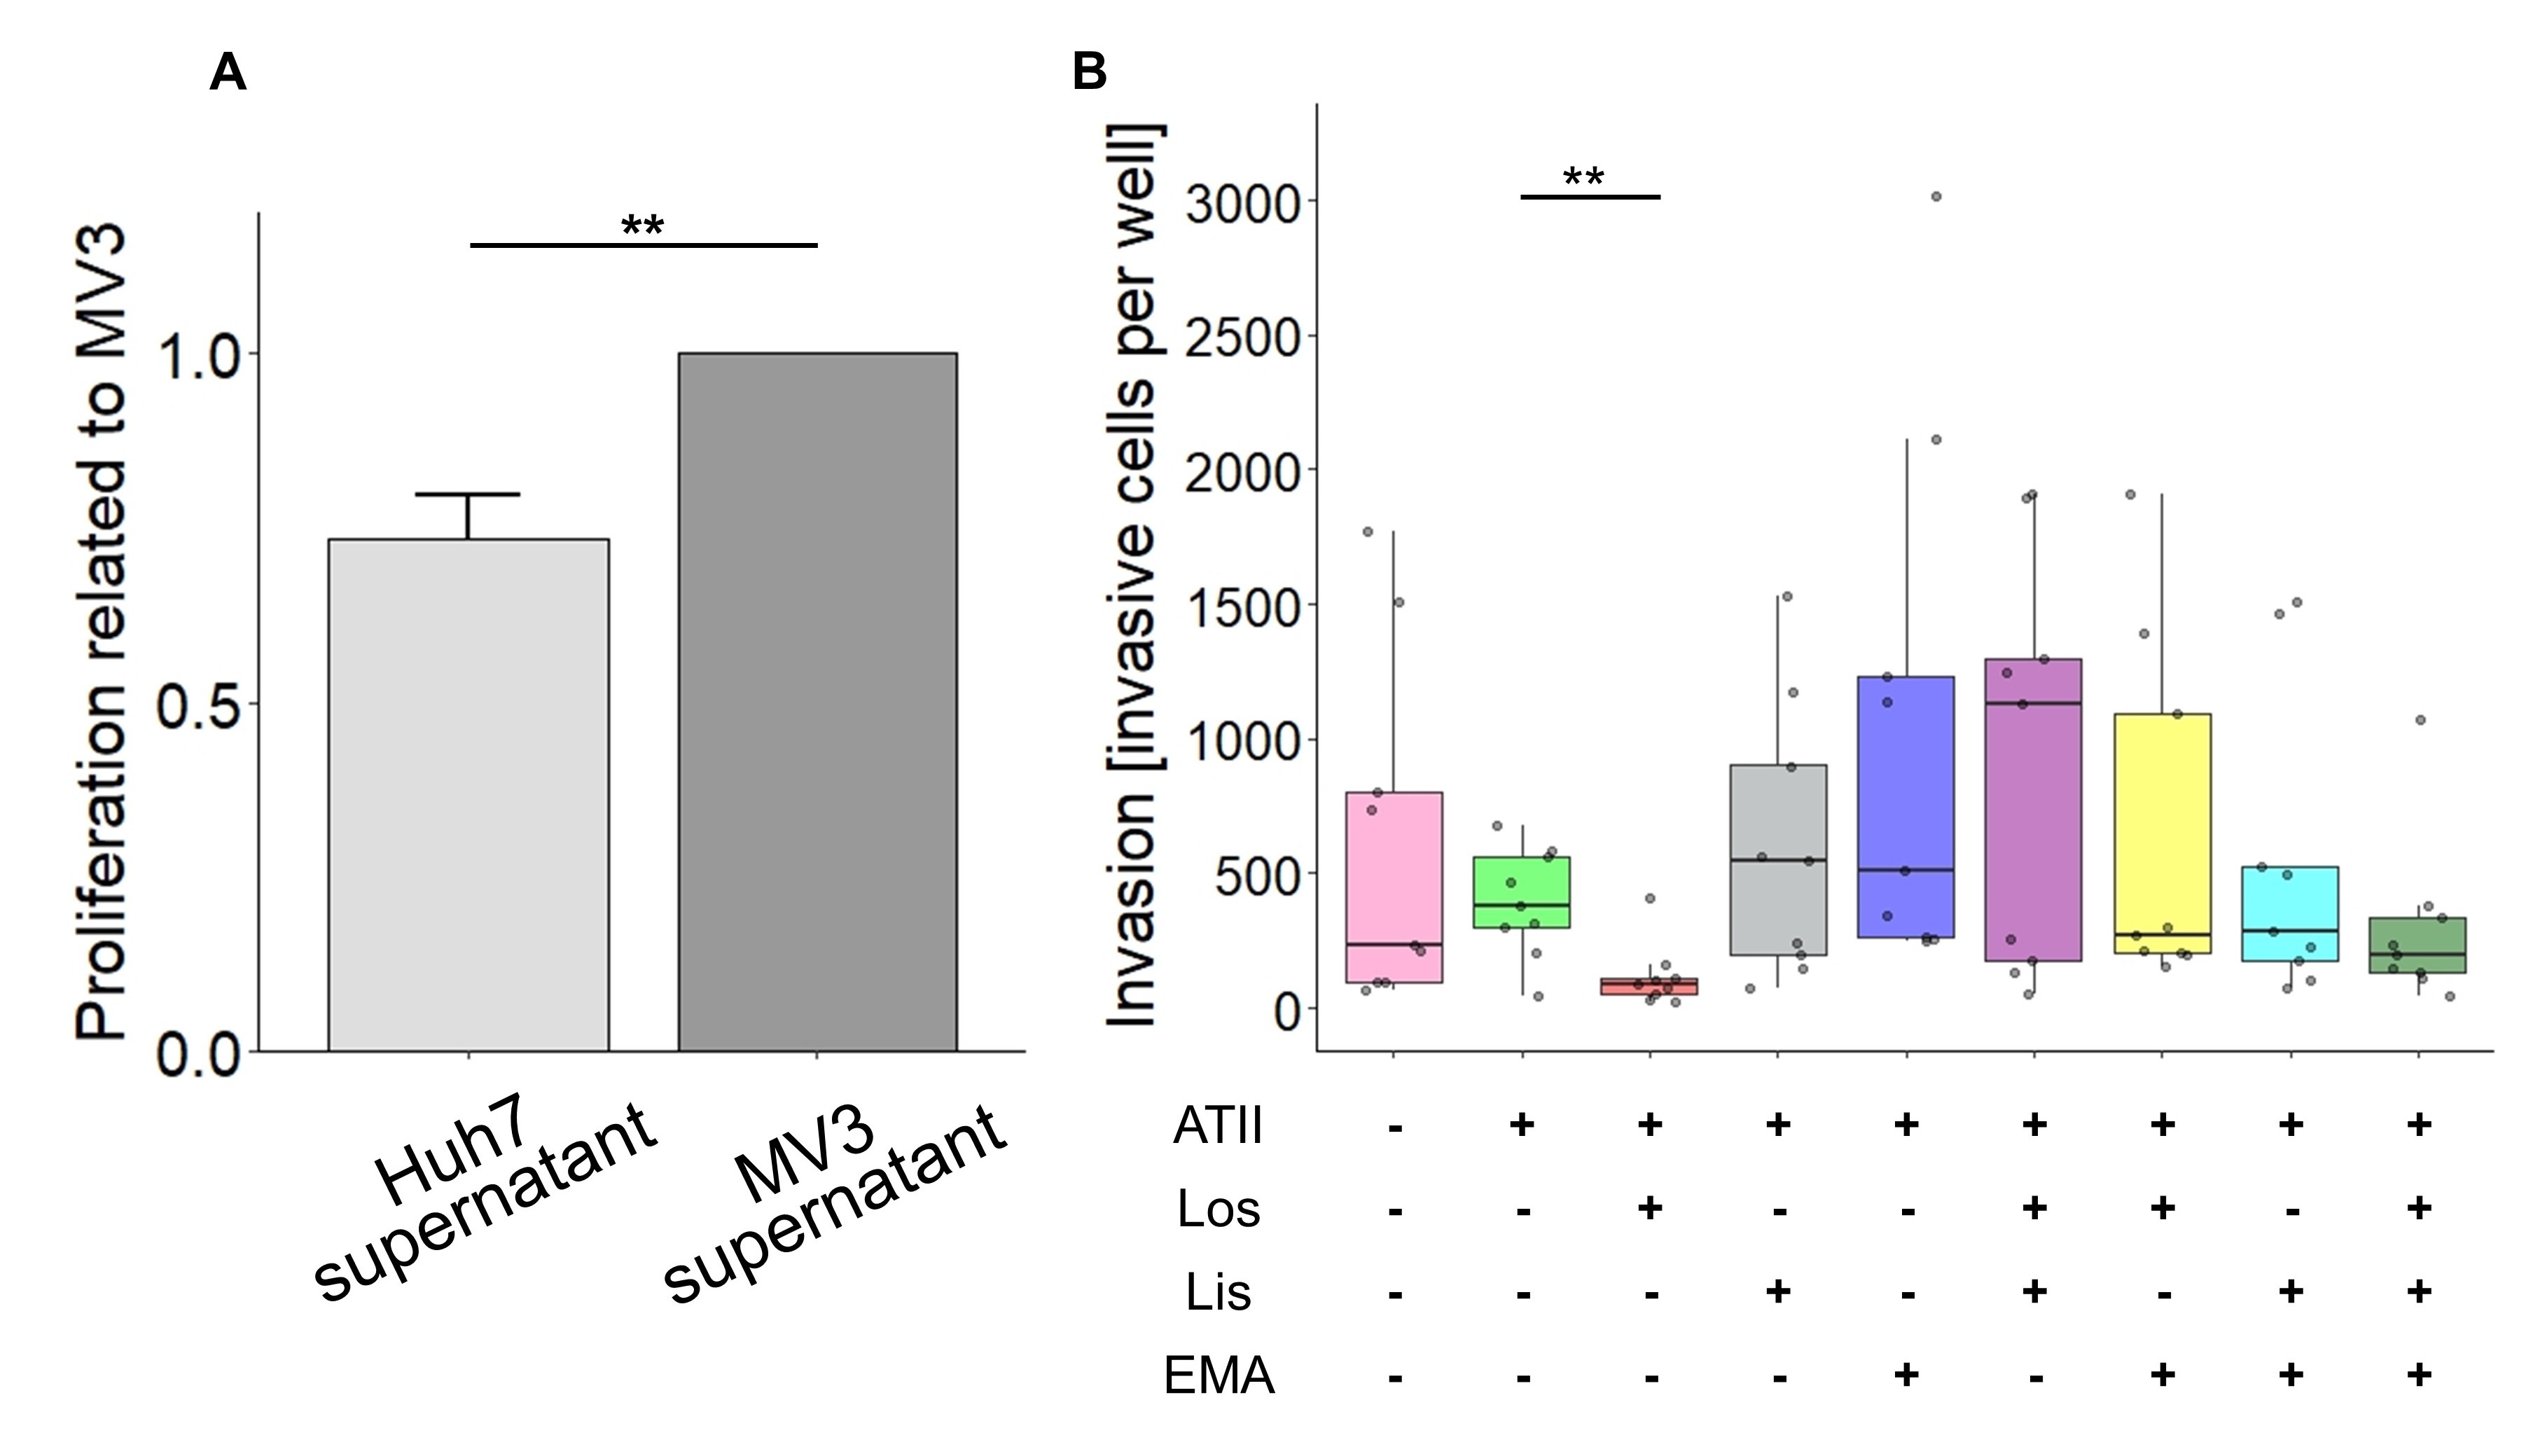
To elucidate further whether the RAAS modulator-induced, more invasive phenotype of MV3 cells also applies to a matrix-like substrate, Boyden chamber assays were employed. A chemogradient was created filling the lower compartment with conditioned medium obtained from Huh7 cell cultures. In order to exclude the possibility that excess proliferation during or after the process of invasion could be misinterpreted as an increase in invasiveness, the proliferative activity of MV3 cells exposed to Huh7-conditioned medium was determined (Fig. 5A). Compared to conditioned medium from MV3 cell cultures, Huh7-conditioned medium did not stimulate but reduced the proliferative activity. Interestingly, in contrast to the result from the coculture (Fig. 2), losartan decreased the invasive activity of MV3 cells (Fig. 5B). On the other hand, lisinopril, lisinopril in combination with losartan, and EMA401 tended to increase the invasive activity. Other combinations did not change MV3 cell invasiveness.
RAAS modulators leave MV3 cell proliferation and adhesion virtually unaffected
The proliferative activity of MV3 cells in response to ATII alone and combined with RAAS modulators did not reveal appreciable effects (Supplementary Fig. 1; for supplementary material see www.cellphysiolbiochem.com). MV3 cells proliferated efficiently in serum-containing medium and showed a slight tendency towards an increased proliferative activity in the presence of losartan (Supplementary Fig. S1A). To exclude the possibility of masking effects caused by the presence of growth factors and hormones in the FCS, we also checked the proliferation under serum depleted conditions. As the proliferation rate was strongly decreased in serum-free medium, the number of cells to be seeded had to be increased and the monitoring time doubled from 48 h to 96 h. No differences in the proliferative activity were observed under serum-depleted conditions (Supplementary Fig. S1B).
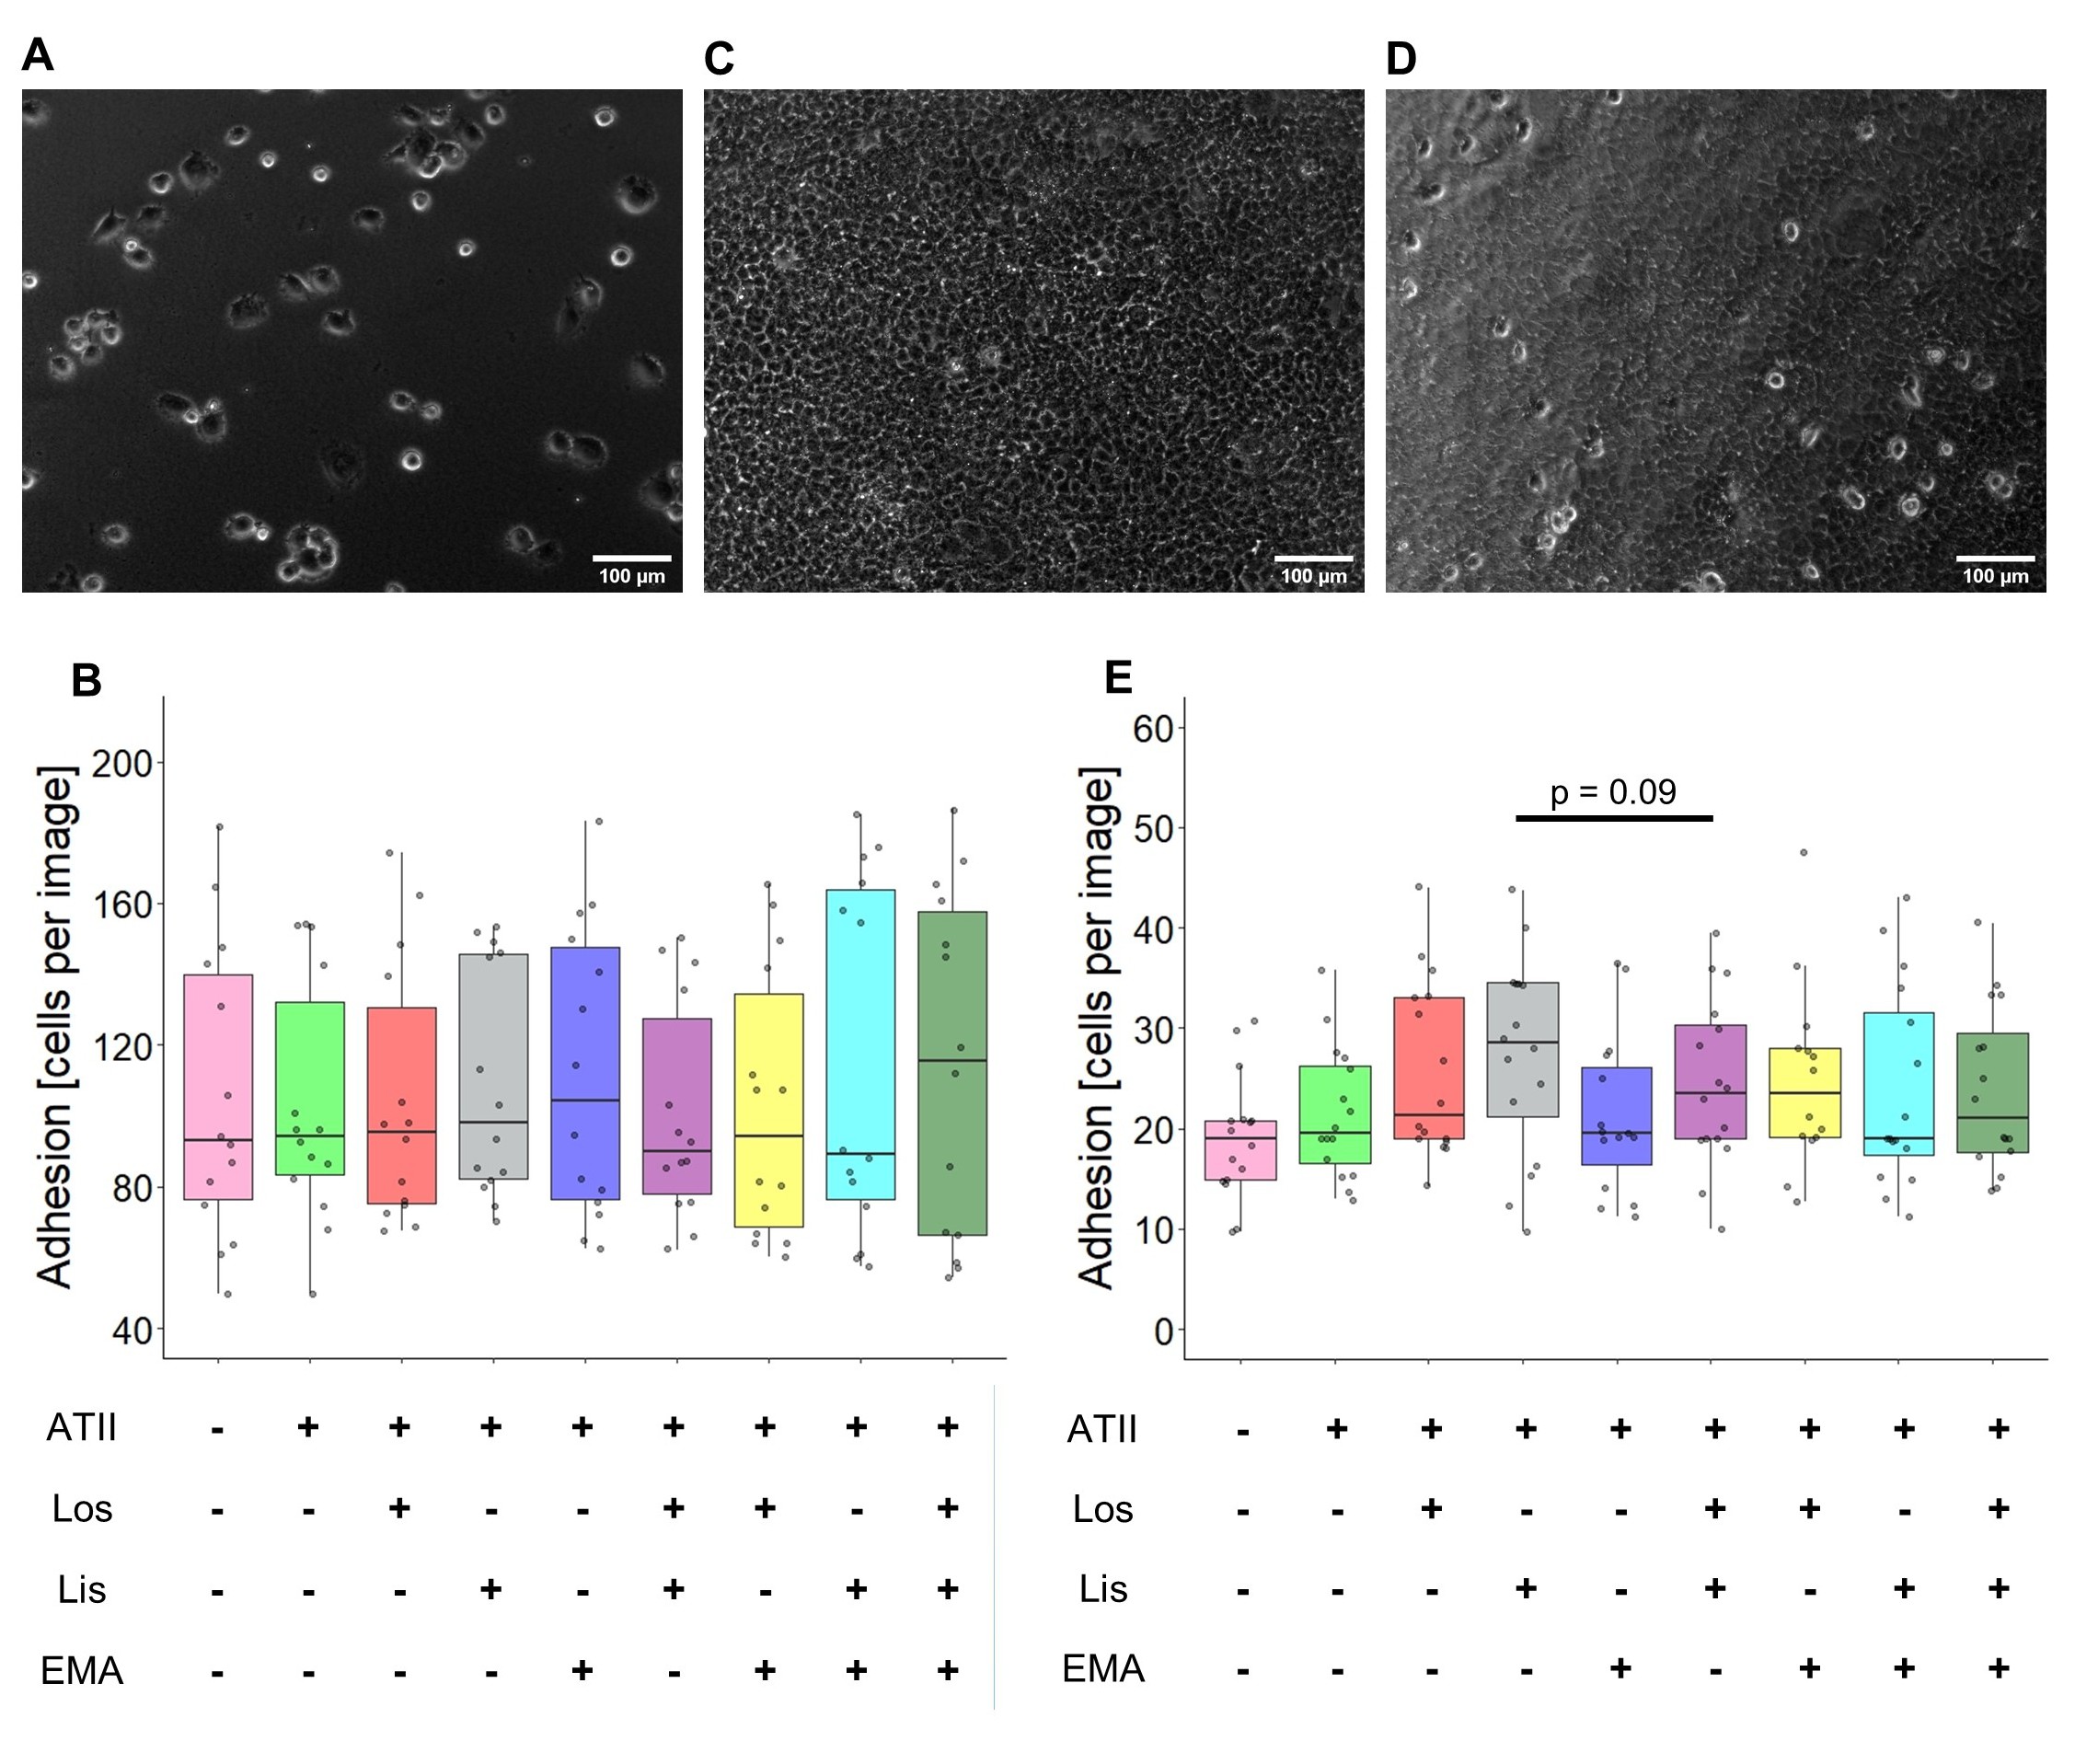
The adhesive properties of MV3 cells were examined on collagen type I-substrates identical to those used for the transmigration experiments (Boyden Chamber). RAAS modulators, in presence of ATII, had no effect on the adhesion to a collagen I-based matrix (Fig. 6A, B). To translate the adhesive properties from the reconstituted matrix into the coculture model, Huh7 cell layers were used as a substrate (Fig. 6C). A larger number of MV3 cells had to be seeded and the incubation time to be extended in order to obtain analyzable results (Fig. 6D). The spherical morphology of adhesive cells was identical with that observed in the coculture experiments (Fig. 2, upper panel), that is, cells were less spread and flattened when compared to those on the reconstituted collagen I-matrix. MV3 cells tended to be more adhesive in the presence of lisinopril/ATII or losartan/ATII than when exposed to ATII alone (Fig. 6E).
RAAS modulators impair NHE1-dependent pH i recovery
Since tumor cell migration and invasion generally correlate with an enhanced NHE1 activity, also in MV3 cells [46], we assumed that NHE1 would contribute to the increased invasive and migratory activity observed in the coculture. Expression analysis by qPCR confirmed once again the abundant expression of NHE1 in MV3 cells (Fig. 7A). NHE1 activity was measured as pHi recovery after an intracellular acidification in a HCO3--free environment. The fluorescence intensity of the pH sensitive dye BCECF was analyzed (Fig. 7B-D), and the slope observed after readding Na+ to the superfusion solution was defined as the pHi recovery rate (Fig. 7E-G). Compared to the DMSO-exposed control cells (mean = 0.081 ΔpH min-1), those superfused with ATII (and DMSO) showed a significantly higher pHi recovery (0.121 ΔpH min-1). Contrary to what we had anticipated, additional treatment with either losartan (0.082 ΔpH min-1), lisinopril (0.096 ΔpH min-1) or EMA401 alone (0.095 ΔpH min-1), or with losartan together with lisinopril (0.057 ΔpH min-1) all lowered the recovery rate to or below the original level obtained with DMSO alone (Fig. 7H).
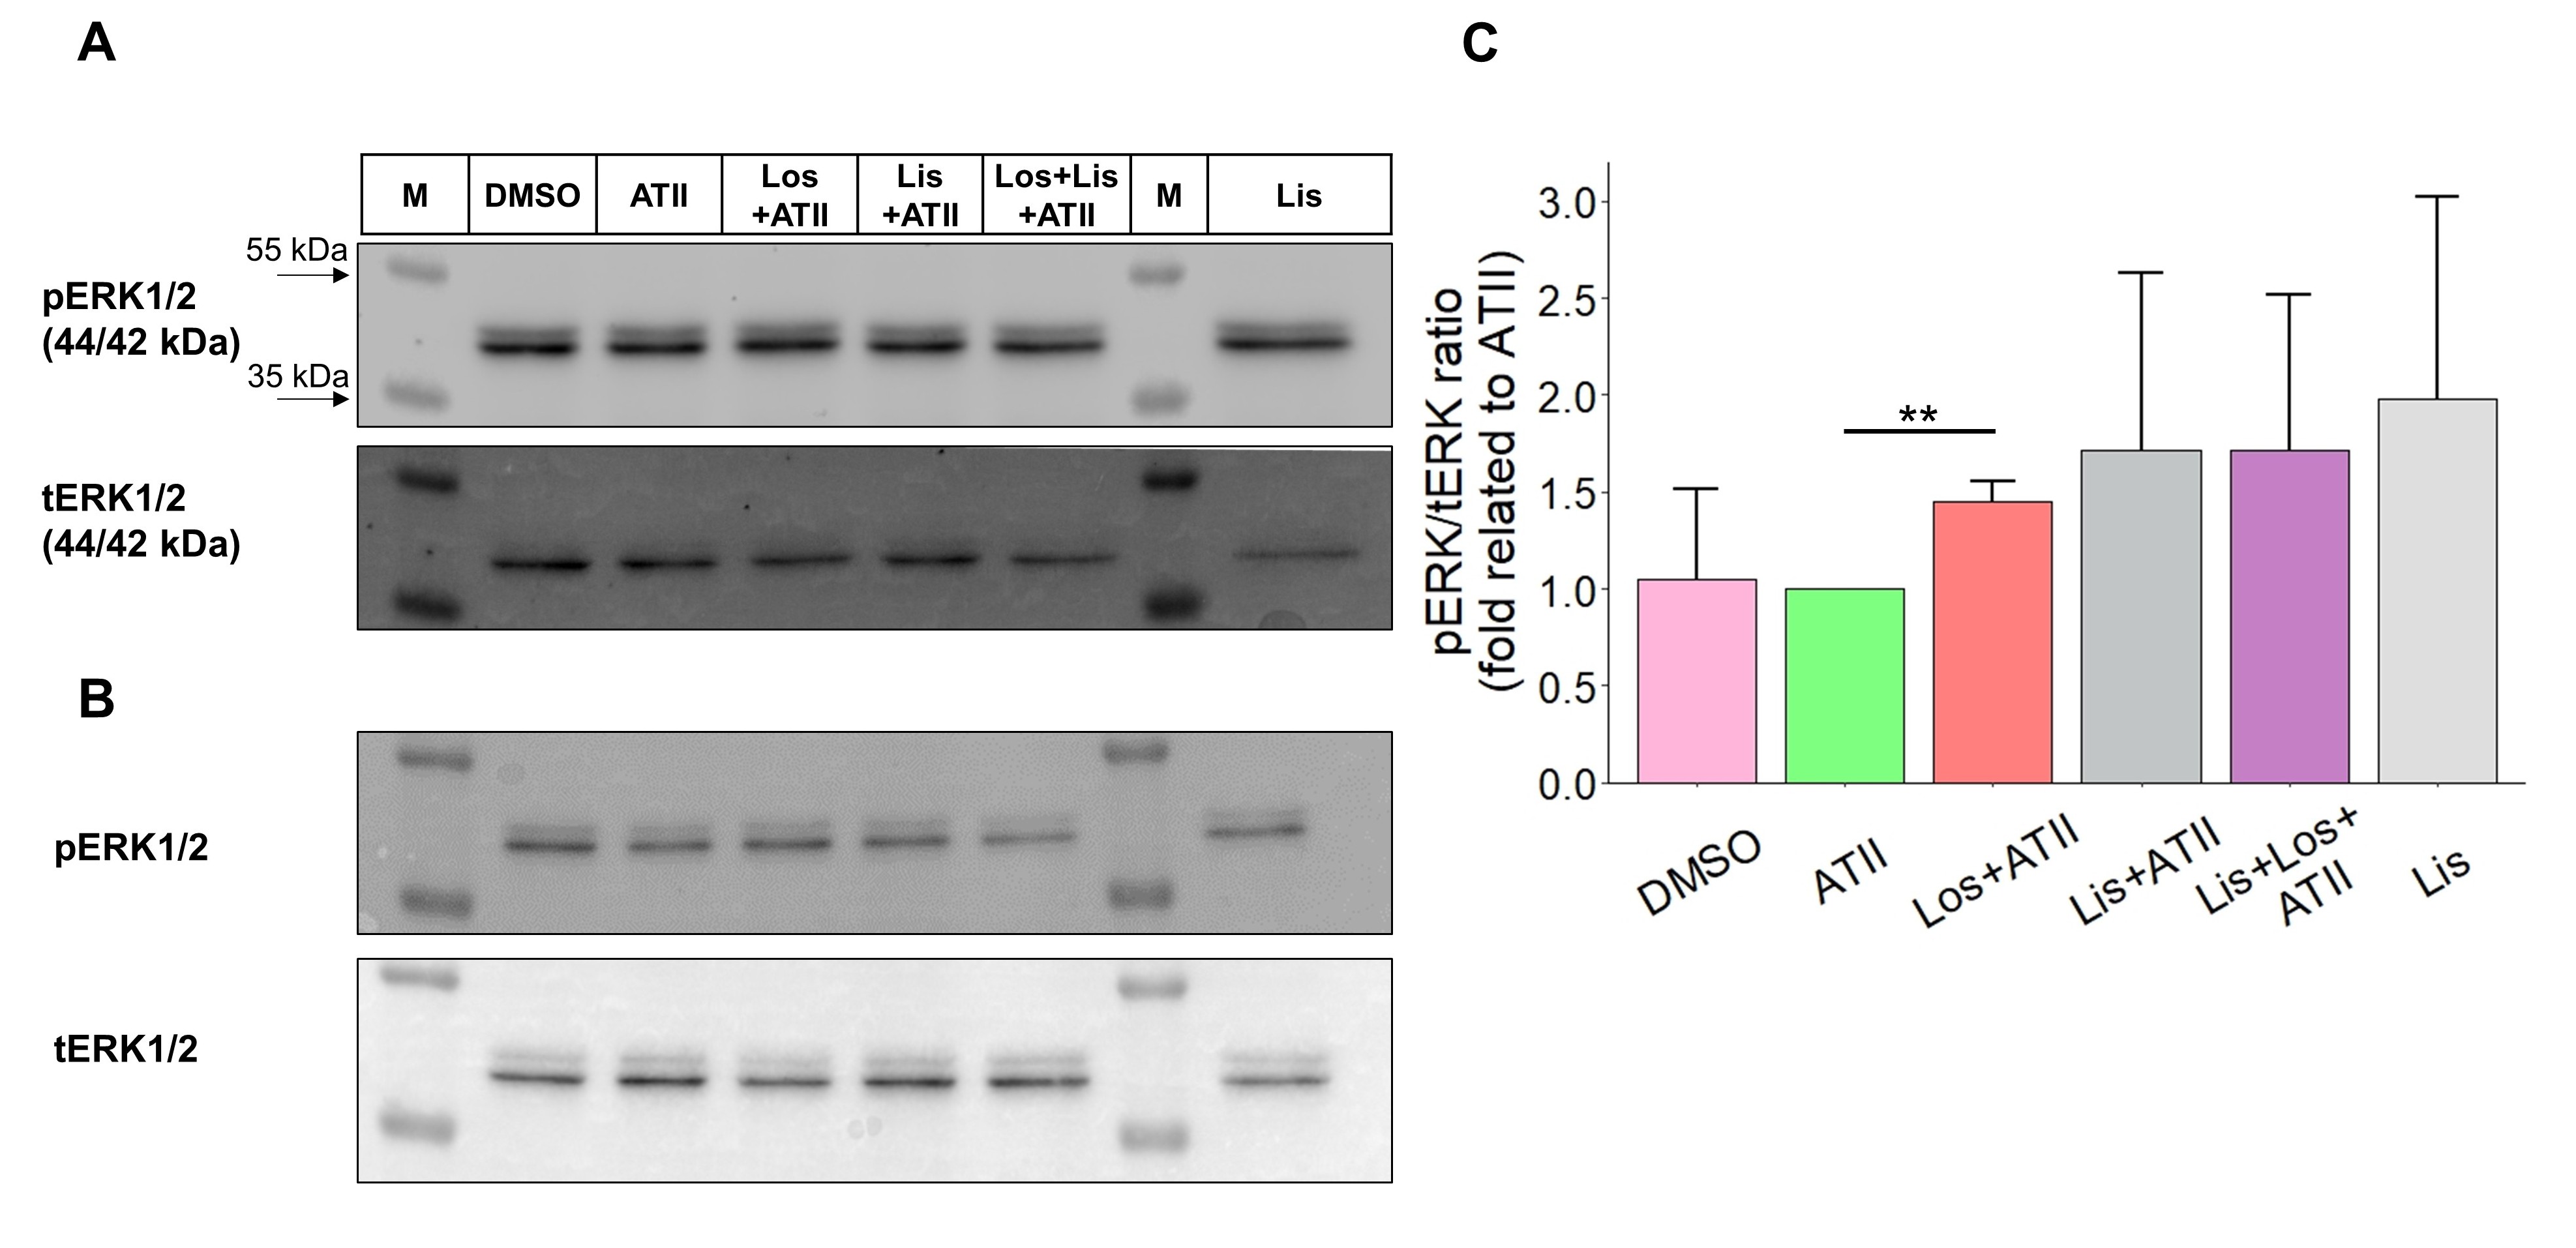
RAAS modulators alter the phosphorylation of ERK1/2 and induce COX2 and MMP2 gene expression
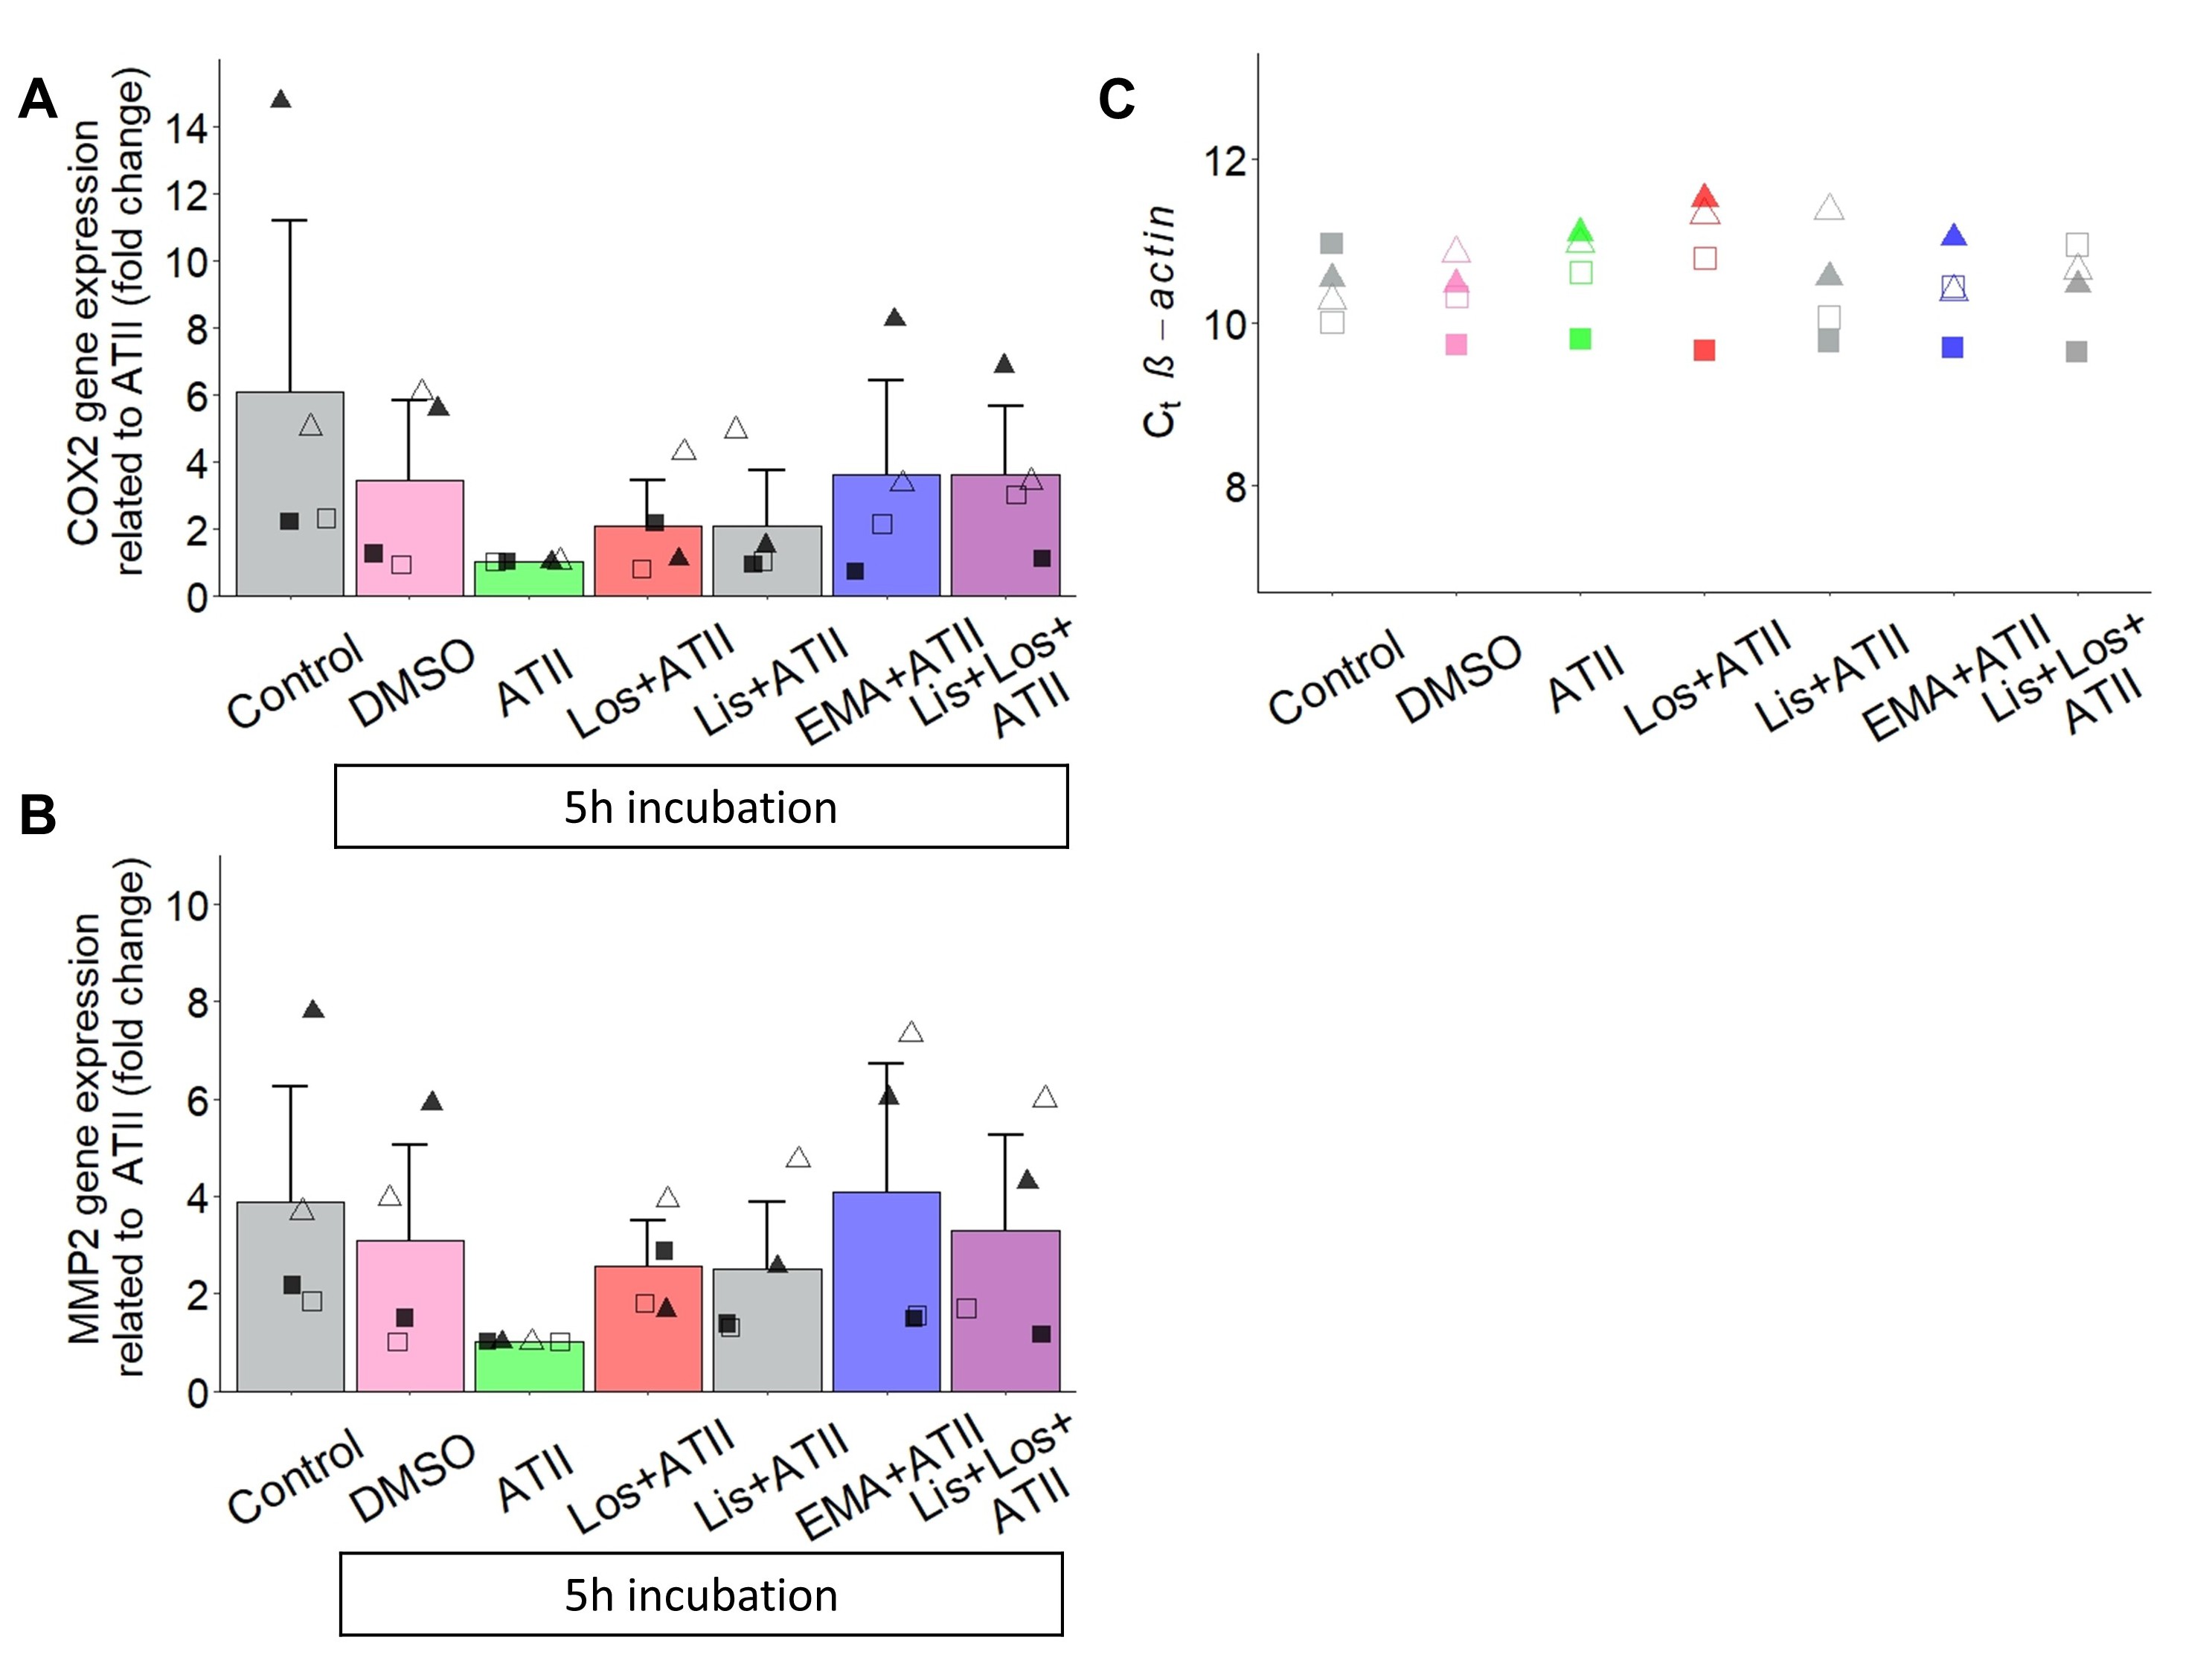
As the extracellular signal-regulated kinase 1/2 (ERK1/2) has been shown to be involved in the signaling cascades mediated by AT1R [47], AT2R [48], and ACE [27], we measured the short-term phosphorylation status of ERK1/2 after 10 minutes of drug administration (Fig. 8). Compared to a 10 min exposure to ATII alone, exposure to losartan in the presence of ATII led to a significant increase in the p(hosphorylated)ERK/t(otal)ERK ratio by about 50%. Notwithstanding that the pERK/tERK ratios from cells treated with lisinopril or with lisinopril and losartan, both in the presence of ATII, were rather heterogeneous, they show the same trend, namely a clear increase (Fig. 8C). For the reason that ACE inhibitors have been reported to induce signaling cascades via ACE itself [25], MV3 cells were treated with Lisinopril alone, i.e. in the absence of ATII, which seemed to further increase the pERK/tERK ratio (Fig. 8C). Based on the observation that RAAS-modulators tend to shift the pERK/tERK ratio and thus the intracellular phosphorylation profile of MV3 cells, long-term signal transduction is likely and could be the reason for the increased invasion of MV3 cells in the coculture approach. On this account, we determined the expression of the pro-invasive genes encoding for MMP2, MMP9 and COX2 in MV3 cells exposed to RAAS-modulators for 5 hours (Fig. 9). Defining as the reference condition the exposure to ATII alone, the addition of the different RAAS-modulators as well as the total absence of both ATII and RAAS-modulating drugs resulted in an increased expression of COX2 and MMP2 at mRNA level. MMP9 was hardly detected or remained even completely undetected during the amplification (data not shown) indicating that it is very weakly, if at all, expressed. GAPDH and ACTB (β-actin) were tested for expression stability across the different experimental conditions, and due to a quite stable Ct value throughout the single experiments, β-actin was chosen to serve as the housekeeping gene (Fig. 9C).
Lisinopril stimulates MMP2-dependent MV3 cell invasion
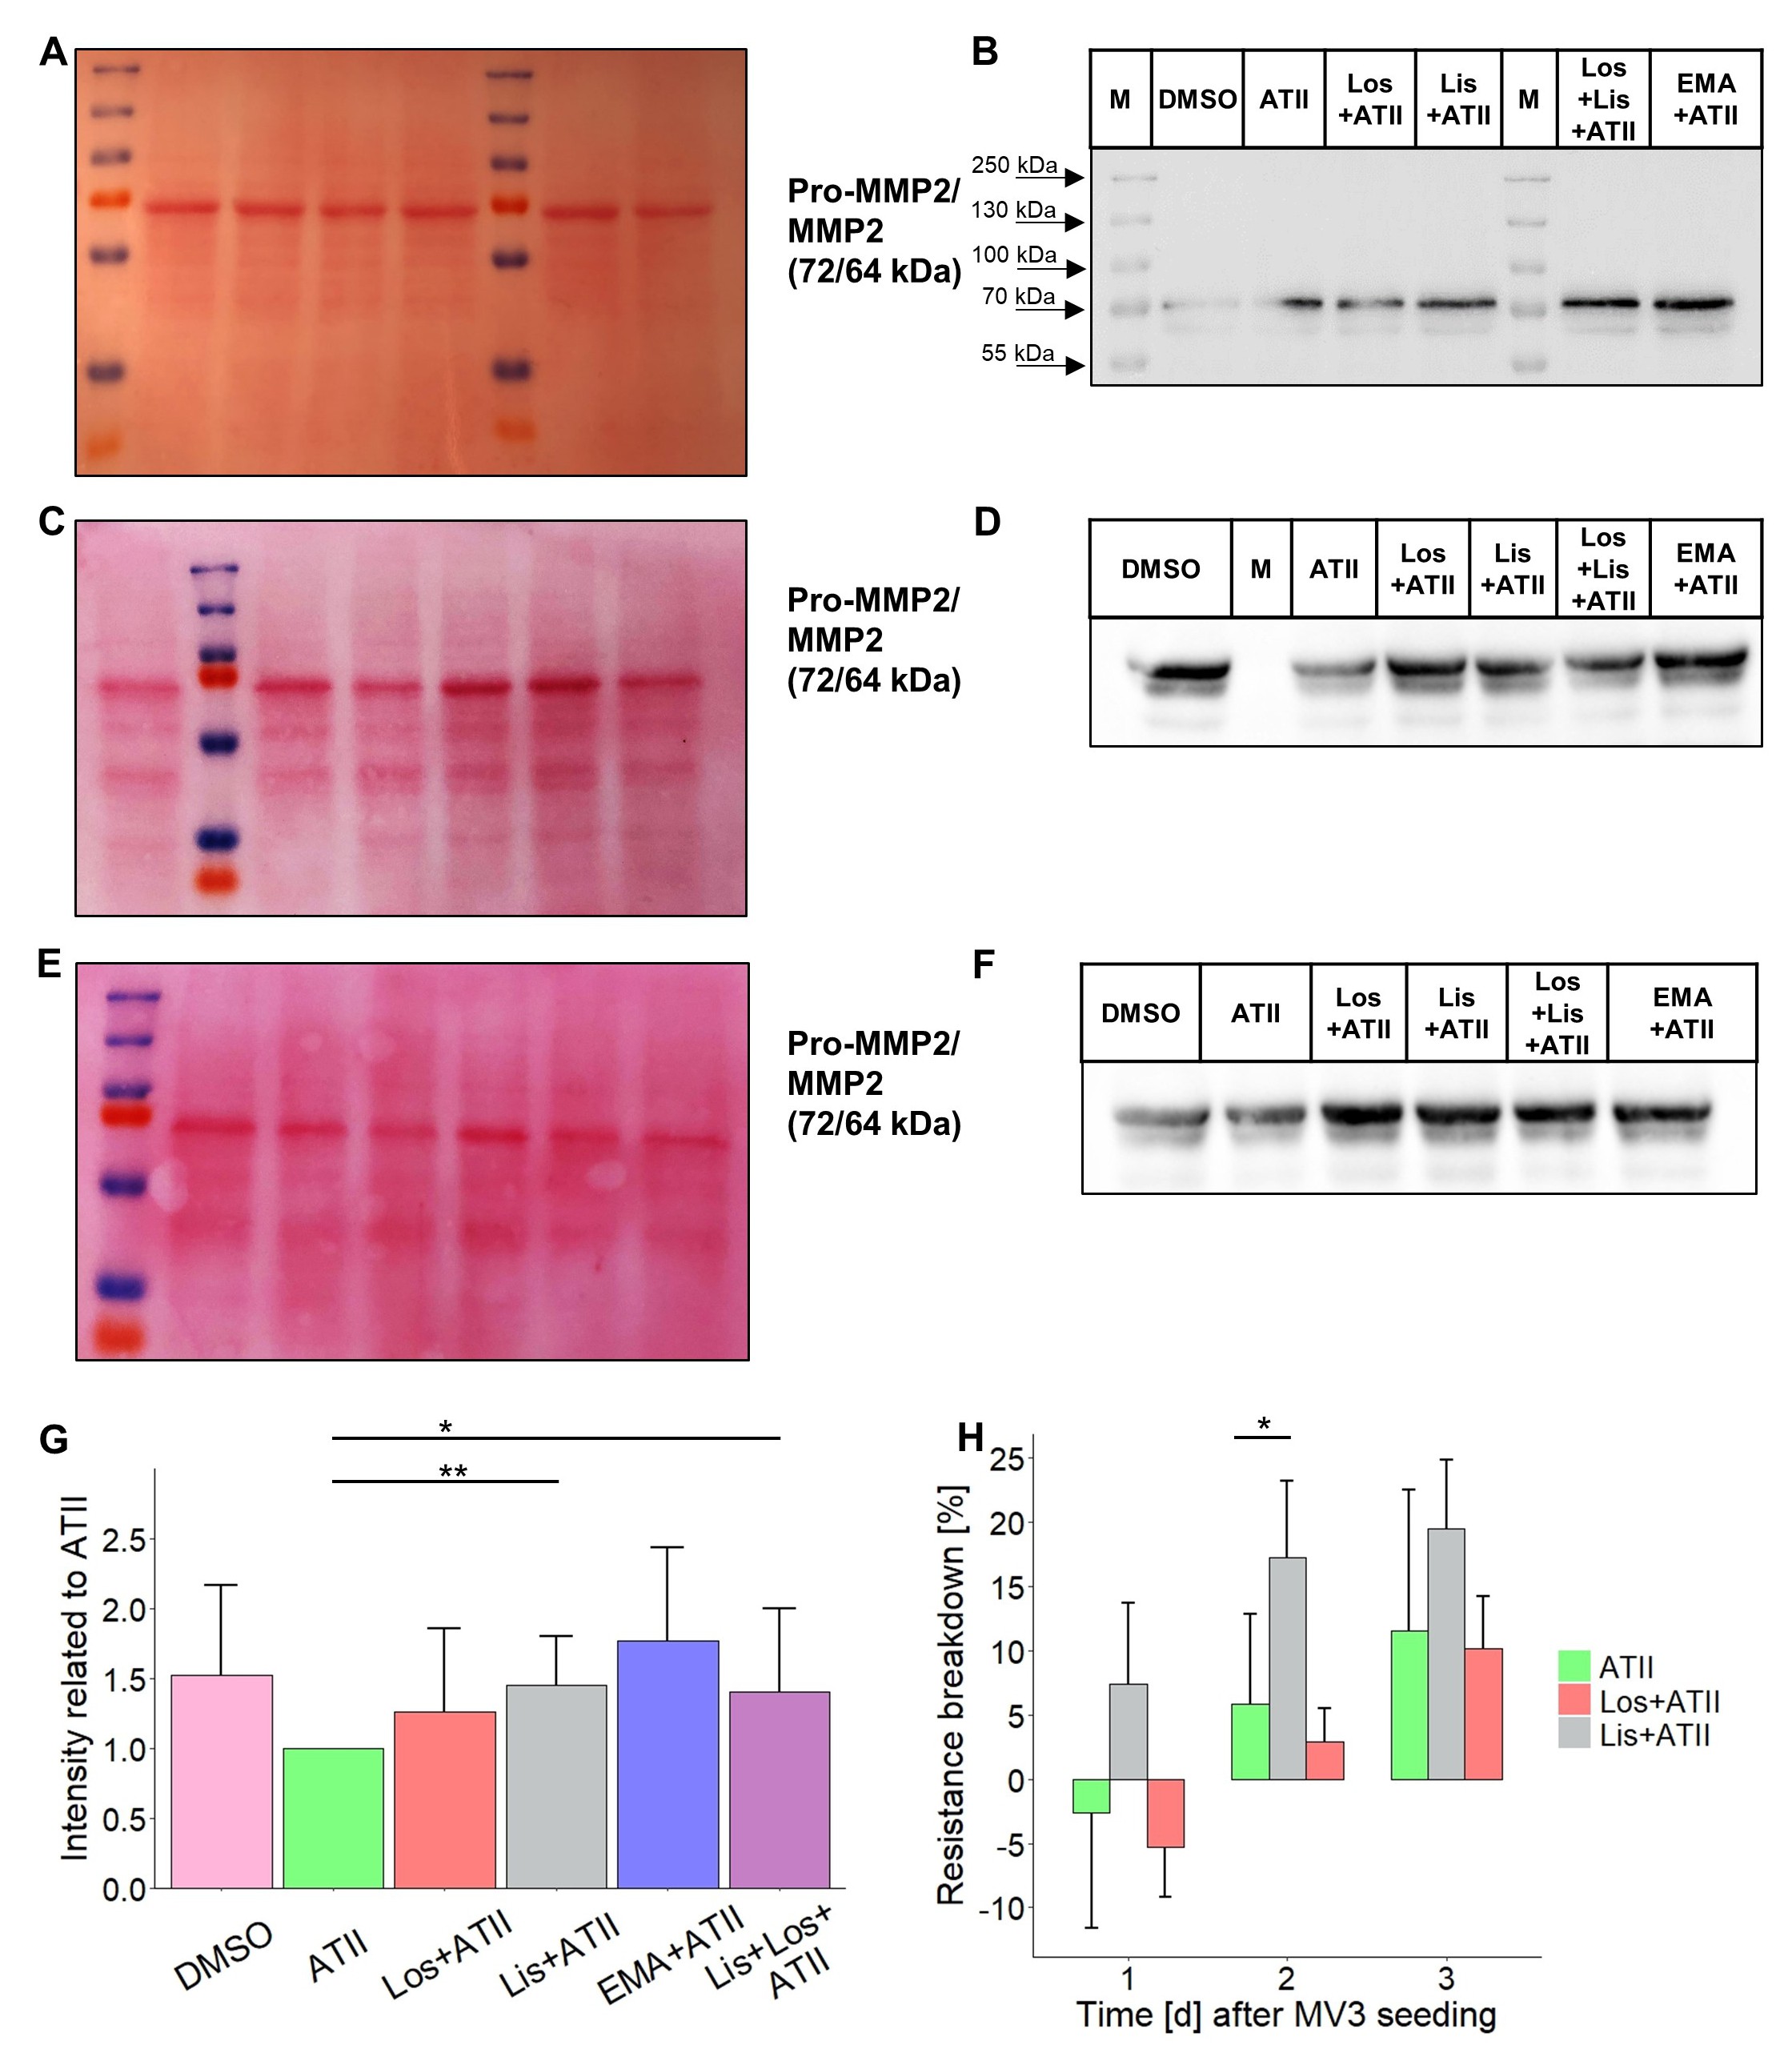
As the gene expression analyses indicated elevated MMP2 mRNA levels in the presence of RAAS-modulators, we examined the secretion of MMP2 protein after a 24 h exposure to losartan, lisinopril or EMA401 in the presence of ATII (and DMSO). Supernatants of MV3 cell cultures were, for the most part, equally enriched with secreted proteins as shown by Ponceau staining of the PVDF membrane after protein transfer (Fig. 10A, C, E). Western blot analyses for MMP2 uncovered two bands: a stronger one at 72 kDa and a weaker one at 64 kDa, representing pro-MMP2 and MMP2, respectively (Fig. 10B, D, F). Densitometric analysis of the two bands revealed an increase in secreted MMP2 by ~50% when cells were exposed to lisinopril alone or to lisinopril and losartan (Fig. 10G). Cells exposed to DMSO alone or treated with EMA401 also secreted higher amounts of MMP2, however, not to a statistically significant extent (Fig. 10G). The supernatants were tested also for secreted MMP9. As already suggested by the qPCR results, no specific bands at 92 kDa (pro-MMP9) or 84 kDa (MMP9) could be detected by Western blot analyses (data not shown).
To check whether soluble factors released by MV3 cells, such as MMP2, affect the integrity of a confluent hepatocyte layer, we monitored TEER after colonizing a confluent Huh7 cell layer with MV3 cells. To this end, Huh7 cells were grown on the lower side of the filter membrane until reaching a TEER of about 600-650 W ⨯ cm2. MV3 cells were then seeded on the filter membrane’s upper side in the presence of ATII and RAAS-modulators. Although the two cell lines had no physical contact due to the separation by the filter membrane, MV3 cells damaged the integrity of the Huh7 cell layer resulting in reduced TEER values within a few days. After the first 24 hours, there was no marked decline in TEER, except for a slight one in response to lisinopril. However, treatment with lisinopril for two days led to a significant TEER reduction by ~17% whereas application of ATII alone or losartan (and ATII) during the same period did not cause such a decrease in TEER compared to that prior to MV3 seeding (Fig. 10H). Nevertheless, within the following days MV3 cells produced a strong decline in TEER, which after about seven days reached the values from empty well controls, i.e. pure, unsettled filter membranes (data not shown).
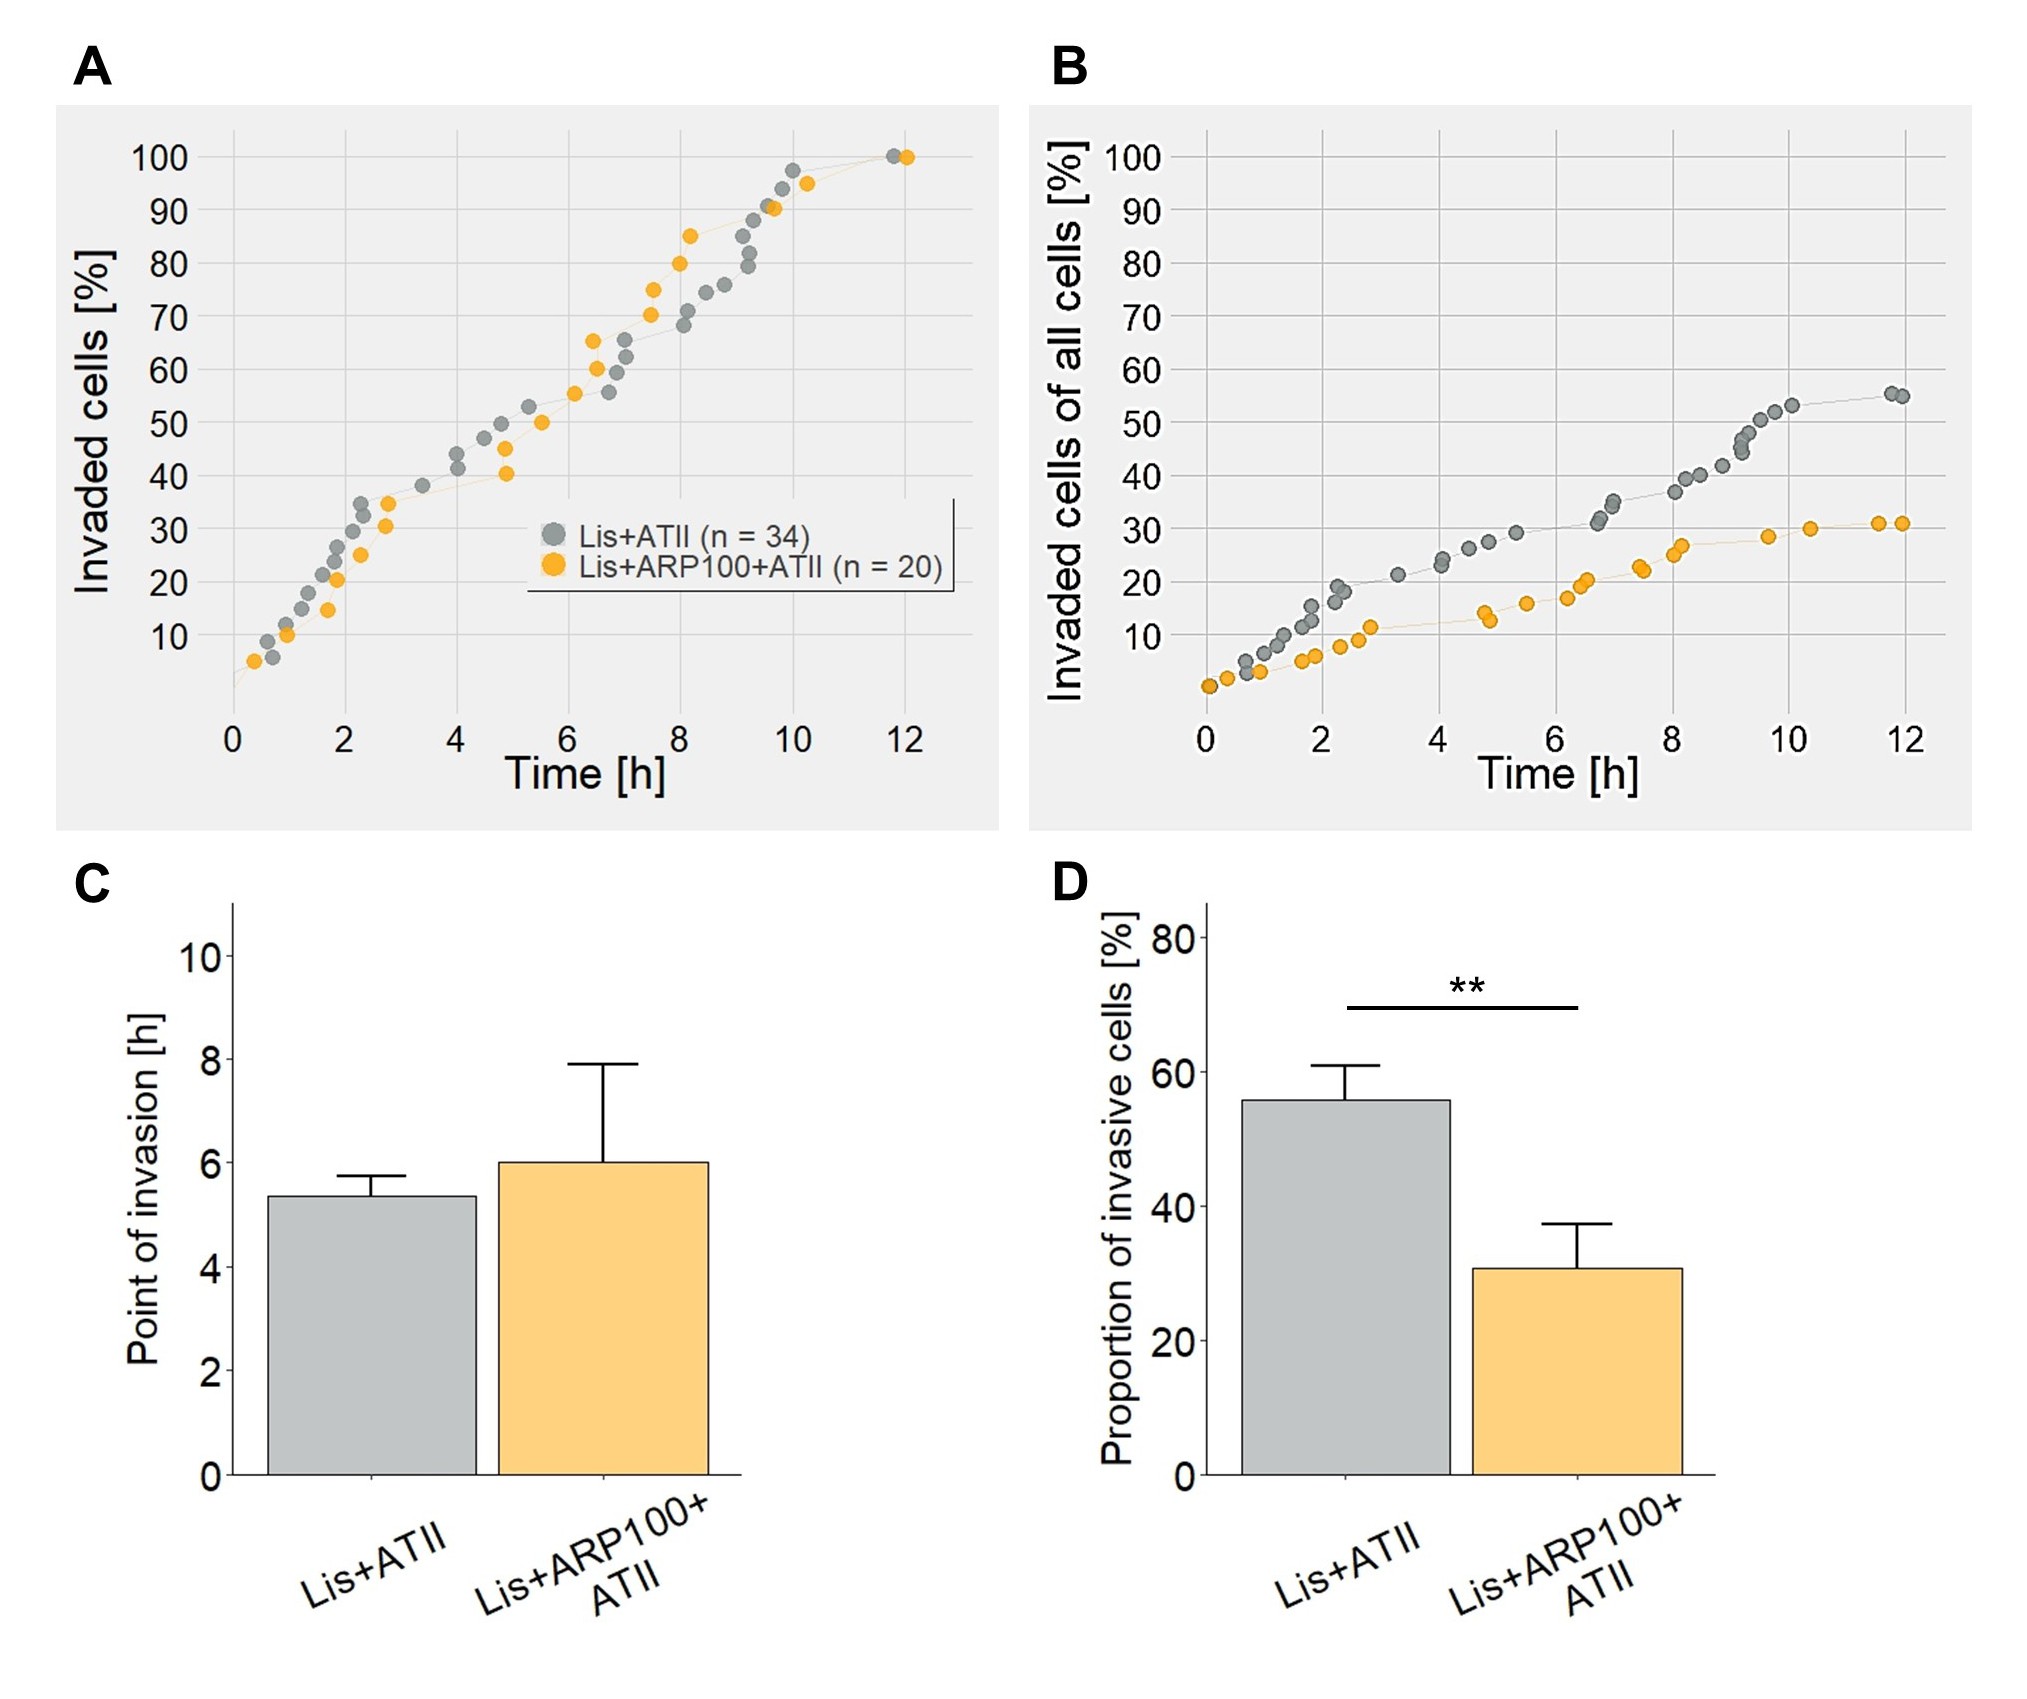
The finding that lisinopril (i) induces MMP2 secretion and (ii) significantly expedites TEER breakdown prompted us to perform another set of coculture experiments. Again, MV3 cells were placed on a confluent, tight monolayer of Huh7 hepatocytes and exposed to either lisinopril alone or to lisinopril together with the MMP2 inhibitor ARP-100, each in the presence of ATII. While the time course of invasion did not differ, ARP-100 did cause a significant decrease in the number of invasive MV3 cells by ~45% (Fig. 11).
Lisinopril modulates MV3 cell behavior
The present study demonstrates that exposure to the three RAAS-modulating drugs losartan, EMA401 and lisinopril causes increases in MV3 melanoma cell migration and invasion in a coculture model with hepatic Huh7 cells (Fig. 2, 3). When detected as the increase in the proportion of invasive cells and compared to the basal level of invasive activity observed in untreated cells, the extent to which the three drugs induce invasiveness is quite similar, regardless of whether AT1R, AT2R or ACE are affected. This similarity in the degree of the three drugs’ impact is mostly in line with their effects on the signal transduction cascades: (i) losartan and/or lisinopril induce an immediate phosphorylation of ERK1/2 (Fig. 8), (ii) losartan, EMA401 and lisinopril cause an increase in COX2 and MMP2 expression when compared to the exposure to ATII alone (Fig. 9), and (iii) MMP2 secretion rises accordingly (Fig. 10). Throughout the different experimental approaches, lisinopril has the most consistent effects on the various parameters ranging from invasion of the hepatocyte layer to ERK1/2 phosphorylation to MMP2 secretion. This strongly indicates that there is, indeed, ACE-signaling in MV3 cells. ACEI-induced signaling has already been shown for ramipril [25], enalapril [49], lisinopril [50], and captopril [27] in artificial CHO cell systems and/or endothelial cells, but to the best of our knowledge, not in malignant cells.
Lisinopril-treated cells do not show a significant increase in MMP2 expression when compared to DMSO- and ATII-free control conditions or to DMSO alone but solely when compared to the low MMP2 expression seen in the presence of physiological ATII concentrations (Fig. 9B, 10). This observation prompts us to speculate that lisinopril may abrogate an ATII-mediated inhibitory effect on the expression and secretion of MMP2, possibly via a displacement reaction at the ACE, implying that ATII itself could have an anti-metastatic effect. In a similar way, the low expression of COX2 in the presence of ATII alone (Fig. 9A) may point to an anti-inflammatory character of ATII.
ACE contributes to ERK1/2 activation in MV3 cells
It is generally accepted that ATII-stimulated AT1R induces growth-stimulatory signals via ERK1/2 in the cardiovascular system, eventually leading to cardiac hypertrophy and fibrosis [51], while AT2R-mediated activation of tyrosine phosphatases can antagonize AT1R-mediated ERK1/2 activation [52]. Having these mechanisms in mind, including the activation of ERK1/2 by inhibition of ACE [27] and the confirmed expression of AT1R, AT2R and ACE in MV3 cells (Fig. 1), it seemed appropriate to investigate the activation of ERK1/2 by selectively inhibiting components of RAAS. The present study shows that (i) treatment with lisinopril alone under ATII-free conditions tends to increase ERK1/2 phosphorylation, (ii) ERK1/2 activation is rather low in cells exposed to ATII alone, although ATII is supposed to stimulate ERK1/2 phosphorylation via the AT1R, and iii) combined application of lisinopril and losartan in the presence of ATII increases the phospho-ERK fraction (Fig. 8). These findings strongly imply that inhibition of ACE induces ERK1/2 activation.
This ACE-induced ERK-activation is likely to depend on JNK, because JNK1 is able to activate ERK [53] and is itself activated by ACE signaling [54]. Moreover, ATII itself, in the absence of ACEIs, can induce signal transduction via ACE resulting in JNK activation [50], which would allow ERK1/2 activation mediated by ACE, yet independently of its inhibition. The present finding that ERK1/2 phosphorylation is higher in the presence of ATII and losartan than in the presence of ATII alone suggests that AT1R impedes the activation of ERK1/2 in MV3 cells. This assumption finds support in the observation that inhibition or the absence of AT1R in melanoma cell lines promotes cell proliferation [55], a process often driven by phosphorylated ERK.
Losartan inhibits Ca2+ mobilization in MV3 cells [36]. In AT1R-deficient Tm5 mouse melanoma cells endogenously expressing ACE, ATII stimulates both the mobilization of Ca2+ and the production of reactive oxygen species. Losartan (in the presence of ATII) can completely abolish this Ca2+ mobilization [28]. The authors speculate that losartan, due to its molecular similarity to ACEIs such as lisinopril, may antagonize ATII-stimulated ACE signaling. Blood samples of hypertensive patients treated with losartan show increased bradykinin levels and a reduced ATII/ATI ratio, implying that losartan does reduce ACE-mediated metabolic processing of bradykinin and ATI [56]. Hence, losartan is likely to directly or indirectly modify ACE-activity and consequently would have a hand in ACE-mediated signaling, which would explain the observed similar effects of lisinopril and losartan on ERK1/2 activation in MV3 cells. Dissecting the individual contributions of the single receptors to the activation of ERK1/2 is quite difficult in the system used in the present study. However, given the fact that losartan and lisinopril cause a clear increase in phosphorylated ERK1/2, a certainly possible, AT2R-mediated inhibitory effect of phosphatases on ERK1/2 stimulation seems negligible or may not even occur in MV3 cells. Since losartan inhibits AT1R, ACE remains as the mediator of ERK1/2 activation. Overall, our data imply that in MV3 cells in the presence of ATII, lisinopril and losartan reinforce the activation of ERK1/2 and presumably JNK as well.
ERK1/2 activity as a potential rescue for NHE1 activity at low [Ca 2+ ] i ?
Compared to the DMSO control, ATII alone stimulates NHE1 activity whereas when coapplied with the different RAAS-modulating drugs leaves it unaffected at the basal level (Fig. 7). These data are partially in line with a previous study that also shows a stimulatory effect of ATII on NHE1 in MV3 cells, but compared to the completely untreated and DMSO-free control, a losartan-induced decrease in NHE1 activity below the basal level in the presence of ATII [36]. On the other hand, in MDCK cells, losartan returns ATII-stimulated NHE1 activity to the basal level without further reducing it [57], which is consistent with the results obtained in the present study.
The stimulatory effect of ATII on NHE1 is based on an elevated cytosolic Ca2+ level ([Ca2+]i) leading to the formation of Ca2+/CaM complexes which then bind to the regulatory C-terminus of NHE1 to promote its activity [58]. In order to stabilize NHE1 activity, the inhibitory effect of losartan on Ca2+ mobilization [36] may be compensated for by the increase in phospo-ERK1/2 induced by losartan and lisinopril (Fig. 8). Six amino acids of NHE1’s C-terminus can be phosphorylated by ERK1/2 [59], and their phosphorylation activates NHE1 activity under certain conditions such as sustained acidosis [60, 61]. Hence, RAAS-modulators seem unable to hamper NHE1 activity to such an extent that it would impair its known pro-invasive participation [46]. The NHE1 activity measured in the presence of RAAS-modulators corresponds to that found in studies performed without ATII and is high enough to acidify the nanoenvironment of MV3 cells [62] promoting protease-mediated ECM degradation [63]. NHE1 regulates the activity of MT-MMP1 [64], which is also expressed in MV3 cells [65]. MT-MMP1 is the main activator of MMP2 [66]. Since lisinopril and losartan, while attenuating ATII-stimulated NHE1 activity, (i) stimulate MV3 cell invasion of a hepatocyte layer (Fig. 2), (ii) increase expression and secretion of MMP2 (Fig. 9, 10), and (iii) lisinopril decreases TEER (Fig. 10H), we conclude that the remaining NHE1 activity is still sufficient to promote MMP2-mediated invasiveness.
Does COX2 contribute to MV3 cell invasiveness?
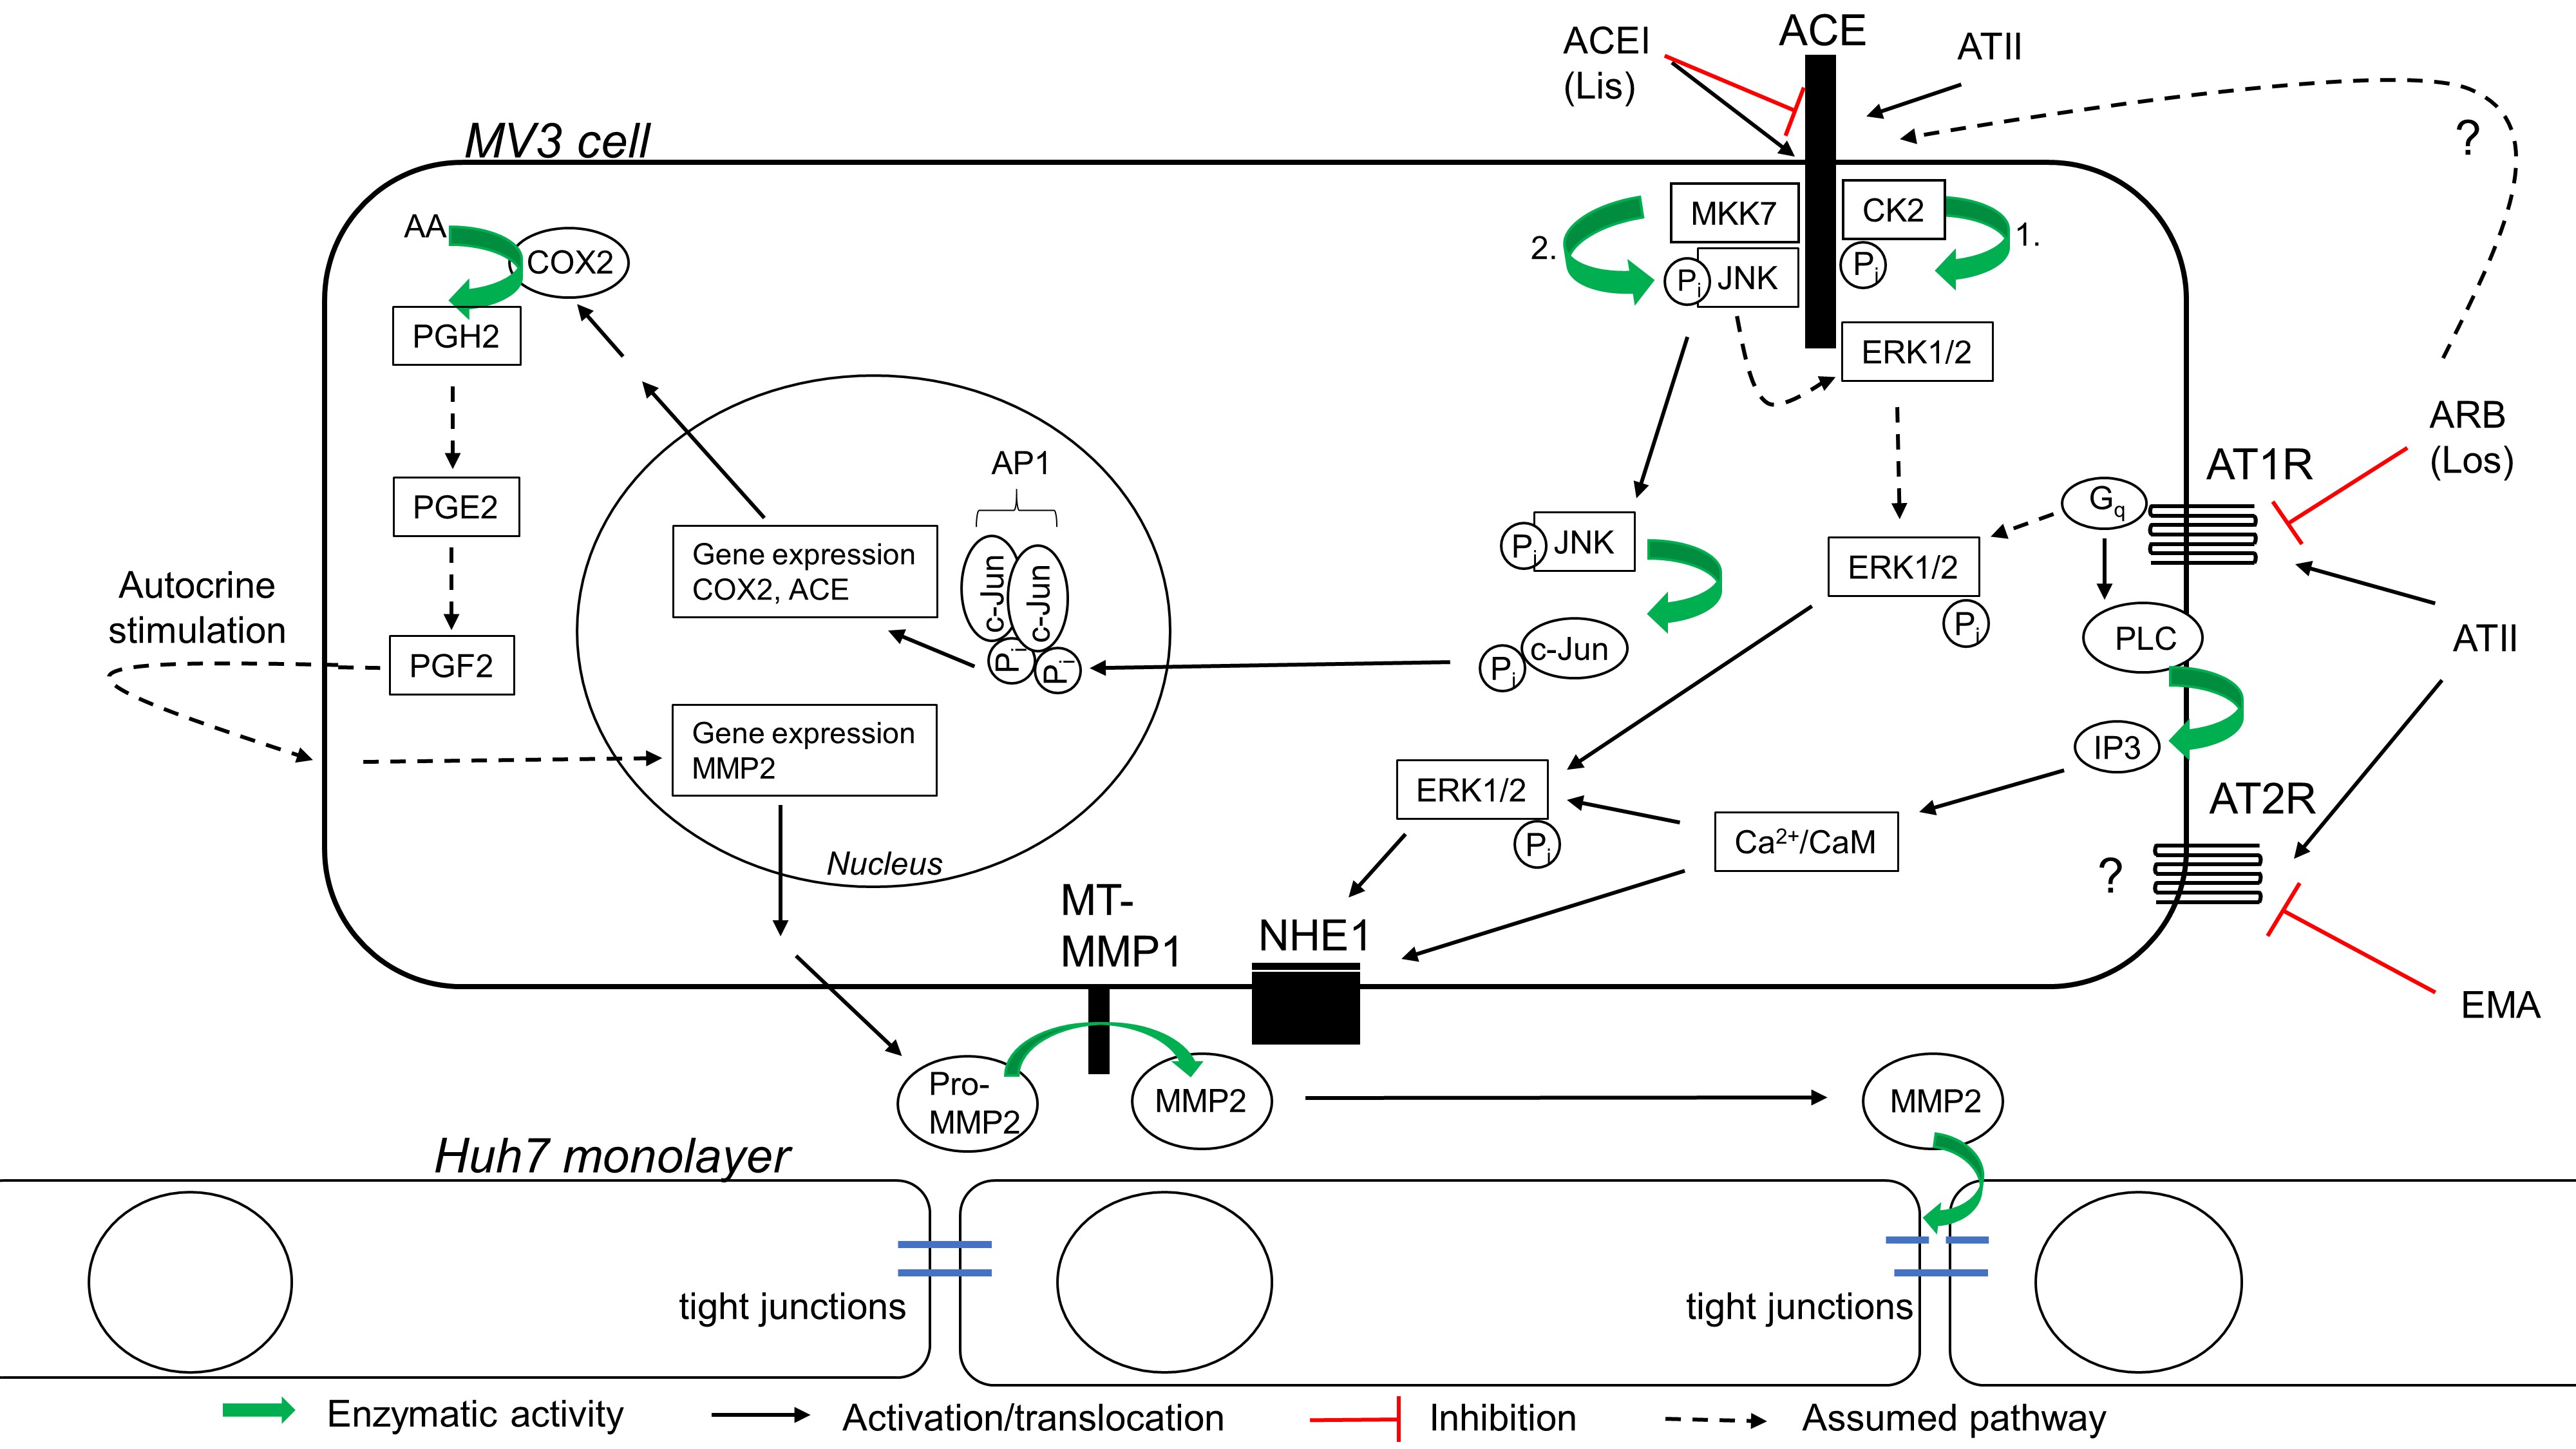
COX2 is the inducible isoform of the two cyclooxygenases. It catalyzes the rate-limiting step in the conversion of arachidonic acid to prostaglandins. Inhibition of ACE stimulates COX2 expression in human umbilical vein endothelial cells (HUVEC) and murine pulmonary vasculature [26]. Besides, the endogenous ACE substrates ATI and bradykinin increase COX2 expression in mice [50]. In transfected CHO cells, by contrast, the ACEI captopril leads to a decrease in COX2 expression [27], and the results obtained from MV3 cells in the present study show that the presence of ATII restricts the expression of COX2. Accordingly, the absence of ATII comes along with an increase in relative COX2 expression (Fig. 9). This makes it difficult to attribute the elevated COX2 expression levels observed in the presence of both ATII and RAAS-modulating drugs to either a drug-mediated suppression of ATII signaling, for example by a displacement reaction, or to (an) alternative, drug-activated signaling pathway(s). Again, these results led us to conclude that an interplay of more than one receptor controls COX2 expression. The proposed mechanism by which ACEIs may trigger COX2 expression is a homodimerization of the JNK-dependent c-Jun in the nucleus (Fig. 12), i.e. the formation of the functional activator-protein 1 (AP1) which acts as a transcription factor [26]. The connection between ACEIs and increased COX2 expression is further strengthened by the discovery of elevated levels of prostaglandin I2 (PGI2), a product of COX2 activity, in ACEI-treated patients [67]. At this point, an additional mechanism contributing to the increase in COX2 expression cannot be excluded.
COX2 is expressed in both primary melanomas and metastatic lesions, and its expression correlates with pathological progression such as metastasis and a decreased progression-free survival [68, 69]. Recent studies suggest a role of COX2 in immune evasion and thus in the resistance to immunotherapy in advanced melanoma [70, 71]. In addition, selective COX2 inhibition results in a decreased invasiveness in a number of human melanoma cell lines as examined by a Matrigel-based invasion assay [68, 72]. In vivo experiments in mice reinforce this role of COX2 by showing that murine melanoma cells (B16-F10) form less lung metastases when the cells are treated with the COX2 inhibitor indomethacin prior to injection. Intriguingly, this effect can be antagonized by supplementing the culture media of the cells with PGF2α, a downstream product of COX2, before injection [73]. These data support the idea that an increased COX2 expression may contribute to the increased invasiveness of MV3 cells in the coculture and partially also in the matrix-based invasion assays (Fig. 2, 5). Quantifications of not only the COX2 protein itself but also the amount of COX2 products generated in the presence of RAAS-modulators are required to further confirm the momentousness of COX2 in MV3 cell invasion.
Does COX induce MMP2 expression in MV3 cells?
The expression levels of COX2 and MMP2 are concordant with each other across all tested conditions (Fig. 9), which gives reason to speculate about an interconnected regulation. In fact, the above-mentioned pro-invasive capabilities of COX2 in melanoma have already been attributed to MMP2. In B16-F10 cells, inhibition of COX2 reduces MMP2 expression, which can be restored by additional exposure to PGF2α [73]. Moreover, COX2 inhibition with celecoxib results in decreased MMP2 and MMP9 protein levels in human and murine melanoma cells, and in mice treated with celecoxib, the number of melanoma-derived lung metastasis is considerably reduced [74]. The underlying mechanism by which COX2 induces MMP2 expression is not clear. While the invasiveness of human melanoma cell lines could not be restored by adding extra PGE2 after COX2 inhibition, which would suggest a PGE2-independent mechanism [68], PGE2 causes an increase in MMP2 in endothelial and pancreatic cancer cells, mediated by PGE2 receptors [75, 76]. In the MV3 cells examined in the present study, a COX-independent mechanism of MMP2 expression seems unlikely, because the MMP2 gene lacks the AP1 binding site in its promotor elements. The promotor elements of the majority of MMP genes, just not the MMP2 gene, include AP1 binding sites [77]. Thus, AP1 consisting of c-Jun homodimers that result from ACE-signaling via ERK/JNK phosphorylation cascades would be unable to regulate MMP2 expression directly (Fig. 12).
MMP2 has a significant share in lisinopril-mediated MV3 cell invasion
The formation of tight junctions consisting of occludin, claudin-1 and zonula occludens-1 allows for the polarized epithelial phenotype of Huh7 cells and ensures the epithelial integrity of a Huh7 cell layer [78]. In the present study, the ability of Huh7 monolayers to form a stable TEER which then is abrogated by non-physical contact with MV3 cells supports the idea of a paracellular invasion mechanism used by MV3 cells in the coculture (Fig. 10H). As the decrease in TEER has to be driven by a soluble component and lisinopril was able to accelerate this decrease while at the same causing increases in MMP2 expression and secretion, an MMP2-mediated breakdown of TEER/ invasion of the Huh7 monolayers is most likely. Indeed, human A7 melanoma cells seeded on a tight Madin-Darby Canine Kidney-C7 (MDCK) cell layer achieve a TEER breakdown through secretion of MMP2 without the need of any additional stimuli [79, 80], and in a blood brain barrier model, MMP2 and MMP9 secreted by leukemic cells mediate the disruption of tight junctions [81]. The MMP2-mediated breakdown of cell-cell-boundaries such as tight junctions would further explain the observed increase in the migratory activity of MV3 cells in the presence of the RAAS-modulating drugs. Consistent with this notion, we found that the degree of MMP2 expression/secretion in response to the different RAAS-modulators positively correlates with a stronger migratory activity of the invasive cells, especially the translocation after invading the hepatocyte layer, whereas the translocation of cells treated with ATII alone remains low (Fig. 3). Furthermore, the MMP2 inhibitor ARP-100 nearly halves the number of invasive MV3 cells (Fig. 11 B, D). ARP-100 can also inhibit MMP9, MMP3, MMP1 and MMP7 with IC50 values of 200, 4,500, >50,000 and >50,000 nmol l-1, respectively [82]. However, in MV3 cells, we did not detect MMP9, neither at mRNA nor at protein level, which is consistent with a previous analysis of MV3 cells’ MMP expression [83]. Besides, although MMP3 has been shown to potentially contribute to MV3 cell invasion [84], the ARP-100 concentration of 100 nmol l-1 used in the present study is too low to significantly affect MMP3. We therefore conclude that here ARP-100 inhibited MMP2 only.
In melanoma patients, the expression of MMP2 can be associated with worse survival, and for primary melanoma, MMP2 staining-intensity can be utilized as an independent molecular prognostic factor [85]. This is in line with the MMP2-dependently intensified invasive and migratory MV3 phenotype observed upon lisinopril treatment.
However, the invasiveness of MV3 cells depends on the substrate. While co-application of ATII and losartan decrease invasion of a collagen type I-based matrix, they increase invasion of a Huh7 cell layer. Because (i) collagen IV is the main substrate of MMP2, and (ii) MV3 cells express MMP1 with a high affinity to collagen I, the invasion of the collagen type I-based matrix may be driven by MMP1 or MMP3 rather than MMP2.
In a previous study, losartan tended to increase MV3 cell invasion of a collagen I matrix [36]. The losartan-induced decrease found in the present study (Fig. 5) most probably originates from the presence of the chemogradient created by filling Huh7 supernatant into the lower compartment of the Boyden chamber. This reasoning is supported by the observations that, when compared to the effects of lisinopril in presence of ATII or ATII alone, losartan causes a delay in TEER breakdown (Fig. 10H) and does not lead to a significantly increased MMP2 secretion (Fig. 10G). As losartan does promote MV3 invasion of a hepatocyte layer, an additional, MMP2-independent mechanism cannot be excluded at this point.
Conclusion
The ACE inhibitor lisinopril induces the expression of the pro-invasive COX2 and MMP2 in MV3 cells, stimulates MMP2 secretion, accelerates MV3 cell mediated TEER breakdown and potentiates their invasion of a hepatocyte monolayer, and tends to increase invasiveness on a collagen-I based substrate. From these results, we conclude that lisinopril increases MV3 cell invasiveness by enhanced expression and secretion of MMP2. In this context, COX2 may implement its pro-invasive capabilities via an increased expression of MMP2. It remains challenging to study the plethora of effector functions of the RAAS-receptors, especially in a system where various components are endogenously expressed and interfere with each other. Nevertheless, the model shown in Fig. 12 is meant to integrate the knowledge gained from the present study into the prevailing literature and shall represent the in situ situation, where cells make use of local RAAS.
Although ARBs/ACEIs are under debate as an adjuvant therapy for many neoplasias, due to their growth depressing and anti-angiogenic effects, their capability to promote other tumor characteristics such as metastasis must not be neglected and needs to be further investigated.
We thank Dr. Mahdi Amiri for sharing his expertise in molecular biology and for helping us with the primer design. Prof. Arndt Vogel’s lab (Hannover Medical School) provided Huh7 cells.
Author Contributions
YB performed the experiments. YB and CS devised the concept, designed and planned the experiments, analyzed the data, interpreted the results and prepared the manuscript.
Statement of Ethics
The authors have no ethical conflicts to disclose.
The authors declare that no conflicts of interest exist.
| 1 Sung H, Ferlay J, Siegel RL, Laversanne M, Soerjomataram I, Jemal A, Bray F: Global cancer statistics 2020: GLOBOCAN estimates of incidence and mortality worldwide for 36 cancers in 185 countries. CA Cancer J Clin 2021;71:209-249. https://doi.org/10.3322/caac.21660 |
||||
| 2 Leonardi GC, Falzone L, Salemi R, Zanghi A, Spandidos DA, Mccubrey JA, Candido S, Libra M: Cutaneous melanoma: From pathogenesis to therapy. Int J Oncol 2018;52:1071-1080. https://doi.org/10.3892/ijo.2018.4287 |
||||
| 3 Leonardi GC, Candido S, Falzone L, Spandidos DA, Libra, M: Cutaneous melanoma and the immunotherapy revolution. Int J Oncol 2020;57:609-618. https://doi.org/10.3892/ijo.2020.5088 |
||||
| 4 Mierke CT: Mechanical cues affect migration and invasion of cells from three different directions. Front Cell Dev Biol 2020;8:583226. https://doi.org/10.3389/fcell.2020.583226 |
||||
| 5 Novikov NM, Zolotaryova SY, Gautreau AM, Denisov E: Mutational drivers of cancer cell migration and invasion. Br J Cancer 2021;124:102-114. https://doi.org/10.1038/s41416-020-01149-0 |
||||
| 6 Stock C, Schwab A: Ion channels and transporters in metastasis. Biochim Biophys Acta 2015;1848:2638-2646. https://doi.org/10.1016/j.bbamem.2014.11.012 |
||||
| 7 Stock C: Circulating tumor cells: does ion transport contribute to intravascular survival, adhesion, extravasation, and metastatic organotropism? Rev Physiol Biochem Pharmacol 2022;182:139-176. https://doi.org/10.1007/112_2021_68 |
||||
| 8 Gao Y, Bado I, Wang H, Zhang W, Rosen JM, Zhang XHF: Metastasis organotropism: redefining the congenial soil. Dev Cell 2019;49:375-391. https://doi.org/10.1016/j.devcel.2019.04.012 |
||||
| 9 Diener-West M, Reynolds SM, Agugliaro DJ, Caldwell R, Cumming K, Earle JD, Hawkins BS, Hayman JA, Jaiyesimi I, Jampol LM, Kirkwood JM, Koh WJ, Robertson DM, Shaw JM, Straatsma BR, Thoma J: Collaborative Ocular Melanoma Study Group. Development of metastatic disease after enrollment in the COMS trials for treatment of choroidal melanoma: collaborative ocular melanoma study group report No. 26. Arch Opthalmol 2005;123:1639-1643. https://doi.org/10.1001/archopht.123.12.1639 |
||||
| 10 Al-Makki A, DiPette D, Whelton PK, Murad MH, Mustafa RA, Acharya S, Beheiry HM, Champagne B, Connell K, Cooney MT, Ezeigwe N, Gaziano TA, Gidio A, Lopez-Jaramillo P, Khan UI, Kumarapeli V, Moran AE, Silwimba MM, Rayner B, Sukonthasan A, et al.: Hypertension pharmacological treatment in adults: a world health organization guideline executive summary. Hypertension 2022;79:293-301. https://doi.org/10.1161/HYPERTENSIONAHA.121.18192 |
||||
| 11 Ettehad D, Emdin CA, Kiran A, Anderson SG, Callender T, Emberson J, Chalmers J, Rodgers A, Rahimi K: Blood pressure lowering for prevention of cardiovascular disease and death: a systematic review and meta-analysis. Lancet 2016;387:957-967. https://doi.org/10.1016/S0140-6736(15)01225-8 |
||||
| 12 Fuchs FD, Whelton PK: High blood pressure and cardiovascular disease. Hypertension 2020;75:285-292. https://doi.org/10.1161/HYPERTENSIONAHA.119.14240 |
||||
| 13 Balakumar P, Handa S, Alqahtani A, Alqahtani T, Kahn NA, LakshmiTaj RS, Thangathirupathi A, Sundram K, Shenoy V: Unravelling the differentially articulated axes of the century-old renin-angiotensin-aldosterone system: potential therapeutic implications. Cardiovasc Toxicol 2022;22:246-253. https://doi.org/10.1007/s12012-022-09724-y |
||||
| 14 Williams B, Mancia G, Spiering W, Rosei EA, Azizi M, Burnier M, Clement DL, Coca A, de Simone G, Dominiczak A, Kahan T, Mahfoud F, Redon J, Ruilope L, Zanchetti A, Kerins M, Kjeldsen SE, Kreutz R, Laurent S, Lip GYH, et al.: ESC Scientific Document Group. 2018 ESC/ESH Guidelines for the management of arterial hypertension. Eur Heart J 2018;39:3021-3104. https://doi.org/10.1093/eurheartj/ehy339 |
||||
| 15 Santos PC, Krieger JE, Pereira AC: Renin-angiotensin system, hypertension, and chronic kidney disease: pharmacogenetic implications. J Pharmacol Sci 2012;120:77-88. https://doi.org/10.1254/jphs.12R03CR |
||||
| 16 Lavoie JL, Sigmund CD: Minireview: overview of the renin-angiotensin system - an endocrine and paracrine system. Endocrinology 2003;144:2179-2183. https://doi.org/10.1210/en.2003-0150 |
||||
| 17 Forrester SJ, Booz GW, Sigmund CD, Coffman TM, Kawai T, Rizzo V, Scalia R, Eguchi S: Angiotensin II signal transduction: an update on mechanisms of physiology and pathophysiology. Physiol Rev 2018;98:1627-1738. https://doi.org/10.1152/physrev.00038.2017 |
||||
| 18 Nguyen Dinh Cat A, Touyz, RM: Cell signaling of angiotensin II on vascular tone: novel mechanisms. Curr Hypertens Rep 2011;13:122-128. https://doi.org/10.1007/s11906-011-0187-x |
||||
| 19 Mukoyama M, Nakajima M, Horiuchi M, Sasamura H, Pratt RE, Dzau VJ: Expression cloning of type 2 angiotensin II receptor reveals a unique class of seven-transmembrane receptors. J Biol Chem 1993;268:24539-24542. https://doi.org/10.1016/S0021-9258(19)74498-6 |
||||
| 20 Ichiki T, Inagami T: Expression, genomic organization, and transcription of the mouse angiotensin II type 2 receptor gene. Circ Res 1995;76:693-700. https://doi.org/10.1161/01.RES.76.5.693 |
||||
| 21 Carey RM, Wang ZQ, Siragy HM: Role of the angiotensin type 2 receptor in the regulation of blood pressure and renal function. Hypertension 2000;35:155-163. https://doi.org/10.1161/01.HYP.35.1.155 |
||||
| 22 Tsutsumi Y, Matsubara H, Masaki H, Kurihara H, Murasawa S, Takai S, Miyazaki M, Nozawa Y, Ozono R, Nakagawa K, Miwa T, Kawada N, Mori Y, Shibasaki Y, Tanaka Y, Fujiyama S, Koyama Y, Fujiyama A, Takahashi H, Iwasaka T: Angiotensin II type 2 receptor overexpression activates the vascular kinin system and causes vasodilation. J Clin Invest 1999;104:925-935. https://doi.org/10.1172/JCI7886 |
||||
| 23 Porrello ER, Delbridge LMD, Thomas WG: The angiotensin II type 2 (AT2) receptor: an enigmatic seven transmembrane receptor. Front Biosci 2009;14:958-972. https://doi.org/10.2741/3289 |
||||
| 24 Kohlstedt K, Shoghi F, Müller-Esterl W, Busse R, Fleming I: CK2 phosphorylates the angiotensin-converting enzyme and regulates its retention in the endothelial cell plasma membrane. Circ Res 2002;91:749-756. https://doi.org/10.1161/01.RES.0000038114.17939.C8 |
||||
| 25 Kohlstedt K, Brandes RP, Müller-Esterl W, Busse R, Fleming I: Angiotensin-converting enzyme is involved in outside-in signaling in endothelial cells. Circ Res 2004;94:60-67. https://doi.org/10.1161/01.RES.0000107195.13573.E4 |
||||
| 26 Kohlstedt K, Busse R, Fleming I: Signaling via the angiotensin-converting enzyme enhances the expression of cyclooxygenase-2 in endothelial cells. Hypertension 2005;45:126-132. https://doi.org/10.1161/01.HYP.0000150159.48992.11 |
||||
| 27 Reis RI, Nogueira MD, Campanha-Rodrigues AL, Pereira LM, Andrade MCC, Parreiras-E-Silva LT, Costa-Neto CM, Mortara RA, Casarini DE: The binding of captopril to angiotensin I-converting enzyme triggers activation of signaling pathways. Am J Physiol Cell Physiol 2018;315:C367-C379. https://doi.org/10.1152/ajpcell.00012.2016 |
||||
| 28 Guimarães PB, de Alvarenga EC, Siqueira PD, Paredes-Gamero EJ, Sabatini RA, Morais RLT, Reis RI, Santos EL, Teixeira LGD, Casarini DE, Martin RP, Shimuta SI, Carmona AK, Nakaie CR, Jasiulionis MG, Ferreira AT, Pesquero JL, Oliveira SM, Bader M, Costa-Neto CM, et al.: Angiotensin II binding to angiotensin I-converting enzyme triggers calcium signaling. Hypertension 2011;57:965-972. https://doi.org/10.1161/HYPERTENSIONAHA.110.167171 |
||||
| 29 De Alvarenga EC, de Castro Fonseca M, Carvalho CC, Florentino RM, França A, Matias E, Guimarães PB, Batista C, Freire V, Carmona AK, Pesquero JB, de Paula AM, Foureaux G, de Fatima Leite M: Angiotensin converting enzyme regulates cell proliferation and migration. PLoS One 2016;11:e0165371. https://doi.org/10.1371/journal.pone.0165371 |
||||
| 30 Paul M, Poyan Mehr A, Kreutz R: Physiology of local renin-angiotensin systems. Physiol Rev 2006;86:747-804. https://doi.org/10.1152/physrev.00036.2005 |
||||
| 31 Kim ST, Park KH, Oh SC, Seo JH, Kim JS, Shin SW, Kim YH: How does inhibition of the renin-angiotensin system affect the prognosis of advanced gastric cancer patients receiving platinum-based chemotherapy? Oncology 2012;83:354-360. https://doi.org/10.1159/000337979 |
||||
| 32 Menter AR, Carroll NM, Sakoda LC, Delate T, Hornbrook MC, Kain RK, Kushi LH, Quinn VP, Ritzwoller DP: Effect of angiotensin system inhibitors on survival in patients receiving chemotherapy for advanced non-small-cell lung cancer. Clin Lung Cancer 2017;18:189-197. https://doi.org/10.1016/j.cllc.2016.07.008 |
||||
| 33 Osumi H, Matsusaka S, Wakatsuki T, Suenaga M, Shinozaki E, Mizunuma N: Angiotensin II type-1 receptor blockers enhance the effects of bevacizumab-based chemotherapy in metastatic colorectal cancer patients. Mol Clin Oncol 2015;3:1295-1300. https://doi.org/10.3892/mco.2015.630 |
||||
| 34 Sipahi I, Debanne SM, Rowland DY, Simon DI, Fang JC: Angiotensin-receptor blockade and risk of cancer: meta-analysis of randomized controlled trials. Lancet Oncol 2010;11:627-636. https://doi.org/10.1016/S1470-2045(10)70106-6 |
||||
| 35 Yoon C, Yang HS, Jeon I, Chang Y, Park SM: Use of angiotensin-converting-enzyme inhibitors or angiotensin-receptor blockers and cancer risk: a meta-analysis of observational studies. CMAJ 2011;183:E1073-E1084. https://doi.org/10.1503/cmaj.101497 |
||||
| 36 Olschewski DN, Hofschröer V, Nielsen N, Seidler DG, Schwab A, Stock C: The angiotensin II type 1 receptor antagonist losartan affects NHE1-dependent melanoma cell behavior. Cell Physiol Biochem 2018;45:2560-2576. https://doi.org/10.1159/000488274 |
||||
| 37 Rice AS, Dworkin RH, McCarthy TD, Anand P, Bountra C, McCloud PI, Hill J, Cutter G, Kitson G, Desem N, Raff M: EMA401-003 study group. EMA401, an orally administered highly selective angiotensin II type 2 receptor antagonist, as a novel treatment for postherpetic neuralgia: a randomized, double-blind, placebo-controlled phase 2 clinical trial. Lancet 2014;383:1637-1647. https://doi.org/10.1016/S0140-6736(13)62337-5 |
||||
| 38 Van Muijen GNP, Jansen KFJ, Cornelissen IMHA, Smeets DFCM, Beck JLM, Ruiter DJ: Establishment and characterization of a human melanoma cell line (MV3) which is highly metastatic in nude mice. Int J Cancer 1991;48:85-91. https://doi.org/10.1002/ijc.2910480116 |
||||
| 39 Nakabayashi H, Miyano K., Sato J, Yamane T, Taketa K: Growth of human hepatoma cell lines with differentiated functions in chemically defined medium. Cancer Res 1982;42:3858-3863. | ||||
| 40 Boron WF, De Weer P: Intracellular pH transients in squid giant axons caused by CO2, NH3, and metabolic inhibitors. J Gen Physiol 1976;67:91-112. https://doi.org/10.1085/jgp.67.1.91 |
||||
| 41 Thomas JA, Buchsbaum RN, Zimniak A, Racker E: Intracellular pH measurements in Ehrlich ascites tumor cells utilizing spectroscopic probes generated in situ. Biochemistry 1979;18:2210-2218. https://doi.org/10.1021/bi00578a012 |
||||
| 42 Siljee S, Pilkington T, Brasch HD, Bockett N, Patel J, Paterson E, Davis PF, Tan ST: Cancer stem cells in head and neck metastatic malignant melanoma express components of the renin-angiotensin system. Life 2020;10:268. https://doi.org/10.3390/life10110268 |
||||
| 43 Wickremesekera AC, Brasch HD, Lee VM, Davis PF, Parker A, Koeck H, Itinteang T, Tan ST: Cancer stem cell subpopulations in metastatic melanoma to the brain express components of the renin-angiotensin system. J Cancer Metastasis Treat 2019;5:62. https://doi.org/10.20517/2394-4722.2019.009 |
||||
| 44 Herrera M, Sparks MA, Alfonso-Pecchio AR, Harrison-Bernard LM, Coffman TM: Lack of specificity of commercial antibodies leads to misidentification of angiotensin type 1 receptor protein. Hypertension 2013;61:253-258. https://doi.org/10.1161/HYPERTENSIONAHA.112.203679 |
||||
| 45 Li S, Mo C, Peng Q, Kang X, Sun C, Jiang K, Huang L, Lu Y, Sui J, Qin X, Liu Y: Cell surface glycan alterations in epithelial mesenchymal transition process of Huh7 hepatocellular carcinoma cell. PLoS ONE 2013;8:e71273. https://doi.org/10.1371/journal.pone.0071273 |
||||
| 46 Stock C, Pedersen SF: Roles of pH and the Na+/H+ exchanger NHE1 in cancer: from cell biology and animal models to an emerging translational perspective? Semin Cancer Biol 2017;43:5-16. https://doi.org/10.1016/j.semcancer.2016.12.001 |
||||
| 47 Murasawa S, Mori Y, Nozawa Y, Gotoh N, Shibuya M, Masaki H, Maruyama K, Tsutsumi Y, Moriguchi Y, Shibazaki Y, Tanaka Y, Iwasaka T, Inada M, Matsubara H: Angiotensin II type 1 receptor-induced extracellular signal-regulated protein kinase activation is mediated by Ca2+/calmodulin-dependent transactivation of epidermal growth factor receptor. Circ Res 1998;82:1338-1348. https://doi.org/10.1161/01.RES.82.12.1338 |
||||
| 48 Tsuzuki S, Matoba T, Eguchi S, Inagami T: Angiotensin II type 2 receptor inhibits cell proliferation and activates tyrosine phosphatase. Hypertension 1996;28:916-918. https://doi.org/10.1161/01.HYP.28.5.916 |
||||
| 49 Kohlstedt K, Gershome C, Trouvain C, Hofmann W-K, Fichtlscherer S, Fleming I: Angiotensin-converting enzyme (ACE) inhibitors modulate cellular retinol-binding protein 1 and adiponectin expression in adipocytes via the ACE-dependent signaling cascade. Mol Pharmacol 2009;75:685-692. https://doi.org/10.1124/mol.108.051631 |
||||
| 50 Sun X, Rentzsch B, Gong M, Eichhorst J, Pankow K, Papsdorf G, Maul B, Bader M, Siems W-E: Signal transduction in CHO cells stably transfected with domain-selective forms of murine ACE. Biol Chem 2010;391:235-244. https://doi.org/10.1515/bc.2010.020 |
||||
| 51 Touyz RM, El Mabrouk M, He G, Wu XH, Schiffrin EL: Mitogen-activated protein/extracellular signal-regulated kinase inhibition attenuates angiotensin II-mediated signaling and contraction in spontaneously hypertensive rat vascular smooth muscle cells. Circ Res 1999;84:505-515. https://doi.org/10.1161/01.RES.84.5.505 |
||||
| 52 Horiuchi M, Hayashida W, Kambe T, Yamada T, Dzau VJ: Angiotensin type 2 receptor dephosphorylates Bcl-2 by activating mitogen-activated protein kinase phosphatase-1 and induces apoptosis. J Biol Chem 1997;272:19022-19026. https://doi.org/10.1074/jbc.272.30.19022 |
||||
| 53 Kitanaka T, Nakano R, Kitanaka N, Kimura T, Okabayashi K, Narita T, Sugiya, H: JNK activation is essential for activation of MEK/ERK signaling in IL-1beta-induced COX-2 expression in synovial fibroblasts. Sci Rep 2017;7:39914. https://doi.org/10.1038/srep39914 |
||||
| 54 Fleming I: Signaling by the angiotensin-converting enzyme. Circ Res 2006;98:887-896. https://doi.org/10.1161/01.RES.0000217340.40936.53 |
||||
| 55 Renziehausen A, Wang H, Rao B, Weir L, Nigro CL, Lattanzio L, Merlano M, Vega-Rioja A, del Carmen Fernandez-Carranco M, Hajji N, Matin R, Harwood C, Li S, Sim VR, O'Neill K, Evans A, Thompson A, Szlosarek P, Fleming C, Stebbing J, et al.: The renin angiotensin system (RAS) mediates bifunctional growth regulation in melanoma and is a novel target for therapeutic intervention. Oncogene 2019;38:2320-2336. https://doi.org/10.1038/s41388-018-0563-y |
||||
| 56 Campbell DJ, Krum H, Esler MD: Losartan increases bradykinin levels in hypertensive humans. Circulation 2005;111:315-320. https://doi.org/10.1161/01.CIR.0000153269.07762.3B |
||||
| 57 Oliveira-Souza M, De Mello-Aires M: Interaction of angiotensin II and atrial natriuretic peptide on pH(i) regulation in MDCK cells. Am J Physiol Renal Physiol 2000;279:F944-F953. https://doi.org/10.1152/ajprenal.2000.279.5.F944 |
||||
| 58 Eguti DMN, Thieme K, Leung GP, Mello-Aires M, Oliveira-Souza M: Regulation of Na+/H+ exchanger isoform 1 (NHE1) by calmodulin-binding sites: role of angiotensin II. Cell Physiol Biochem 2010;26:541-552. https://doi.org/10.1159/000322322 |
||||
| 59 Hendus-Altenburger R, Pedraz-Cuesta E, Olesen CW, Papaleo E, Schnell JA, Hopper JTS, Robinson CV, Pedersen SF, Kragelund BB: The human Na(+)/H(+) exchanger 1 is a membrane scaffold protein for extracellular signal-regulated kinase 2. BMC Biol 2016;14:31. https://doi.org/10.1186/s12915-016-0252-7 |
||||
| 60 Haworth RS, McCann C, Snabaitis AK, Roberts NA, Avkiran M: Stimulation of the plasma membrane Na+/H+ exchanger NHE1 by sustained intracellular acidosis. Evidence for a novel mechanism mediated by the ERK pathway. J Biol Chem 2003;278:31676-31684. https://doi.org/10.1074/jbc.M304400200 |
||||
| 61 Malo ME, Li L, Fliegel L. Mitogen-activated protein kinase-dependent activation of the Na+/H+ exchanger is mediated through phosphorylateion of amino acids Ser770 and Ser771. J Biol Chem 2007;282:6292-6299. https://doi.org/10.1074/jbc.M611073200 |
||||
| 62 Stock C, Mueller M, Kraehling H, Mally S, Noël J, Eder C, Schwab A: pH nanoenvironment at the surface of single melanoma cells. Cell Physiol Biochem 2007;20:679-686. https://doi.org/10.1159/000107550 |
||||
| 63 Busco G, Cardone RA, Greco MR, Bellizzi A, Colella M, Antelmi E, Mancini MT, Dell'Aquila ME, Casavola V, Paradiso A, Reshkin SJ: NHE1 promotes invadopodial ECM proteolysis through acidification of the peri-invadopodial space. FASEB J 2010;24:3903-3915. https://doi.org/10.1096/fj.09-149518 |
||||
| 64 Lin Y, Chang G, Wang J, Jin W, Wang L, Li H, Ma L, Li Q, Pang T: NHE1 mediates MDA-MB-231 cells invasion through the regulation of MT1-MMP. Exp Cell Res 2011;317:2031-2040. https://doi.org/10.1016/j.yexcr.2011.05.026 |
||||
| 65 Hofmann UB, Westphal JR, Zendman AJ, Becker JC, Ruiter DJ, van Muijen GN: Expression and activation of matrix metalloproteinase-2 (MMP-2) and its co-localization with membrane-type 1 matrix metalloproteinase (MT1-MMP) correlate with melanoma progression. J Pathol 2000;191:245-256. https://doi.org/10.1002/1096-9896(2000)9999:9999<::AID-PATH632>3.0.CO;2-# |
||||
| 66 Sato H, Takino T: Coordinate action of membrane-type matrix metalloproteinase-1 (MT1-MMP) and MMP-2 enhances pericellular proteolysis and invasion. Cancer Sci 2010;101:843-847. https://doi.org/10.1111/j.1349-7006.2010.01498.x |
||||
| 67 Eyries M, Agrapart M, Alonso A, Soubrier F: Phorbol ester induction of angiotensin-converting enzyme transcription is mediated by Egr-1 and AP-1 in human endothelial cells via ERK1/2 pathway. Circ Res 2002;91:899-906. https://doi.org/10.1161/01.RES.0000042703.39845.B4 |
||||
| 68 Denkert C, Köbel M, Berger S, Siegert A, Leclere A, Trefzer U, Hauptmann S: Expression of cyclooxygenase 2 in human malignant melanoma. Cancer Res 2001;61:303-308. | ||||
| 69 Goulet A-C, Einsphar JG, Alberts DS, Beas A, Burk C, Bhattacharyya A, Bangert J, Harmon JM, Fujiwara H, Koki A, Nelson MA: Analysis of cyclooxygenase 2 (COX-2) expression during malignant melanoma progression. Cancer Biol Ther 2003;2:713-718. https://doi.org/10.4161/cbt.2.6.627 |
||||
| 70 Botti G, Fratangelo F, Cerrone M, Liguori G, Cantile M, Anniciello AM, Scala S, D'Alterio C, Trimarco C, Ianaro A, Cirino G, Caracò C, Colombino M, Palmieri G, Pepe S, Ascierto PA, Sabbatino F, Scognamiglio G: COX-2 expression positively correlates with PD-L1 expression in human melanoma cells. J Transl Med 2017;15:46. https://doi.org/10.1186/s12967-017-1150-7 |
||||
| 71 Jessen C, Kreß JKC, Baluapuri A, Hufnagel A, Schmitz W, Kneitz S, Roth S, Marquardt A, Appenzeller S, Ade CP, Glutsch V, Wobser M, Friedmann-Angeli JP, Mosteo L, Goding CR, Schilling B, Geissinger E, Wolf E, Meierjohann S: The transcription factor NRF2 enhances melanoma malignancy by blocking differentiation and inducing COX2 expression. Oncogene 2020;39:6841-6855. https://doi.org/10.1038/s41388-020-01477-8 |
||||
| 72 Panza E, De Cicco O, Ercolano G, Armogida C, Scognamiglio G, Anniciello AM, Botti G, Cirino G, Ianaro A: Differential expression of cyclooxygenase-2 in metastatic melanoma affects progression free survival. Oncotarget 2016;7:57077-57085. https://doi.org/10.18632/oncotarget.10976 |
||||
| 73 Reich R, Martin GR: Identification of arachidonic acid pathways required for the invasive and metastatic activity of malignant tumor cells. Prostaglandins 1996;51:1-17. https://doi.org/10.1016/0090-6980(95)00154-9 |
||||
| 74 Zhou P, Qin J, Li Y, Li G, Wang Y, Zhang N, Chen P, Li C. Combination therapy pf PKCzeta and COX-2 inhibitors synergistically suppress melanoma metastasis. J Exp Clin Cancer Res 2017;36:115. https://doi.org/10.1186/s13046-017-0585-2 |
||||
| 75 Ito H, Duxbury M, Benoit E, Clancy TE, Zinner MJ, Ashley SW, Whang EE: Prostaglandin E2 enhances pancreatic cancer invasiveness through an Ets-1-dependent induction of matrix metalloproteinase-2. Cancer Res 2004;64:7439-7446. https://doi.org/10.1158/0008-5472.CAN-04-1177 |
||||
| 76 Jana S, Chatterjee K, Ray AK, DasMahapatra P, Swarnakar S: Regulation of matrix metalloproteinase-2 activity by COX-2-PGE2-pAKT axis promotes angiogenesis in endometriosis. PLoS One 2016;11:e0163540. https://doi.org/10.1371/journal.pone.0163540 |
||||
| 77 Benbow U, Brinckerhoff CE: The AP-1 site and MMP gene regulation: what is all the fuss about? Matrix Biol 1997;15:519-526. https://doi.org/10.1016/S0945-053X(97)90026-3 |
||||
| 78 Yang W, Qiu C, Biswas N, Jin J, Watkins SC, Montelaro RC, Coyne CB, Wang T: Correlation of the tight junction-like distribution of claudin-1 to the cellular tropism of hepatitis C virus. J Biol Chem 2008;283:8643-8653. https://doi.org/10.1074/jbc.M709824200 |
||||
| 79 Ludwig T, Ossig R, Grassel S, Wilhelmi M, Oberleithner H, Schneider SW: The electrical resistance breakdown assay determines the role of proteinases in tumor cell invasion. Am J Physiol Renal Physiol 2002;283:F319-F327. https://doi.org/10.1152/ajprenal.00327.2001 |
||||
| 80 Gorzelanny C, Pöppelmann B, Strozyk E, Moerschbacher BM, Schneider SW: Specific interaction between chitosan and matrix metalloprotease 2 decreases the invasive activity of human melanoma cells. Biomacromolecules 2007;10:3035-3040. https://doi.org/10.1021/bm0703214 |
||||
| 81 Feng S, Cen J, Huang Y, Shen H, Yao L, Wang Y, Chen Z: Matrix metalloproteinase-2 and -9 secreted by leukemic cells increase the permeability of blood-brain barrier by disrupting tight junction proteins. PLoS One 2011;6:e20599. https://doi.org/10.1371/journal.pone.0020599 |
||||
| 82 Rossello A, Nuti E, Orlandini E, Carelli P, Rapposelli S, Macchia M, Minutolo F, Carbonaro L, Albini A, Benelli R, Cercignani G, Murphy G, Balsamo A: New N-arylsulfonyl-N-alkoxyaminoacetohydroxamic acids as selective inhibitors of gelatinase A (MMP-2). Bioorg Med Chem 2004;12:2441-2450. https://doi.org/10.1016/j.bmc.2004.01.047 |
||||
| 83 Hofmann UB, Westphal JR, Waas ET, Zendman AJ, Cornelissen IM, Ruiter DJ, van Muijen GN: Matrix metalloproteinases in human melanoma cell lines and xenografts: increased expression of activated matrix metalloproteinase-2 (MMP-2) correlates with melanoma progression. Br J Cancer 1999;81:774-782. https://doi.org/10.1038/sj.bjc.6690763 |
||||
| 84 Keurhorst D, Liashkovich I, Frontzek F, Nitzlaff S, Hofschröer V, Dreier R, Stock C: MMP3 activity rather than cortical stiffness determines NHE1-dependent invasiveness of melanoma cells. Cancer Cell Int 2019;19:285. https://doi.org/10.1186/s12935-019-1015-7 |
||||
| 85 Rotte A, Martinka M, Li G: MMP2 expression is a prognostic marker for primary melanoma patients. Cell Oncol 2012;35:207-216. https://doi.org/10.1007/s13402-012-0080-x |
||||