A High-Fat Diet Induces Cardiac Damage in Obesity-Resistant Rodents with Reduction in Metabolic Health
aPostgraduate Program in Physiological Sciences, Health Sciences Center, Federal University of Espírito Santo, Vitória, Espírito Santo, Brazil,
bPostgraduate Program in Nutrition and Health, Health Sciences Center, Federal University of Espírito Santo, Vitória, Espírito Santo, Brazil,
cCenter for Physical Education and Sports, Federal University of Espírito Santo, Vitória, Espírito Santo, Brazil,
dMedical School, São Paulo State University, Botucatu, São Paulo, Brazil, eDepartment of Morphology, Health Sciences Center, Federal University of Espírito Santo, Vitória, Espírito Santo, Brazil.
Keywords
Abstract
Background/Aims:
Obesity resistance is associated with the complex interaction of stringent and environmental factors that confer the ability to resist mass gain and body fat deposition, even when eating high-calorie diets. Considering that there are numerous gaps in the literature on the metabolic processes that explain Obesity resistance, specifically in relation to oxidative stress, the purpose of the study was to investigate whether obesity-resistant (OR) rats develop elevated reactive oxygen species in cardiac tissue.Methods:
Wistar rats were initially randomized into two groups: a standard diet (SD) and a high-fat diet (HFD) group. The SD and HFD groups were further divided into control (C), OR, and obese prone (OP) subgroups based on body weight. This criterion consisted of organizing the animals in each group in ascending order according to body weight (BW), and the cutoff point was identified in the animals by terciles: 1) lower BW; 2) intermediate BW; and 3) higher BW. Rats were sacrificed on the 14th week, and serum and organs were collected. Nutritional assessment, food profiles, histological analysis, comorbidities, and cardiovascular characteristics were determined.Results:
BW showed a significant difference between the standard diet and high-fat diet groups in the 4th week of the experimental protocol, characterizing obesity. In the 4th week, after the characterization of Obesity resistance, there was a significant difference in BW between groups C, OP, and OR. The OP and OR groups showed a significant increase in caloric intake in relation to the C group. The OP group showed a significant increase in final BW, retroperitoneal fat pad mass, sum of corporal fat deposits and reactive oxygen species, in relation to groups C and OR. The area under the glycemic curve, insulin resistance index and basal glucose were elevated in the OP group in relation to the C. OP also promoted an increase in HOMA-IR when compared with C. OR rats showed a non-significant increase in insulin and HOMA-IR in OR vs. C (p = ~0.1), but no significant differences were observed between OP vs. OR for these parameters, suggesting that both groups suffered from decreased metabolic health. Total cardiac mass, left ventricular cross-sectional area, and cholesterol levels were significantly elevated in the OP and OR groups compared with the C group.Conclusion:
A high-fat diet induces cardiac damage in obesity-resistant rodents with reduction in metabolic health.Introduction
Several experimental models have been used to reproduce obesity and obesity resistance in animals [1-4]. The model that best demonstrates these characteristics is the one that uses a high-fat diet in mice without genetic modifications [1], [5, 6]. Animals exposed to this type of offer faithfully mimic the development of experimental obesity as seen in humans [7].
In addition, a high-fat diet is ideal for inducing these models of obesity, as it provides a higher energy density in the same amount of food when compared with a standard diet [8, 9]. However, some animals exposed to a high-fat diet gain less BW than those that are obesity prone (OP), and these animals are called obesity resistant (OR) [1, 10]. Within this context, this multi-factorial condition is related to several metabolic and environmental factors that gives it the ability to lower weight gain and deposition of body fat even when ingesting high-calorie diets [11-13]. This situation is associated with a decrease in lipogenesis and increased lipid oxidation, respectively [11].
It is worth highlighting that those animals submitted to hypercaloric diets with a fat percentage greater than 40% present dysregulation in energy metabolism, developing after a long period, increased body adiposity, such as changes in fat deposits and hyperphagia, as well as insulin resistance and systemic inflammation [14, 15]. Animal studies have shown that high intake of a high-fat diet promotes excessive reactive oxygen species (ROS) production and induces oxidative stress [16, 17], causing damage to mitochondria, as well as metabolic disorders [18]. These factors lead to oxidative stress and insulin resistance in the cardiac tissue, generating an increase in leptin, insulin, triglycerides, and glucose in the bloodstream [19].
Free radicals are naturally generated in response to cellular metabolism of oxygen, and when in moderate production, they are essential for the body, regulating mitochondrial function and cell signaling [20, 21]. The antioxidant system is a defense system, which has the function of inhibiting and/or reducing damage caused by excess free radicals, maintaining cellular homeostasis. The enzymatic antioxidant defense system includes the enzymes superoxide dismutase (SOD), catalase (CAT) and glutathione peroxidase (GPx) [22]. This situation promotes balance in transcription conditions and in the antioxidant system; however, when exacerbated, it can cause oxidative damage to cell structures, lipids (lipid peroxidation), and proteins (protein carbonylation and breakdown of sulfhydryl groups), altering their functions with consequent oxidative stress [23-25].
Therefore, oxidative stress is a process in which a homeostatic imbalance occurs between oxidant and antioxidant compounds, resulting in the accumulation of free radicals, including ROS, which can affect the biological functions of affected cells [26]. This involvement is associated with obesity, metabolic syndrome, insulin resistance, cancer, and neurodegenerative and cardiovascular diseases [27, 28].
The literature suggests a close relationship between obesity and oxidative stress, to which the individual presents factors that make him susceptible to comorbidities [29-33], for example, hyperglycemia [34], high tissue lipid levels [35], insufficient antioxidant defense [36] and chronic inflammation [37], among others.
Cardiometabolic changes arising from oxidative stress are related to a reduction in contractile function, fibrosis, and cardiac remodeling [38]. These physiological pathologies are affected through lipid peroxidation, protein oxidation, DNA damage, cell dysfunction, fibroblast proliferation, metalloproteinase activation, changes in intracellular calcium transport, and activation of hypertrophic signaling pathways [39, 40].
Considering changes in cardiac tissue resulting from oxidative stress, the literature has demonstrated endothelial dysfunction with increased inflammatory activity, which can cause atherosclerosis and heart failure [41, 42]. In addition, studies show that the increase in ROS generates an increased risk of cardiovascular diseases [43].
Studies conducted with knowledge about the differences between resistant and obesity-prone animals have pointed out that OR rats are more resistant to weight gain because they have higher energy expenditure than OP animals, suggesting the involvement of improved mitochondrial antioxidant activity in OR rats [1, 44]. In addition, OR is probably cardioprotective, since a high-calorie diet was not sufficient to trigger onset of cardiometabolic diseases [2, 3].
Despite the existing molecular differences between obesity-prone and obesity-resistant groups shown in studies of proteomics, physiological signaling, and neuromodulation [45], there are still few studies that show the difference in the condition of mitochondrial redox homeostasis and energy metabolism between these two groups [1]. Furthermore, the development or absence of cardiac oxidative stress in Obesity resistance condition is scarce, and there is a lack of consistent information about the possible signaling pathways involved in this process. Given this context, the purpose of the study was to investigate whether OR rats develop elevated ROS and biomarkers of oxidative stress in cardiac tissue.
Materials and Methods
Animal care and experimental design
Wistar rats (n = 71), 30 days of age, were obtained from the Central Biotério of Federal University of Espirito Santo (UFES), Vitória, Espírito Santo, Brazil. The experimental procedures were conducted in accordance with the Manual of Care and Use of Laboratory Animals and approved by the Animal Use Ethics Committee (CEUA) of UFES under number 53/2019. Rats were housed in a controlled environment (a 12/12 h light/dark cycle, humidity: 55 ± 5%, temperature: 24 ± 2 °C). After acclimatization for one week receiving a standard diet, all rats were randomly assigned to two groups and fed either a standard diet – AIN-93 (SD, n = 35, 9.47% of calories from fat, energy density 3.80 kcal/g) or a high-fat diet (HFD, n = 36, 45.4% of calories from fat, energy density 4.81 kcal/g). The detailed diet composition is shown in Table 1. All rats had free access to purified water and chow (40 g/day) throughout the study. Furthermore, during the study period, all rats were weighed weekly, and their food intake was recorded. The experimental protocol consisted of a total period of 14 weeks, divided into two stages, induction (4 weeks) and maintenance of obesity and characterization of Obesity resistance (10 weeks). The moment of initiation of obesity was defined as the point when there was a significant increase in the body weight of HFD rats in relation to SD rats.
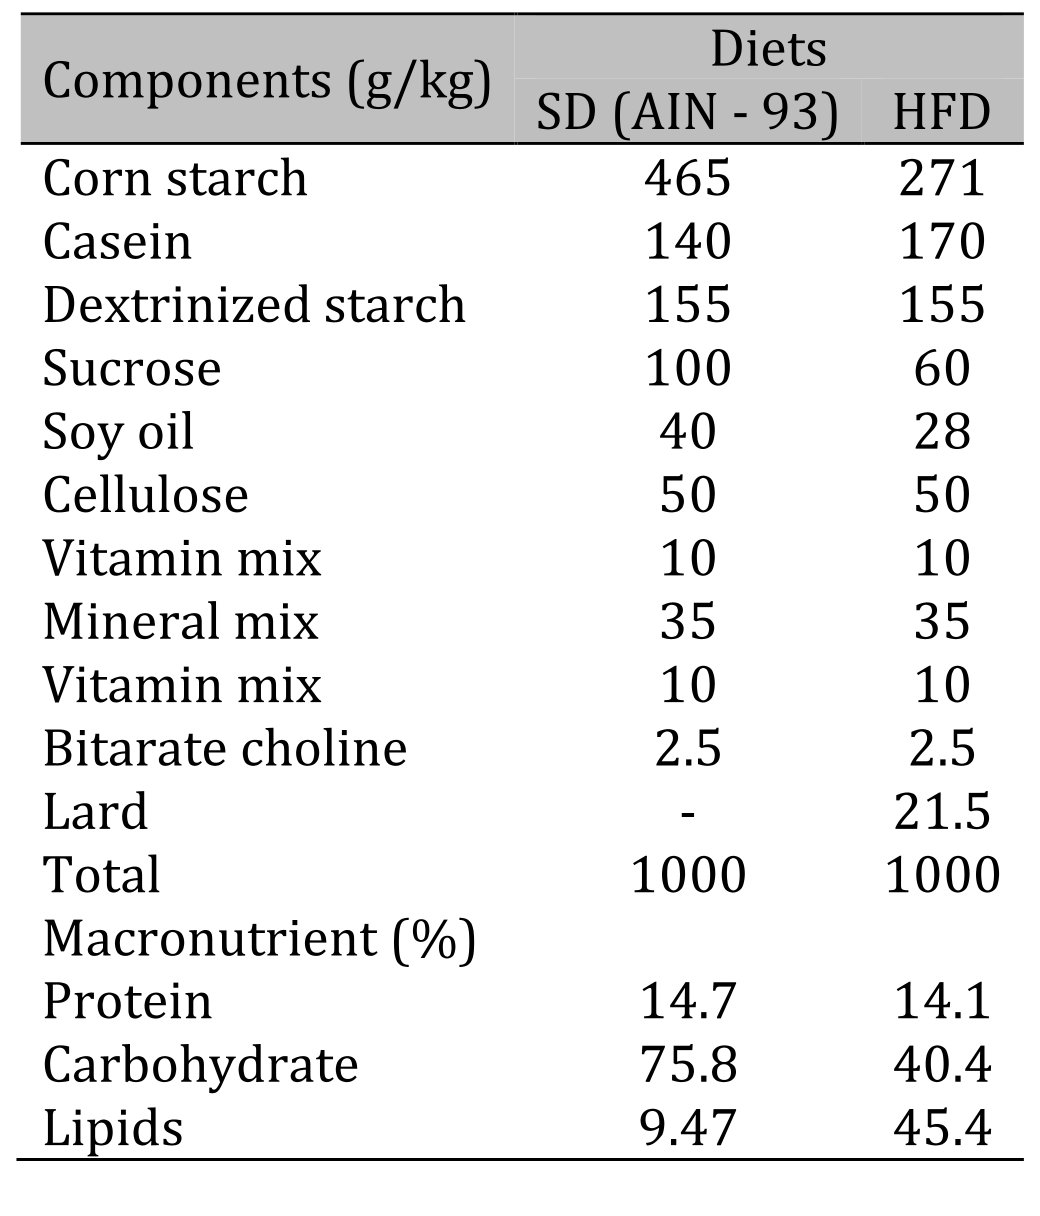
Table 1: Composition and macronutrient values of diets. HFD: high-fat diet
Criteria for the composition and redistribution of groups
At the initial moment of obesity (4 weeks), in order to form homogeneous groups, one criterion based on body weight was used to redistribute the SD and HFD groups into control (C), obese-resistant (OR), and obese prone (OP) groups. This criterion consisted of organizing the animals in each group in ascending order according to body weight, and the following tercile cutoff points were identified: 1) lower body weight; 2) intermediate body weight; and 3) higher body weight. Thus, animals fed with SD and HFD diets and those with lower body weight were classified as C and OR, respectively. Likewise, animals that received the HFD and those that presented higher body weight were classified as obese prone. Animals with intermediate BW were excluded from the study.
Nutritional assessment
Nutritional assessment was determined by analyzing BW and fat, as well as the adiposity index, parameters used to characterize experimental obesity. The BW of the animals was measured weekly. The amount of body fat was determined from the sum of epididymal, retroperitoneal, and visceral fat deposits. The adiposity index was calculated by dividing the body fat by the final BW and multiplying by 100 [46, 47].
Biochemical and hormonal profiles
The animals’ glycemic profiles were evaluated after a 6-hour fast, and the glycemic levels were analyzed at baseline and after an intraperitoneal overload of 25% glucose (Sigma-Aldrich, ® St Louis, MO, USA), equivalent to 2 g/kg. Blood samples were collected from the tip of the tail at baseline and after 30, 60, 90, and 120 minutes. Glycemic levels were measured using an Accu-Chek Go Kit portable glucometer (Roche Diagnostic Brazil Ltda., São Paulo, Brazil). Glucose tolerance was assessed by using the area under the curve (AUC) for glucose. In addition, the same serum sample was used to perform hormonal (leptin and insulin) profiling using specific kits (Millipore, Sigma Aldrich, Spruce Street, Saint Louis, MO, USA) and the ELISA method, with the aid of a microplate reader (Biochrom EZ Read 800 Plus, Holliston, MA, USA). Insulin resistance was measured by serum concentrations of glucose and fasting insulin, using the HOMA-IR index (homeostatic model assessment). The lipid profile was evaluated through serum triglyceride (TG) and total cholesterol concentrations using specific kits (Bioclin Bioquímica®, Belo Horizonte, Minas Gerais, Brazil).
Cardiac characteristics
The cardiac remodeling process was evaluated macroscopically by determining the weights of the heart, left ventricle (LV), right ventricle (RV), and total atrium (TA) and their relationships with tibial length [48]. Cardiac morphology was also analyzed microscopically by analyzing the cross-sectional area (CSA) and collagen fraction. The measurement of cardiac muscle injury markers was performed by measuring the concentrations of the enzymes total creatine kinase (CK), CKMβ (the most expressed isoform in the heart), and lactate dehydrogenase (LDH), indicators of myocardial damage, determined using commercial kits (Bioclin Bioquímica®️, Minas Gerais, Brazil).
Cardiac oxidative stress markers
Oxidative stress was analyzed by determining ROS by the dihydroethide (DHE) fluorescence method, a non-fluorescent precursor that, when oxidized by the superoxide radical, forms the fluorescent product 2-hydroxyetide, allowing analysis of the “in situ” production of superoxide radical [49]. The evaluation of membrane lipid peroxidation was performed using the thiobarbituric acid reactive substances (TBARS) method [50, 51]. Carbonyl proteins were measured using a method adapted from [52], which consists of using the 2, 4-dinitrophenylhydrazine (DNPH) derivatizer and spectrophotometric detection of any proteins modified by the carbonylation process.
Statistical analysis
The analysis was conducted in the statistical program GraphPad Prism 8. The data were expressed using the mean ± standard error of the mean (SEM) and submitted to the Shapiro–Wilk test to verify adherence to normality. Analyses between experimental and control groups were performed using the Student's t-test (comparison between two independent groups) and one-way analysis of variance (ANOVA) complemented with Tukey's multiple comparison test (comparison between three groups). The evolution of BW and the glucose tolerance test were submitted to two-way ANOVA for the repeated measures model and complemented with Bonferroni's multiple comparison test. The level of significance was 5%.
Results
Nutritional assessment
Table 2 illustrates the nutritional characteristics of the experimental groups after 14 weeks of treatment. There was no difference between groups in daily food intake. The results show that the food efficiency and caloric intake were similar in the OP and OR groups but were higher than those in group C.
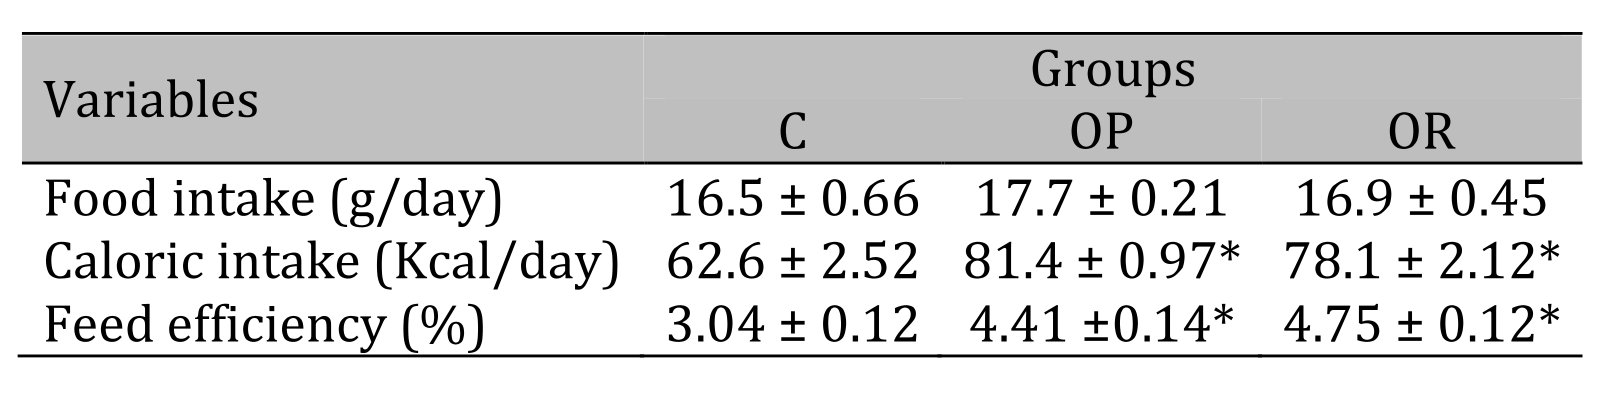
Table 2: Nutritional Characteristics. 7 animals per group. C: control; OR: obesity resistant and OP: obese prone. Data express as mean ± standard error. * p < 0.05 – Experimental groups vs. C; # p < 0.05 - OP vs. OR. ANOVA for independent samples, followed by Tukey post hoc test
Body composition of the experimental groups
Table 3 illustrates the body composition of the experimental groups after the 14-week experimental protocol. The results show that the final BW of the OP group was significantly higher than that of the OR and C groups, respectively, and the OR group also showed an increase in final BW in relation to the C group. The retroperitoneal fat deposits and the sum of all fat deposits showed a statistical difference between experimental groups when compared with the C group (OP and OR > C, and OP > OR). There was no statistical difference in the other parameters between the OP and OR groups.
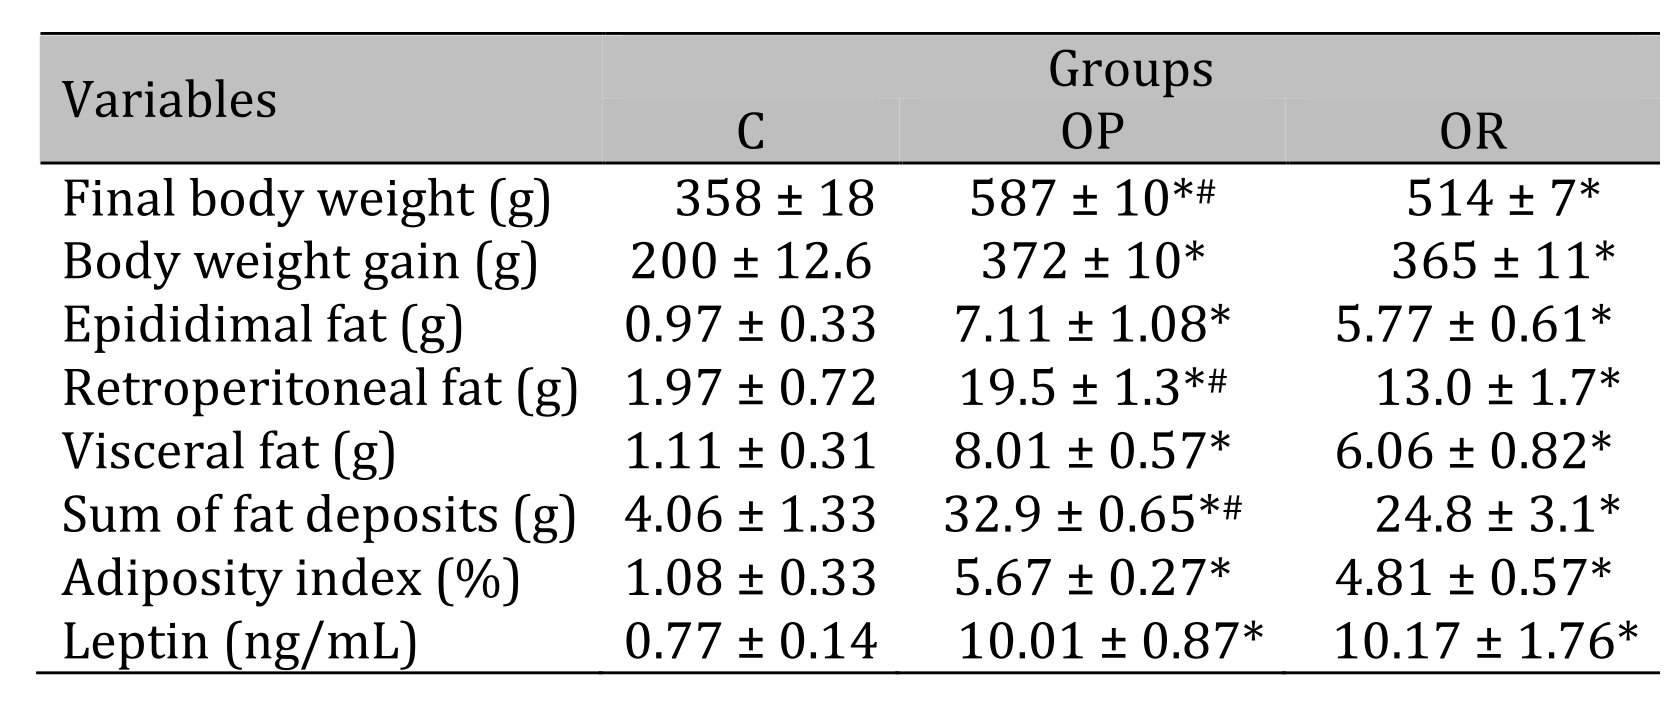
Table 3: Body composition and leptin. 7 animals per group. C: control; OR: obesity resistant and OP: obese prone. Data express as mean ± standard error. * p < 0,05 – Experimental groups vs. C; # p < 0.05 - OP vs. OR. ANOVA for independent samples, followed by Tukey post hoc test
Biochemical and hormonal characteristics of the experimental groups
The results of the glucose tolerance test, presented in Fig. 1A, show that at times 0 (baseline), 90, and 120, the glycemia values of the OP group were significantly higher than those in the C group. There was no difference in glucose tolerance between the C and OR groups. The area under the curve (AUC) (Fig. 1B) of the OP group was significantly greater than that of the C group; however, there was no significant difference between the OP and OR groups nor between the OR and C groups. In Fig. 1C, it is observed that the OP group presented an increase in insulin values in relation to the C group. The HOMA-IR results show a significantly increased value in the OP group compared with the C group; however, there was no difference between the OP and OR groups (Fig. 1D). The results also demonstrated that OR rats showed a non-significant increase in insulin (p = 0.10) and HOMA-IR (p = 0.09) in OR vs. C (Figs. 1C and D), respectively. The lipid profile demonstrated that the cholesterol values (mg/dL) were significantly higher in the experimental groups OP and OR when compared with group C; however, the TG levels were similar between the groups (Figs. 1E and F). In addition, our results showed that serum leptin levels were significantly elevated in the OP and OR groups relative to the C group (Table 1).
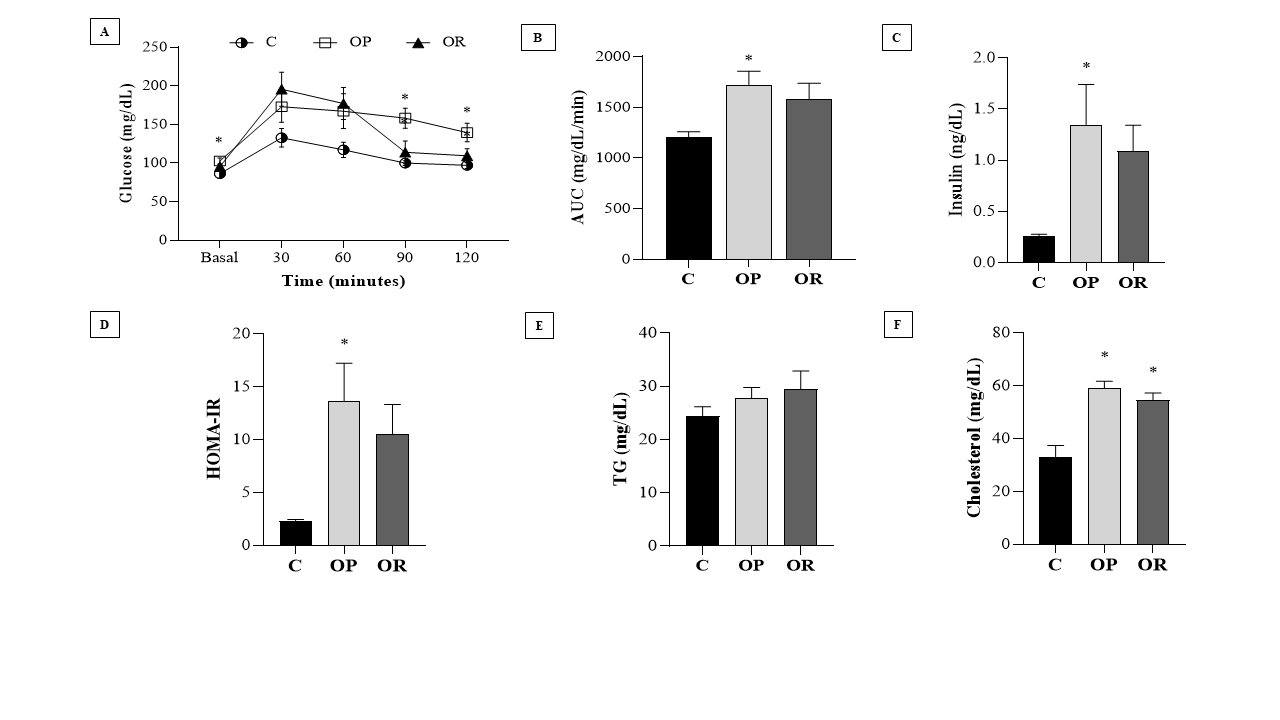
Fig. 1: Biochemical and hormonal characteristics of the experimental groups. Control (C), obesity resistant (OR) and obese prone (OP) groups. 7 animals per group. A) Glucose Tolerance Test; B) Area under the curve (AUC) for glucose; C) Insulin; D) HOMA-IR (Homeostatic Model Assessment - Insulin Resistance); E) Triglycerides (TG) and; F) Cholesterol. Data expressed as mean ± standard error. * p < 0.05 - vs. C. Two-way ANOVA for repeated measures, complemented with Tukey's post-hoc test.
Cardiac morphological characteristics
Table 4 presents the effects of diet on cardiac morphological characteristics. The effects of the obesity-inducing diet were evidenced in the results of the OR and OP animals, which showed higher values for the heart, left ventricle (LV), and direct ventricle (RV)/tibia compared with C. In addition, the values for the atrium (AT), heart/tibia, LV/tibia, and atrium/tibia were higher in the OP group compared with the C group. The RV weight was greater in the OP and OR groups when compared with the C group, and in the OP group, the value was significantly higher than that in the OR group. The cross-sectional area (CSA) of the OP and OR experimental groups showed a significant increase relative to the C group. There was no statistical difference between the OP and OR groups (Fig. 2). Cardiac interstitial collagen also showed a significant increase in the OP and OR groups compared with the C group (Fig. 3). There was no statistical difference between the studied groups regarding lactate dehydrogenase (Fig. 4A) and creatine kinase (Fig. 4B), respectively. The CK-Mβ result showed a significant increase in the values of the experimental groups OP and OR in relation to group C, respectively, with no statistical difference between them (Fig. 4C).
Table 4: Cardiac morphological. 7 animals per group. C: control; OR: obesity resistant and OP: obese prone. Data express as mean ± standard error. * p < 0.05 – Experimental groups vs. C; # p < 0.05 - OP vs. OR. ANOVA for independent samples, followed by Tukey post hoc test
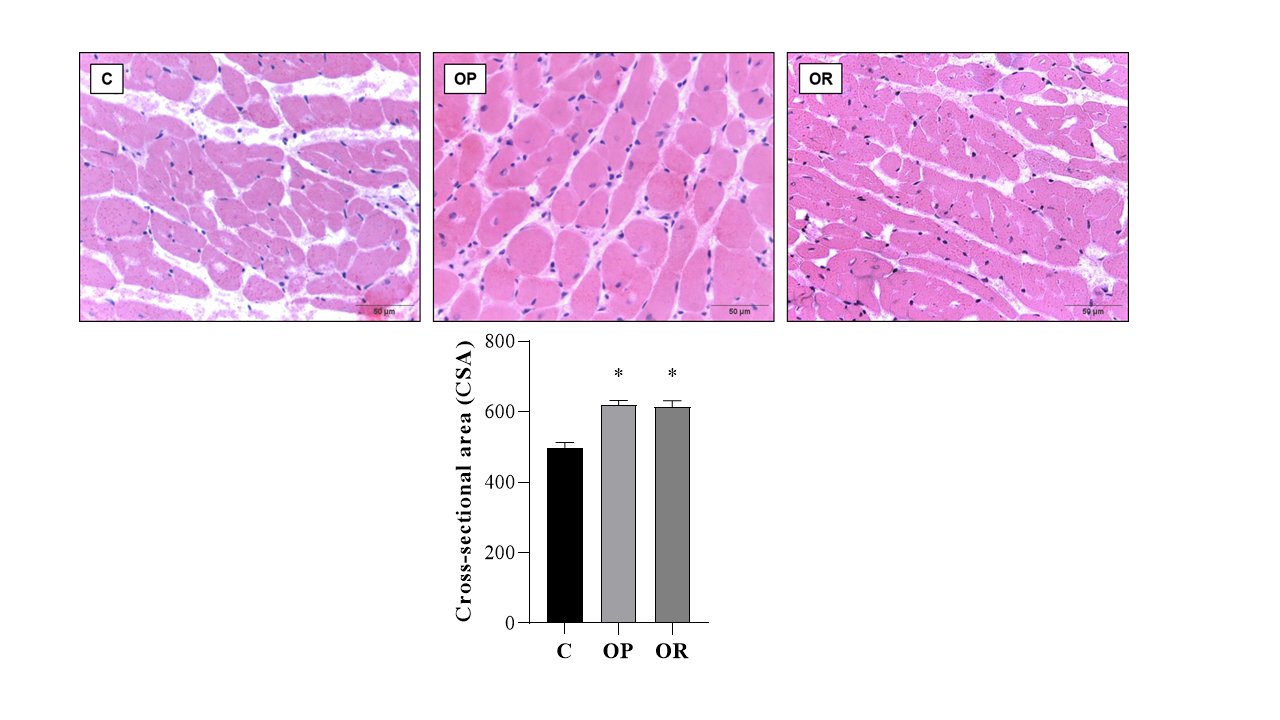
Fig. 2: Cross-sectional Area (CSA) determination. Graphs and representative panels of the Cross-sectional Area of left ventricular (LV) fragments. Hematoxylin-eosin (40x). 7 animals per group. Control (C), obesity resistant (OR) and obese prone (OP) groups. Data expressed as mean ± standard error. * p < 0.05 – vs. C. One-way ANOVA for independent samples, complemented with Tukey's post hoc test.
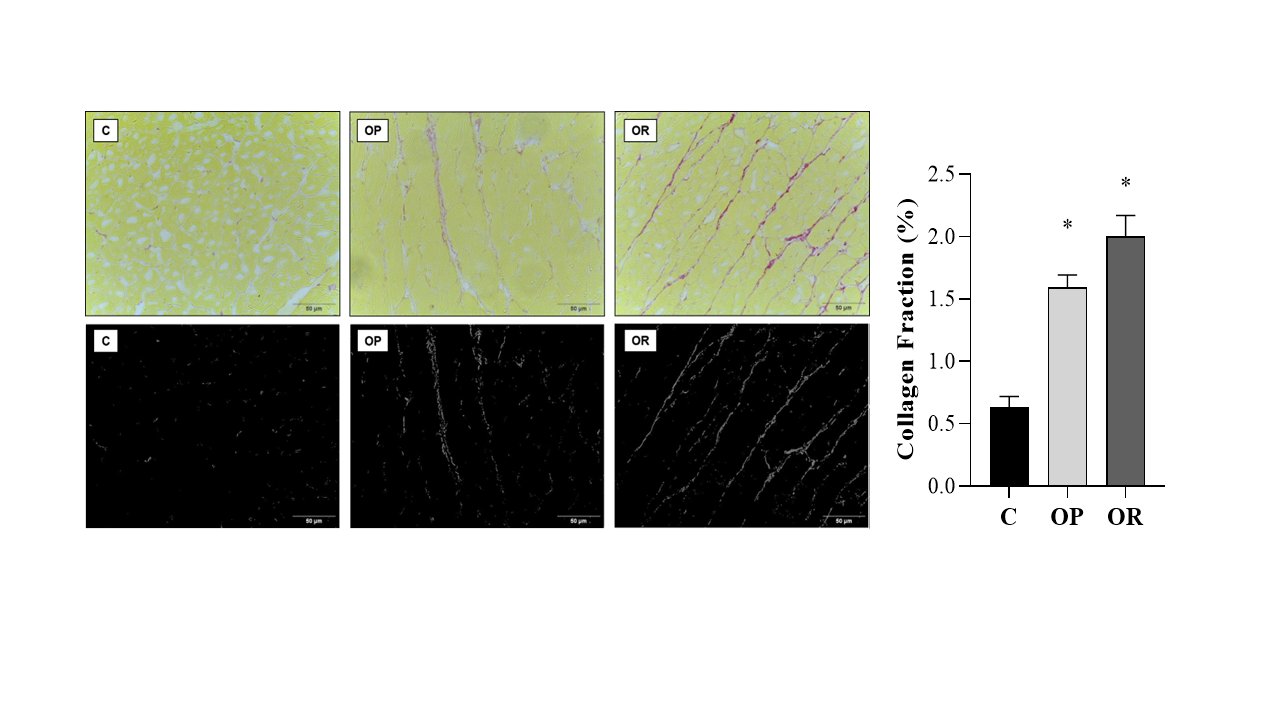
Fig. 3: Collagen Fraction. Graphs and representative panels of collagen in the left ventricle (LV). Picrosirius Red (40x). 7 animals per group. Control (C), obesity resistant (OR) and obese prone (OP) groups. Data expressed as mean ± standard error. * p < 0.05 vs. C. One-way ANOVA for independent samples, complemented with Tukey's post hoc test.
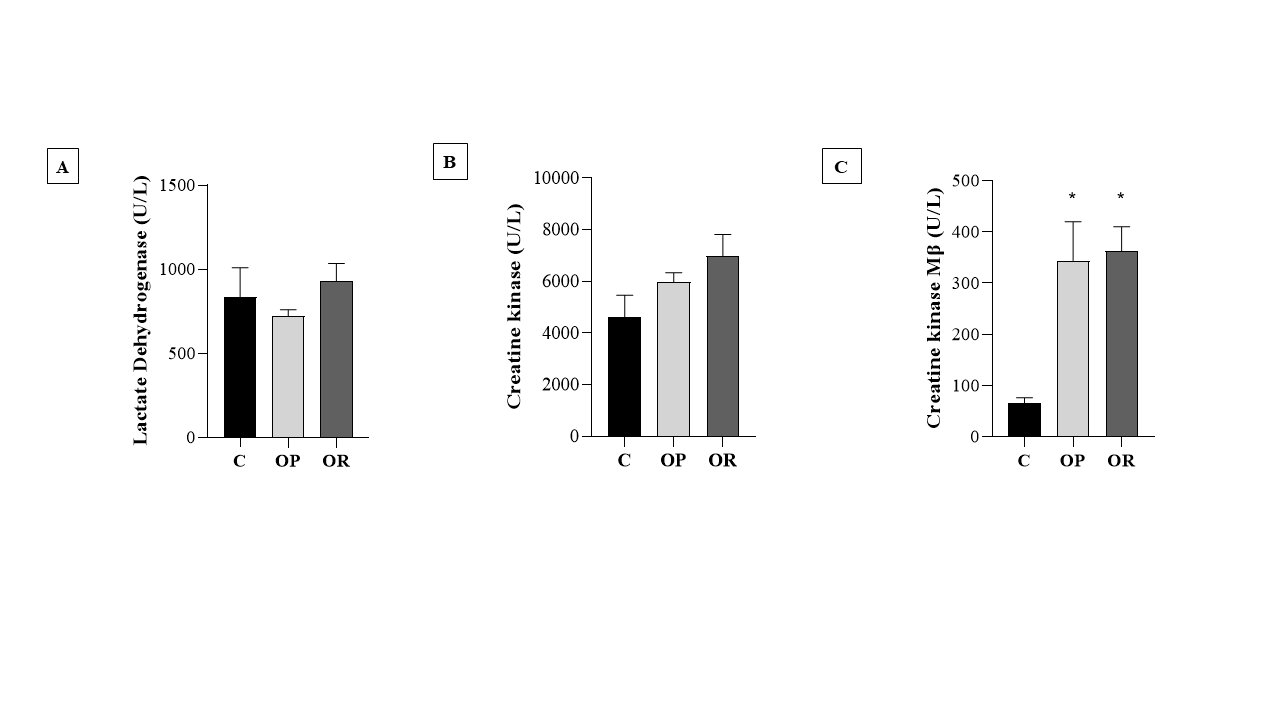
Fig. 4: Heart damage markers. 7 animals per group. Control (C), obesity resistant (OR) and obese prone (OP) groups. A) lactate dehydrogenase; B) Creatine kinase; C) Creatine kinase Mβ. Data expressed as mean ± standard error. * p < 0.05 - vs. C. Two-way ANOVA for repeated measures, complemented with Tukey's post-hoc test.
Cardiac oxidative stress
The levels of MDA (nmol/mg of protein), a marker of lipid peroxidation, were higher in the C group than in the OP and OR groups; there was no statistical difference between the OP and OR groups for this parameter (Fig. 5A). Regarding the carbonyl protein (nmol/mg of protein), the results show that there was no significant difference between the studied groups (Fig. 5B). The results show that the values of the determination of reactive oxygen species (ROS) in the OP group were significantly higher than those in the C and OR groups, respectively (Fig. 6).
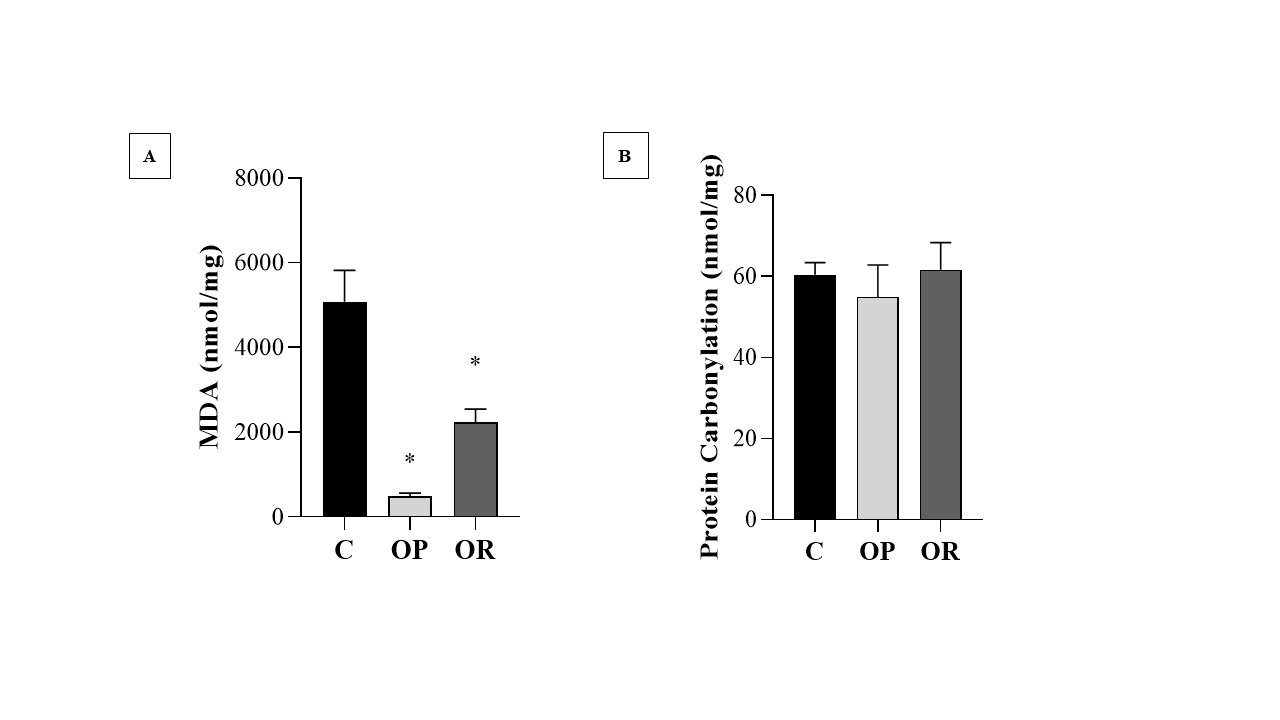
Fig. 5: Oxidative stress markers.7 animals per group. Control (C), obesity resistant (OR) and obese prone (OP) groups. A) Determination of Lipid Peroxidation; B) Determination of Protein Carbonylation. Data expressed as mean ± standard error. * p < 0.05 vs. C. One-way ANOVA for independent samples, complemented with Tukey's post hoc test.
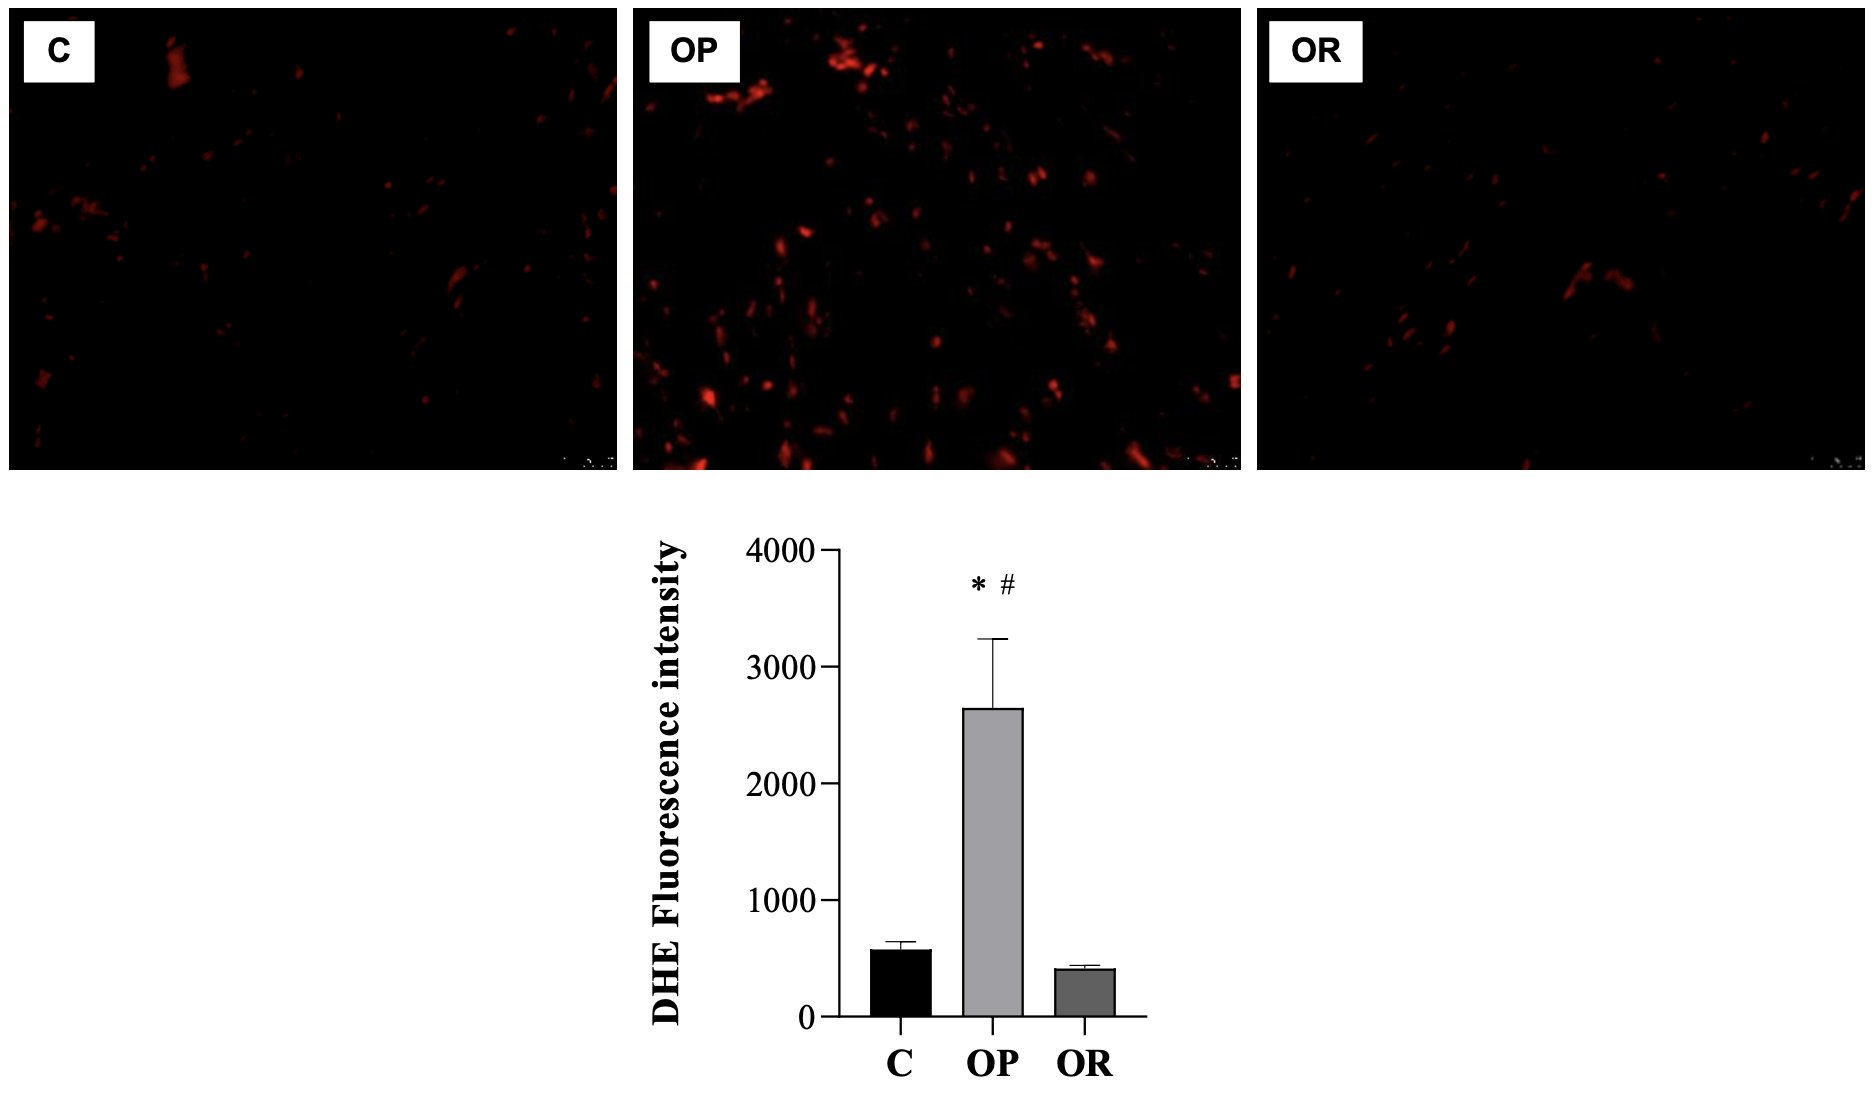
Fig. 6: Determination of Reactive Oxygen Species (ROS). Graphs and representative panels of the dihidroethidio (DHE) Fluoresence. 7 animals per group. Control (C), obesity resistant (OR) and obese prone (OP) groups. Data expressed as mean ± standard error. * p < 0.05 – vs. C; # p < 0.05 - OP vs. OR. One-way ANOVA for independent samples, complemented with Tukey's post hoc test.
Discussion
The present study aimed to investigate cardiac oxidative stress in obesity-resistant rats fed a high-fat diet rich in lard. The main findings of the study were that obesity-resistant rats fed the same diet and with a similar caloric intake as obese rats also showed damage and cardiac hypertrophy but lower expression of reactive species.
In view of this, in our study, the BW of the group fed the high-fat diet did not obtain a statistical difference relative to the standard group until the 3rd week; however, from the 4th week onwards, the DH group had a statistically increased BW compared with the SD group (Fig. 2), configuring the onset of obesity. These findings are in line with the literature, which shows that BW gain occurs gradually during the period of exposure to the high-fat diet; although it is possible to notice a difference in mass from the 2nd week of the protocol in different studies, the obesity phenotype becomes more apparent after prolonged periods, generally from the 4th week onward [1, 53-55].
In order to reliably characterize obesity and Obesity resistance, in the 4th week of the experimental treatment, the groups were redistributed on the basis of the tertile criterion, with the groups redistributed into control (C), obesity prone (OP), and obesity-resistant (OR). The results show that from the 5th week of the protocol, there was a significant increase in BW in the OP group relative to that of the OR and C groups, indicating the development of obesity. However, the OR animals presented a body mass intermediate between that of the OP and C groups, characterizing the obesity-resistant phenotype (Fig. 3). This result corroborates the literature, since there are animals that develop greater BW gain than OR animals, despite ingesting the same food and caloric amount [56, 57]. This behavior, in the difference in BW gain between the groups, is associated with the fact that some of the animals submitted to a high-fat diet make adjustments in energy intake or expenditure and do not become obese, i.e., are obesity-resistant [1, 58, 59]. The rest of the animals; however, do not compensate for the intake, energy expenditure, or fat oxidation, instead becoming obese [58-61].
Studies have shown that animals fed the same high-fat diet can acquire less BW than those considered obesity prone, with no difference in food intake, a situation currently known as Obesity resistance [62, 63]. Regarding the nutritional profile of OR animals in the present study, the results show that our findings corroborate those of previous studies [62, 63], since there was no difference in the nutritional parameters between the OP and OR groups. It should be noted that the OP group had a significantly greater BW than the OR group, as seen previously, evidencing in the OR group the characteristic of obesity resistance, an intermediary characteristic between normality and obesity. This finding suggests that in practice, even when consuming the same high-fat diet and with an equivalent food profile, OP rats are more likely to gain BW than OR rats, as they do not compensate for the increase in caloric content with an increase in lipid oxidation or energy expenditure [58, 61]. This finding is in line with the results found by [1, 57].
Considering body fat composition and deposition, which are important for the development of obesity and associated morbidities [64-66], our findings show that in the OR condition, adiposity was reduced, as seen by the sum of fat deposits and retroperitoneal fat, demonstrating that they accumulate less body fat than obesity prone animals, even when ingesting a saturated high-fat diet, which corroborates similar studies by [1, 56, 67].
Studies show that a high-fat diet (HF) can induce the accumulation of body fat; however, different individuals have different susceptibilities to DH-induced obesity. In this sense, studies have shown that OR rats do not store excess lipids in adipocytes due to the higher metabolic energy expenditure, through the maintenance of mitochondrial function and antioxidant defense, in relation to OP rats [1, 56, 68], in agreement with the results of our study. The literature also pointed out that OP individuals are more likely to gain more BW due to reduced energy consumption [44, 56], which contrasts with OR individuals who use more fat (catabolizing in greater quantity) and consume more energy.
Metabolic syndrome (MS) is defined by the occurrence of multiple concomitant factors, such as obesity, insulin resistance, hyperinsulinemia, dyslipidemia, and arterial hypertension [69, 70]. High caloric intake is a causal source of MS, since visceral adiposity has been shown to be an important trigger that activates most metabolic syndrome pathways [71, 72]. In our study, as expected, OP rats had elevated basal glucose, hyperinsulinemia, and insulin resistance compared with the C group, demonstrating important metabolic alterations.
Considering the possible alterations induced by obesity, our results suggest that OR rats can release excess lipids into the circulation instead of accumulating them in adipocytes. This situation would also explain the visualization of high plasma cholesterol in the OP group. These findings corroborate those of [56], who observed that increased oxidation of fatty acids regulated lipid accumulation in OR rats. On the other hand, no alterations in triglyceride levels were evidenced.
Leptin is a peptide hormone produced mainly by white adipose tissue. Its production is proportional to the amount of body fat. It is responsible for satiety and increased energy expenditure through the activation of central neural receptors that favor energy balance [74, 75]. It is known that obesity is associated with hyperleptinemia, reflecting resistance to leptin, as obese individuals have increased body adiposity with high circulating concentrations of this hormone [75, 76]. This insensitivity to leptin in OP individuals occurs due to its lack of binding to its receptor, which prevents feedback via the central nervous system (hypothalamus) [77]. Within this context, our findings show that serum leptin levels were significantly elevated in the OP and OR groups relative to the C group. This may suggest that OR animals do not develop resistance to leptin.
The increase in serum leptin, especially in obese individuals, should be a warning sign of energy imbalances of insulin resistance and hyperinsulinemia with its group of anomalies in glucose and lipid metabolism that strongly influence the increase in and development of chronic diseases, cardiovascular disease, and type 2 diabetes [78]. However, the presence of protein in non-overweight animals has raised important physiological functions in relation to energy control and maintenance of BW as seen in [79], corroborating our metabolic and body results for the animals in the OR group.
Leptin has a direct and inhibitory action in relation to insulin secretion, and in the regulation of body weight and glucose metabolism [80]. This inhibition of insulin can occur by activating ATP-dependent potassium channels or by interacting with the signaling of the AMPK protein (responsible for regulating cellular energy homeostasis) and then inhibiting the generation (lipogenesis) and stimulating the breakdown of fat (lipolysis) [81]. In the OR group, there was an increase in leptin similar to that in OP; however, there was no increase in adiposity and insulin resistance, suggesting an effect of leptin on insulin sensitivity and lipolysis in the group.
Most heart diseases are followed by increased cardiac mass and morphological changes. Cardiac remodeling is defined as a process with cellular, molecular, and interstitial cardiac variations, clinically manifested by changes in the mass, size, and function of the heart [82]. This remodeling occurs with the aim of maintaining cardiac function; however, after becoming recurrent, it can lead to progressive impairment of functional capacity [83]. Considering the process of cardiac remodeling, we can say that both Obesity and Obesity resistance promoted morphological changes such as cardiac hypertrophy (increase in cardiac mass, LV, ventricle/tibia ratio, and AST) and fibrosis. In addition, there is an increase in Mβ creatine kinase levels, indicating cardiac damage in both conditions.
Despite the lower adiposity of OR compared with OP, both groups had a similar caloric intake and consumed a similar high-fat diet, in addition to having a similar plasma cholesterol concentration. Hypercaloric food has a higher energy density than standard food. OR rats, despite not increasing their BW as did OP animals, undergo adjustments in energy expenditure and lipid oxidation [1, 58, 59]. This regulation to maintain homeostasis suggests a hemodynamic overload arising from the impossibility of cardiac cells to divide in adulthood, resulting in cardiac remodeling [84]. From this, OR rats can present hypertrophy and cardiac damage related to their resistance to the development of obesity, corroborating [2, 85].
Mitochondria not only produces ATP for cellular metabolism, in oxidative phosphorylation it also generates ROS [86]. Some studies have reported that high fat intake leads to excessive production of ROS and, consequently, oxidative stress, which causes mitochondrial damage and alterations [16, 17, 87]. The production of ROS in cardiac tissue (superoxide anion, hydroxyl radical, and hydrogen peroxide) has a signaling function for both physiology and pathology [88]. Under physiological conditions, signaling serves to regulate the development and maturation of cardiac cells, calcium handling, vascular toning, and contraction/excitation [89]. Under pathological conditions, with high production of ROS, oxidative stress occurs, with mitochondrial dysfunction, activation of the mitochondrial permeability transition pore (uncoupling the membrane leading to apoptosis and necrosis), and cell death [90].
Our results indicate that obesity led to an increase in ROS in cardiac tissue, more specifically the superoxide radical; however, on the other hand, OR did not induce an increase in ROS, but cardiac damage was still observed. However, although obesity promoted an increase in the production of ROS, the present study did not observe an increase in oxidative stress biomarkers in the heart. MDA is a product of lipid oxidation which, when the body is under oxidative stress, is widely used to measure lipid peroxidation [1]. Lipid peroxidation is a chain reaction of polyunsaturated fatty acids in cell membranes, which generates free radicals that alter the permeability, fluidity, and integrity of membranes [91, 92]. Excessive production stimulates radicals and promotes oxidative damage. In cardiac tissue, there is an increase in the oxidative metabolic rate and a reduction in the activity of antioxidant enzymes, which is susceptible to tissue damage due to increased oxidative stress [93].
In disagreement with the initial hypothesis, our results showed a significant increase in MDA in animals exposed to the standard diet when compared with the OP and OR groups, corroborating [94]. This result can be explained by the diet formulation, since the lipid source is a polyunsaturated fatty acid (PUFA), which is present in soybean oil; this ingredient is doubled in the standard diet (AIN-93) when compared with the high-fat diet of the OP and OR groups, respectively [95, 96]. Within this context, the literature reports that PUFAs are more susceptible to lipid peroxidation, and studies carried out in animals fed a standard diet have also shown that the types and levels of fat in the diet interfere with susceptibility to lipid peroxidation [97-99].
Carbonylated proteins are a good biomarker of severe oxidative protein damage [100]. Thus, in addition to lipid peroxidation, oxidative stress can cause damage at the protein level, with protein carbonylation, which occurs by deleting cells and tissues in the body, thus causing changes in protein function with consequent oxidative stress [23-25]. In our study, there was no difference between groups regarding carbonylated proteins.
The limitation of the current study may be related to the fact that studies involving animal experimentation, especially when dealing with Obesity and Obesity resistance, often cannot be applied directly to humans. In addition, several points need to be clarified and studied, among them the metabolism of these animals. Finally, the high-fat diet was more calorically dense which can create a confusing factor.
In future studies, we suggest that some important points need to be elucidated and clarified involving the obesity-resistant condition, among them, the ability and possible mechanisms involved in resisting obesity as long as this situation is directly related to the greater metabolic and oxidative capacity of fatty acids. Another point that is important to study is related to the need to evaluate the locomotor activity of the animals because OR rats would have lower body fat deposition due to greater spontaneous physical activity.
Conclusion
In conclusion, high-fat diet induces cardiac damage in obesity-resistant rodents with reduction in metabolic health. However, Obesity resistance did not promote elevation in reactive oxygen species increased in cardiac tissue. These findings indicate that obesity resistance, despite not developing oxidative stress, caused damage to cardiac tissue and to energy metabolism, which it was not able to preserve.
Acknowledgements
We are grateful to Jóctan Pimentel Cordeiro, Beatriz Crisostomo dos Santos, Ramon dos Santos and Raíssa Corrêa de Andrade for their assistance.
Author Contributions
J.C.C. and V.V.P.M. conceived the design of the study. J.C.C, A.R.M., V.V.P.M., S.T.S., F.M.F., C.R.C., B.V.N., A.P.L.-L., and A.S.L. performed the experiments and statistical analysis. J.C.C., A.R.M., V.V.P.M and B.V.N. interpreted and discussed the data and wrote the manuscript. J.C.C. and A.S.L. refined the final draft and revised the manuscript. All authors read and approved the final version of the manuscript.
Funding Sources
This study was supported by Fundação de Amparo à Pesquisa e Inovação do Espírito Santo - FAPES (84417625/2018, 84950790/2019, 2022-J72BB and 330/2022) and Higher Education Personnel Improvement Coordination – Capes.
Statement of Ethics
Animal experiments conformed to internationally accepted standards and have been approved by the appropriate institutional review body (Animal Use Ethics Committee (CEUA) of UFES under number 53/2019).
Disclosure Statement
The authors declare that no conflicts of interest exist.
References
| 1 | Lu Y, Li Y, Sun Y, Ma S, Zhang K, Tang X, Chen A: Differences in energy metabolism and mitochondrial redox status account for the differences in propensity for developing obesity in rats fed on high-fat diet. Food Sci Nutr 2021;9;1603-1613.
https://doi.org/10.1002/fsn3.2134 |
| 2 | Poret JM, Battle C, Mouton AJ, Gaudet DA, Souza-Smith F, Gardner JD, Braymer HD, Harrison-Bernard L, Primeaux AD: The prevalence of cardio-metabolic risk factors is differentially elevated in obesity-prone Osborne-Mendel and obesity-resistant S5B/Pl rats. Life Sci 2019;223;95-101.
https://doi.org/10.1016/j.lfs.2019.03.022 |
| 3 | Poret JM, Gaudet DA, Braymer HD, Primeaux SD: Sex differences in markers of metabolic syndrome and adipose tissue inflammation in obesity-prone, Osborne-Mendel and obesity-resistant, S5B/Pl rats. Life Sci 2021;273.
https://doi.org/10.1016/j.lfs.2021.119290 |
| 4 | Leopoldo AS, Lima-Leopoldo AP, Nascimento AF, Luvizotto RAM, Sugizaki MM, Campos DHS, da Silva DCT, Padovani CR, Cicogna AC: Classification of different degrees of adiposity in sedentary rats. Braz J Med Biol 2016;49.
https://doi.org/10.1590/1414-431X20155028 |
| 5 | Cordeiro JP, da Silva DS, Torezani-Sales S, Madureira AR, Claudio ERG, Bocalini DS, Lima-Leopoldo AP, Leopoldo AS: Resistance to obesity prevents obesity development without increasing spontaneous physical activity and not directly related to greater metabolic and oxidative capacity. PLoS One 2022;17.
https://doi.org/10.1371/journal.pone.0271592 |
| 6 | Gasparini PVF, Matias AM, Torezani-Sales S, Kobi JBBS, Siqueira JS, Corrêa CR, Lima-Leopoldo AP, Leopoldo AS: High-fat and combined high-fat and sucrose diets promote cardiac oxidative stress independent of Nox2 redox regulation and obesity in rats. Cell Physiol Biochem 2021;55;618-634.
https://doi.org/10.33594/000000441 |
| 7 | Schrauwen P, Westerterp KR: The role of high-fat diets and physical activity in the regulation of body weight. Br J Nutr 2000;84;417-427.
https://doi.org/10.1017/S0007114500001720 |
| 8 | Lin S, Thomas TC, Storlien LH, Huang XF: Development of high fat diet-induced obesity and leptin resistance in C57B1/6J mice. Int J Obes 2000;24;639-646.
https://doi.org/10.1038/sj.ijo.0801209 |
| 9 | Woods SC, Seeley RJ, Rushing PA, D'Alessio D, Tso P: Nutrient Metabolism A Controlled High-Fat Diet Induces an Obese Syndrome in Rats. J Nutr 2003;133;1081-1087.
https://doi.org/10.1093/jn/133.4.1081 |
| 10 | Levin BE, Keesey RE: Defense of differfing body weight set pointsin diet-induced obese and resistant rats. Am J Physiol - Regul Integr Comp Physiol 2023;274;R412-R419.
https://doi.org/10.1152/ajpregu.1998.274.2.R412 |
| 11 | Akieda-Asai S, Koda S, Sugiyama M, Hasegawa K, Furuya M, Miyazato M, Date Y: Metabolic features of rats resistant to a high-fat diet. Obes Res Clin Pract 2013;7;e243-e250.
https://doi.org/10.1016/j.orcp.2013.01.004 |
| 12 | Levin BE, Sullivan AC: Differences in saccharin-induced cerebral glucose utilization between obesity-prone and -resistant rats. Brain Res 1989;488;221-232.
https://doi.org/10.1016/0006-8993(89)90712-9 |
| 13 | Jackman MR, MacLean PS, Bessesen DH: Energy expenditure in obesity-prone and obesity-resistant rats before and after the introduction of a high-fat diet. Am J Physiol Regul Integr Comp Physiol 2010;299.
https://doi.org/10.1152/ajpregu.00549.2009 |
| 14 | Maioli TU, Gonçalves JL, Miranda MCG, Martins VD, Horta LS, Moreira TG, Godard ALB, Santiago AF, Faria AMC: High sugar and butter (HSB) diet induces obesity and metabolic syndrome with decrease in regulatory T cells in adipose tissue of mice. Inflamm Res 2016; 65;169-178.
https://doi.org/10.1007/s00011-015-0902-1 |
| 15 | Shadel GS, Horvath TL: Mitochondrial ROS Signaling in Organismal Homeostasis. Cell 2015;163;560-569.
https://doi.org/10.1016/j.cell.2015.10.001 |
| 16 | Milagro FI, Campión J, Martíez JA: Weight gain induced by high-fat feeding involves increased liver oxidative stress. Obesity 2006;14;1118-1123.
https://doi.org/10.1038/oby.2006.128 |
| 17 | Yu Y, Li Z, Cao G, Huang S, Yang H: Bamboo Leaf Flavonoids Extracts Alleviate Oxidative Stress in HepG2 Cells via Naturally Modulating Reactive Oxygen Species Production and Nrf2-Mediated Antioxidant Defense Responses. J Food Sci 2019;84;1609-1620.
https://doi.org/10.1111/1750-3841.14609 |
| 18 | Rosini TC, da Silva ASRD, Moraes CD: Diet-induced obesity: Rodent model for the study of obesity-related disorders. Rev Assoc Med Bras 2012;58;383-387.
https://doi.org/10.1016/S0104-4230(12)70211-7 |
| 19 | Buettner R, Newgard CB, Rhodes CJ, O'Doherty R: Correction of diet-induced hyperglycemia, hyperinsulinemia, and skeletal muscle insulin resistance by moderate hyperleptinemia. Am J Physiol Endocrinol Metab 2000; 278;E563-E569.
https://doi.org/10.1152/ajpendo.2000.278.3.E563 |
| 20 | Barbosa KBF, Costa NMB, Alfenas RDCG, De Paula SO, Minim VPR, Bressan J: Oxidative stress: concept, implications and modulating factors. Rev Nutr 2010;23;629-43.
https://doi.org/10.1590/S1415-52732010000400013 |
| 21 | Ferreira ICFR, Abreu RMV: Stress Oxidativo, Antioxidantes e Fitoquímicos. Bioanálise 2007;2;32-39.
https://doi.org/10.5628/rpcd.07.02.257 |
| 22 | Ferreira ALA, Matsubara LS: Radicais livres: conceitos, doenças relacionadas, sistema de defesa e estresse oxidativo. Rev Assoc Med Bras 1997;43;61-68.
https://doi.org/10.1590/S0104-42301997000100014 |
| 23 | De Farias JM, Bom KF, Tromm CB, Luciano TF, Marques SO, Tuon T, Silva LA, Lira FS, de Souza CT, Pinho RA: Effect of physical training on the adipose tissue of diet-induced obesity mice: Interaction between reactive oxygen species and lipolysis," Horm Metab Res 2013;45;190-196.
https://doi.org/10.1055/s-0032-1323740 |
| 24 | Mangge H, Becker K, Fuchs D, Gostner JM: Antioxidants, inflammation and cardiovascular disease. World J Cardiol 2014;6;462.
https://doi.org/10.4330/wjc.v6.i6.462 |
| 25 | Usman M, Volpi EV: DNA damage in obesity: Initiator, promoter and predictor of cancer. Mutat Res Rev Mutat Res 2018;778;23-37.
https://doi.org/10.1016/j.mrrev.2018.08.002 |
| 26 | Halliwell B, Whiteman M: Measuring reactive species and oxidative damage in vivo and in cell culture: How should you do it and what do the results mean?. Br J Pharmacol 2004;142;231-255.
https://doi.org/10.1038/sj.bjp.0705776 |
| 27 | Mellor KM, Ritchie RH, Delbridge LM: Reactive oxygen species and insulin-resistant cardiomyopathy. Clin Exp Pharmacol Physiol 2010;37;222-228.
https://doi.org/10.1111/j.1440-1681.2009.05274.x |
| 28 | Lushchak VI: Free radicals, reactive oxygen species, oxidative stress and its classification. Chem Biol Interact 2014;224;164-175.
https://doi.org/10.1016/j.cbi.2014.10.016 |
| 29 | Faine LA, Diniz YS, Almeida JA, Novelli ELB, Ribas BO: Toxicity of ad lib. overfeeding: effects on cardiac tissue. Food Chem Toxicol 2002;40;663-668.
https://doi.org/10.1016/S0278-6915(02)00004-2 |
| 30 | Novelli ELB, Dr AF, Campos KE, Diniz YS, Almeida JA, Faine LA, Ribas BO: The Adverse Effect of a High Energy Dense Diet on Cardiac Tissue. J Nutr Environ Med 2002;12;287-294.
https://doi.org/10.1080/1359084021000036774 |
| 31 | Burneiko RC, Diniz YS, Galhardi CM, Rodrigues HG, Ebaid GM, Faine LA, Padovani CR, Cicogna AC, Novelli ELB: Interaction of hypercaloric diet and physical exercise on lipid profile, oxidative stress and antioxidant defenses. Food Chem Toxicol 2006;44;1167-1172.
https://doi.org/10.1016/j.fct.2006.01.004 |
| 32 | Hunter I, Soler A, Joseph G, Hutcheson B, Bradford C, Zhang FF, Potter B, Proctor Spencer, Rocic P: Cardiovascular function in male and female JCR:LA-cp rats: effect of high-fat/high-sucrose diet. Am J Physiol Heart Circ Physiol 2017;312;742-751.
https://doi.org/10.1152/ajpheart.00535.2016 |
| 33 | Yu HT, Fu XY, Liang B, Wang S, Liu JK, Wang SR, Feng ZH: Oxidative damage of mitochondrial respiratory chain in different organs of a rat model of diet-induced obesity. Eur J Nutr 2018;57;1957-1967.
https://doi.org/10.1007/s00394-017-1477-0 |
| 34 | Menon V, Ram M, Dorn J, Armstrong D, Muti P, Freudenheim JL, Browne R, Schunemann H, Trevisan M: Oxidative stress and glucose levels in a population-based sample. Diabet Med 2004;21;1346-1352.
https://doi.org/10.1111/j.1464-5491.2004.01417.x |
| 35 | Furukawa S, Fujita T, Shimabukuro M, Iwaki M, Yamada Y, Nakajima Y, Nakayama O, Makishima M, Matsuda M, Shimomura I: Increased oxidative stress in obesity and its impact on metabolic syndrome. J Clin Investig 2004;114;1752-1761.
https://doi.org/10.1172/JCI21625 |
| 36 | Andersen LF, Jacobs DR, Gross MD, Schreiner PJ, Williams OD, Lee DH: Longitudinal associations between body mass index and serum carotenoids: the CARDIA study. Br J Nutr2006;95;358-365.
https://doi.org/10.1079/BJN20051638 |
| 37 | Martínez JA: Mitochondrial oxidative stress and inflammation: an slalom to obesity and insulin resistance. J Physiol Biochem 2006;62;303-306.
https://doi.org/10.1007/BF03165759 |
| 38 | Panth N, Paudel KR, Parajuli K: Reactive Oxygen Species: A Key Hallmark of Cardiovascular Disease. Adv Med 2016;2016;1-12.
https://doi.org/10.1155/2016/9152732 |
| 39 | Azevedo PS, Polegato BF, Minicucci MF, Paiva SA, Zornoff LA: Cardiac Remodeling: Concepts, Clinical Impact, Pathophysiological Mechanisms and Pharmacologic Treatment. Arq Bras Cardiol 2016;106;62-69.
https://doi.org/10.5935/abc.20160005 |
| 40 | Vellosa JCR, Biavatti M, Françóia PCO, de Mello BJ, de Almeida AC, Bueno GE: Estresse oxidativo: uma introdução ao estado da arte. Braz. J. Dev 2021;7;10152-10168.
https://doi.org/10.34117/bjdv7n1-688 |
| 41 | Camera FD, Pozzi BG, Paganini CS, Sorato HR, Tavares F, Pereira BC, Pedroso GS, Roman SS, Silveira PCL, Nesi RT, Pinho RA: Cardioprotective effects of physical exercise on redox biology in mice exposed to hand-rolled cornhusk cigarette smoke. Arch Biochem Biophys2019;661;50-55.
https://doi.org/10.1016/j.abb.2018.11.003 |
| 42 | Doroszko A, Dobrowolski P, Radziwon-Balicka A, Skomro R: New insights into the role of oxidative stress in onset of cardiovascular disease. Oxid Med Cell 2018;2018.
https://doi.org/10.1155/2018/9563831 |
| 43 | Malekmohammad K, Sewell RD, Rafieian-Kopaei M: Antioxidants and atherosclerosis: Mechanistic aspects. Biomolecules 2019;9;301.
https://doi.org/10.3390/biom9080301 |
| 44 | Howard BV, Bogardus C, Ravussin E, Foley JE, Lillioja S, Mott DM, Bennett PH, Knowler WC: Studies of the etiology of obesity in Pima Indians. Am J Clin Nutr 1991;53;1577S-1585S.
https://doi.org/10.1093/ajcn/53.6.1577S |
| 45 | Kotz CM, Teske JA, Billington CJ: Neuroregulation of nonexercise activity thermogenesis and obesity resistance. Am J Physiol Regul Integr Comp Physiol 2008;294;699-710.
https://doi.org/10.1152/ajpregu.00095.2007 |
| 46 | Rolls BJ, Shide DJ: The Influence of Dietary Body Weight. Nutr Rev 1992;50;283-290.
https://doi.org/10.1111/j.1753-4887.1992.tb02466.x |
| 47 | Taylor BA, Phillips SJ: Detection of Obesity QTLs on Mouse Chromosomes 1 and 7 by Selective DNA Pooling. Genomics 1996;34;389-398.
https://doi.org/10.1006/geno.1996.0302 |
| 48 | Yin FC, Spurgeon HA, Rakusan KAREL, Weisfeldt ML, Lakatta EG: Use of tibia1 length to quantify cardiac hypertrophy: application in the aging rat. Am J Physiol Heart Circ Physiol 1982;243;H941-H947.
https://doi.org/10.1152/ajpheart.1982.243.6.H941 |
| 49 | Owusu-Ansah E, Yavari A, Banerjee U: A protocol for in vivo detection of reactive oxygen species. 2008. doi: 10.1038/nprot.2008.23.
https://doi.org/10.1038/nprot.2008.23 |
| 50 | Uchiyama M, Mihara M: Determination of Malonaldehyde Precursor in Tissues by Thiobarbituric Acid Test. Anal Biochem 1978;86;271-278.
https://doi.org/10.1016/0003-2697(78)90342-1 |
| 51 | Samarghandian S, Farkhondeh T, Samini F, Borji A: Protective Effects of Carvacrol against Oxidative Stress Induced by Chronic Stress in Rat's Brain, Liver, and Kidney. Biochem Res Int 2016;2016.
https://doi.org/10.1155/2016/2645237 |
| 52 | Mesquita CS, Oliveira R, Bento F, Geraldo D, Rodrigues JV, Marcos JC: Simplified 2, 4-dinitrophenylhydrazine spectrophotometric assay for quantification of carbonyls in oxidized proteins," Anal Biochem 2014;458;69-71.
https://doi.org/10.1016/j.ab.2014.04.034 |
| 53 | Buettner R, Schölmerich J, Bollheimer LC: High-fat diets: Modeling the metabolic disorders of human obesity in rodents. Obesity 2007;15;798-808.
https://doi.org/10.1038/oby.2007.608 |
| 54 | Lima-Leopoldo AP, Leopoldo AS, Da Silva DC, do Nascimento AF, de Campos DH, Luvizotto RAM, de Deus AF, Freire PP, Medeiros A, Okoshi Katashi, Cicogna AC: Long-term obesity promotes alterations in diastolic function induced by reduction of phospholamban phosphorylation at serine-16 without affecting calcium handling. J Appl Physiol 2014;117;669-678.
https://doi.org/10.1152/japplphysiol.00088.2014 |
| 55 | da Silva VL, Lima-Leopoldo AP, Ferron AJT, Cordeiro JP, Freire PP, de Campos DHS, Padovani AR, Sugizaki MM, Cicogna AC, Leopoldo AS: Moderate exercise training does not prevent the reduction in myocardial L-type Ca2+ channels protein expression at obese rats. Physiol Rep 2017;5;e13466.
https://doi.org/10.14814/phy2.13466 |
| 56 | Akieda-Asai S, Koda S, Sugiyama M, Hasegawa K, Furuya M, Miyazato M, Date Y: Metabolic features of rats resistant to a high-fat diet. Obes Res Clin Pract 2013;7;e243-e250.
https://doi.org/10.1016/j.orcp.2013.01.004 |
| 57 | Choi JW, Wang X, Joo JI, Kim DH, Oh TS, Choi DK, Yun JW: Plasma proteome analysis in diet-induced obesity-prone and obesity-resistant rats. Proteomics 2010;10;4386-4400.
https://doi.org/10.1002/pmic.201000391 |
| 58 | Chang S, Graham BRENT, Yakubu FATIMA, lin DING, Peters JC, Hill JO: Metabolic differences between obesity-prone and obesity-resistant rats. Am J Physiol Regul Integr Comp Physiol 1990;259;R1103-R1110.
https://doi.org/10.1152/ajpregu.1990.259.6.R1103 |
| 59 | Levin BE, Dunn-Meynell AA, Ricci MR, Cummings DE: Abnormalities of leptin and ghrelin regulation in obesity-prone juvenile rats. Am J Physiol Endocrinol Metab 2003;285;48-5.
https://doi.org/10.1152/ajpendo.00186.2003 |
| 60 | MacLean PS, Higgins JA, Johnson GC, Fleming-Elder BK, Donahoo WT, Melanson EL, Hill JO: Enhanced metabolic efficiency contributes to weight regain after weight loss in obesity-prone rats. Am J Physiol Regul Integr Comp Physiol 2004;287;R1306-R1315.
https://doi.org/10.1152/ajpregu.00463.2004 |
| 61 | Boozer CN, Lauterio TJ: High initial levels of plasma leptin predict diet-induced obesity in rats. Int J Obes 1998;22;S166.
|
| 62 | Huang XF, Han M, Storlien LH: The level of NPY receptor mRNA expression in diet-induced obese and resistant mice. Brain Res Mol Brain Res 20003;115;21-28.
https://doi.org/10.1016/S0169-328X(03)00174-8 |
| 63 | Levin BE, Keesey RE: Defense of differing body weight set points in diet-induced obese and resistant rats. Am J Physiol Regul Integr Comp Physiol 1998;274;R412-R419.
https://doi.org/10.1152/ajpregu.1998.274.2.R412 |
| 64 | Poirier P, Giles TD, Bray GA, Hong Y, Stern JS, Pi-Sunyer FX, Eckel RH: Obesity and cardiovascular disease: Pathophysiology, evaluation, and effect of weight loss: An update of the 1997 American Heart Association Scientific Statement on obesity and heart disease from the Obesity Committee of the Council on Nutrition, Physical Activity, and Metabolism. Circulation 2006;113;898-918.
https://doi.org/10.1161/CIRCULATIONAHA.106.171016 |
| 65 | Calabro P, Limongelli G, Pacileo G, Di Salvo G, Golino P, Calabro R: The role of adiposity as a determinant of an inflammatory milieu. J Cardiovasc Med 2008;9;450-460.
https://doi.org/10.2459/JCM.0b013e3282eee9a8 |
| 66 | Ghigliotti G, Barisione C, Garibaldi S, Fabbi P, Brunelli C, Spallarossa P, Altieri P, Rosa G, Spinella G, Palombo D, Arsenescu R, Arsenescu V: Adipose tissue immune response: Novel triggers and consequences for chronic inflammatory conditions. Inflamm Res2014;37;1337-1353.
https://doi.org/10.1007/s10753-014-9914-1 |
| 67 | Commerford SR, Pagliassotti MJ, Melby CL, Wei Y, Gayles EC, Hill JO: Fat oxidation, lipolysis, and free fatty acid cycling in obesity-prone and obesity-resistant rats. Am J Physiol Endocrinol Metab 2000;279;E875-E885.
https://doi.org/10.1152/ajpendo.2000.279.4.E875 |
| 68 | Joo JI, Oh TS, Kim, DH, Coi DK, Wang X, Choi JW, Yun JW: Differential expression of adipose tissue proteins between obesity-susceptible and -resistant rats fed a high-fat diet. J Proteomics 2011;11;1429-1448.
https://doi.org/10.1002/pmic.201000515 |
| 69 | Prasun P: Mitochondrial dysfunction in metabolic syndrome. Biochim Biophys Acta 2020;1866;165838.
https://doi.org/10.1016/j.bbadis.2020.165838 |
| 70 | Fahed G, Aoun L, Bou Zerdan M, Allam S, Bou Zerdan M, Bouferraa Y, Assi HI: Metabolic Syndrome: Updates on Pathophysiology and Management in 2021. Int J Mol Sci 2022;23;786.
https://doi.org/10.3390/ijms23020786 |
| 71 | Matsuzawa Y, Funahashi T, Nakamura T: The Concept of Metabolic Syndrome: Contribution of Visceral Fat Accumulation and Its Molecular Mechanism. J Atheroscler Thromb 2011;18;629-639.
https://doi.org/10.5551/jat.7922 |
| 72 | Pekgor S, Duran C, Berberoglu U, Eryilmaz MA: The role of visceral adiposity index levels in predicting the presence of metabolic syndrome and insulin resistance in overweight and obese patients. Metab Syndr Relat Disord 2019;17;296-302.
https://doi.org/10.1089/met.2019.0005 |
| 73 | Sá FGDSD, Lima-Leopoldo AP, Jacobsen BB, Ferron AJT, Estevam WM, Campos DHS, Castardeli E, da Cunha MRH, cicogna AC, Leopoldo AS: Resistência à obesidade promove disfunção contrátil leve associada com trânsito Ca2+ intracelular. Arq Bras Cardiol 2015;105;588-596.
|
| 74 | Correia ML, Rahmouni K: Role of leptin in the cardiovascular and endocrine complications of metabolic syndrome. Diabetes Obes Metab 2006;8;603-610.
https://doi.org/10.1111/j.1463-1326.2005.00562.x |
| 75 | Frühbeck G, Catalán V, Rodríguez A, Ramírez B, Becerril S, Salvador J, Portincasa P, Colina I, Gómez-Ambrosi J: Involvement of the leptin-adiponectin axis in inflammation and oxidative stress in the metabolic syndrome. Sci Rep 2017;7;6619.
https://doi.org/10.1038/s41598-017-06997-0 |
| 76 | Caro JF, Kolaczynski JW, Nyce MR, Ohannesian J, Opentaniva I, Goldman WH, Lynn RB, Zhang P, Sinha MK, Considine RV: Decreased cerebrospinal-fluid/serum leptin ratio in obesity: apossible mechanism for leptin resistance. The Lancet 1996;348;159-61.
https://doi.org/10.1016/S0140-6736(96)03173-X |
| 77 | dos Santos Pinho KH, De Paiva MJ, de Carvalho Oliveira RA: Leptina e adiponectina: papel dos hormônios nos processos metabólicos e impactos na sua desregulação. Res Soc Dev 2022;11;e34711225144.
https://doi.org/10.33448/rsd-v11i2.25144 |
| 78 | do Carmo Martins M, Faleiro LL, Fonseca A: Relação entre a leptina, a massa corporal e a síndrome metabólica numa amostra da população adulta. Rev Port Cardiol 2012;31; 711-719.
https://doi.org/10.1016/j.repc.2012.08.002 |
| 79 | Bravo PE, Morse S, Borne DM, Aguilar EA, Reisin E: Leptin and Hypertension in Obesity, Vascular Health and Risk Management. Vasc Health Risk Manag 2006;2;163-169.
https://doi.org/10.2147/vhrm.2006.2.2.163 |
| 80 | Zieba DA, Biernat W, Barć J: Roles of leptin and resistin in metabolism, reproduction, and leptin resistance. Domest Anim Endocrinol 2020;73;106472.
https://doi.org/10.1016/j.domaniend.2020.106472 |
| 81 | Ahré BO, Havel PJ: Leptin inhibits insulin secretion induced by cellular cAMP in a pancreatic B cell line (INS-1 cells). Am J Physiol Regul Integr Comp Physiol 1999;277; R959-R966.
https://doi.org/10.1152/ajpregu.1999.277.4.R959 |
| 82 | Schirone L, Forte M, Palmerio S, Yee D, Nocella C, Angelini F, Pagano F, Schiavon S, Bordin A, Carrizzo A, Vecchione C, Valenti V, Chiment I, De Falco E, Sciarretta S, Frati G: A Review of the Molecular Mechanisms Underlying the Development and Progression of Cardiac Remodeling. Oxid Med Cell Longev 2017;2017.
https://doi.org/10.1155/2017/3920195 |
| 83 | Pereira BLB: Influência da suplementação de tomate e licopeno na remodelação cardíaca após infarto agudo do miocárdio, 2015.
|
| 84 | Francischi RPPD, Pereira LO, Freitas CS, Klopfer M, Santos RC, Vieira P, Lancha Júnior AH: Obesidade: Atualização Sobre Sua Etiologia, Morbidade e Tratamento. Rev de Nutr 2000;13;17-28.
https://doi.org/10.1590/S1415-52732000000100003 |
| 85 | Oliveira SMD, Garcia JL, Vileigas DF, Campos DHSD, Francisqueti-Ferron FV, Ferron AJT, Silva-Bertani DCT, Padovani CR, Corrêa CR, Cicogna AC: Cardiac Remodeling in Obesity-Resistance Model is not Related to Collagen I and III Protein Expression. Int j cardiovasc Sci 2021.
https://doi.org/10.36660/ijcs.20200058 |
| 86 | Nickel A, Kohlhaas M, Maack C: Mitochondrial reactive oxygen species production and elimination. J Mol Cell Cardiol 2014;73;26-33.
https://doi.org/10.1016/j.yjmcc.2014.03.011 |
| 87 | Balaban RS, Nemoto S, Finkel T: Mitochondria, oxidants, and aging. Cell 2005;120;483-495.
https://doi.org/10.1016/j.cell.2005.02.001 |
| 88 | Peoples JN, Saraf A, Ghazal N, Pham TT, Kwong JQ: Mitochondrial dysfunction and oxidative stress in heart disease. Exp Mol Med 2019;51;1-13.
https://doi.org/10.1038/s12276-019-0355-7 |
| 89 | Burgoyne JR, Mongue-Din H, Eaton P, Shah AM: Redox signaling in cardiac physiology and pathology. Circ Res 2012;111;1091-1106.
https://doi.org/10.1161/CIRCRESAHA.111.255216 |
| 90 | Richardson AG, Schadt EE: The role of macromolecular damage in aging and age-related disease. J Gerontol A Biol Sci Med Sci 2014;69;S28-S32.
https://doi.org/10.1093/gerona/glu056 |
| 91 | Mahattanatawee K, Manthey JA, Luzio G, Talcott ST, Goodner K, Baldwin EA: Total antioxidant activity and fiber content of select Florida-grown tropical fruits. J Agric Food Chem 2006;54;7355-7363.
https://doi.org/10.1021/jf060566s |
| 92 | Aust O, Sies H, Stahl W, Polidori MC: Analysis of lipophilic antioxidants in human serum and tissues: tocopherols and carotenoids. J Chromatogr A 2001;936;83-93.
https://doi.org/10.1016/S0021-9673(01)01269-9 |
| 93 | Zhang Y , Chen X: Reducing selenoprotein P expression suppresses adipocyte differentiation as a result of increased preadipocyte inflammation. Am J Physiol Endocrinol Metab 2011;300;77-85.
https://doi.org/10.1152/ajpendo.00380.2010 |
| 94 | Róvero Costa M, leite Garcia J, Cristina Vágula de Almeida Silva C, Junio Togneri Ferron A, Valentini Francisqueti-Ferron F, Kurokawa Hasimoto F, Gregolin CS, de Campos DHS, de Andrade CR, dos Anjos Ferreira AL, Corrêa CR, Moreto F: Lycopene modulates pathophysiological processes of non-alcoholic fatty liver disease in obese rats. Antioxidants 2019;8;276.
https://doi.org/10.3390/antiox8080276 |
| 95 | El-Sayed MESY, Elsanhoty RM, Ramadan MF: Impact of dietary oils and fats on lipid peroxidation in liver and blood of albino rats. Asian Pac J Trop Biomed 2014;4;52-58.
https://doi.org/10.1016/S2221-1691(14)60208-2 |
| 96 | Pakiet A, Jakubiak A, Mierzejewska P, Zwara A, Liakh I, Sledzinski T, Mika A: The effect of a high-fat diet on the fatty acid composition in the hearts of mice. Nutrients 2020;12;824.
https://doi.org/10.3390/nu12030824 |
| 97 | Buckingham KW: Effect of Dietary Polyunsaturated/Saturated Fatty Acid Ratio and Dietary Vitamin E on Lipid Peroxidation in the Rat. J Nutr 1985;115;1425-1435.
https://doi.org/10.1093/jn/115.11.1425 |
| 98 | Thomas MJ, Rudel LL: Symposium: Dietary fatty acids, low density lipoprotein composition and oxidation and primate atherosclerosis. J Nutr 1996;126;1058S-1062S.
https://doi.org/10.1093/jn/126.suppl_4.1058S |
| 99 | Thomas MJ, Thornburg T, Manning J, Hooper K, Rudelt LL: Fatty acid composition of low-density lipoprotein influences its susceptibility to autoxidation. Biochemistry 1994;33;1828-1834.
https://doi.org/10.1021/bi00173a028 |
| 100 | Dalle-Donne I, Aldini G, Carini M, Colombo R, Rossi R, Milzani A: Protein carbonylation, cellular dysfunction, and disease progression. J Cell Mol Med 2006;10;389-406.
https://doi.org/10.1111/j.1582-4934.2006.tb00407.x |