×
![]()
Corresponding Author: Suhail Al-Salam
Department of Pathology, College of Medicine and Health Sciences,
United Arab Emirates University, Al Ain, PO Box 17666 (UAE)
Tel. +97137137464, Fax +97137671966 , E-Mail suhaila@uaeu.ac.ae
Galectin-3 Possesses Anti-Necroptotic and Anti-Apoptotic Effects in Cisplatin-Induced Acute Tubular Necrosis
Suhail Al-Salama Govindan S. Jagadeesha Manjusha Sudhadevia Heba Tageldeena Javed Yasinb
aDepartment of Pathology, College of Medicine and Health Sciences, United Arab Emirates University, Al-Ain, UAE, bDepartment of Internal Medicine, College of Medicine and Health Sciences, United Arab Emirates University, Al-Ain, UAE
Introduction
Acute kidney injury (AKI) is characterized by an abrupt reduction in kidney function based on an elevation in serum creatinine level, a reduction in urine output, the need for renal replacement therapy, or a combination of these factors [1].
The Kidney Disease Improving Global Outcome (KDIGO) clinical practice guideline for AKI, defines AKI as either an increase in serum creatinine by ≥0.3 mg/dl (≥26.5 µmol/l) within 48 hours; or increase in serum creatinine to ≥1.5 times baseline, which is known or presumed to have occurred within the prior 7 days; or urine volume <0.5 ml/kg/h for 6 hours [2].
Acute tubular necrosis (ATN) is a common cause of AKI [3]. Ischemic and nephrotoxic offends are the main causes of ATN [3]. Despite extensive studies on ATN, which include cell injury, cell death and regeneration, the underlying mechanisms are not clearly defined.
Apoptosis is a form of programmed cell death mediated by caspases. Significant reports have shown apoptosis to play an important role in ATN [3, 4]. On the other hand, necrosis is a form of cell death characterized by early plasma membrane permeabilization, organelle swelling and disintegration of cellular contents [5]. Necrosis frequently occurs when cells are challenged with excessive external stress. Necrosis has been traditionally regarded as passive and unprogramed; hence, very little efforts had been made to investigate the mechanism of necrosis, despite of its prevalence in human diseases [5]. A well-recognized type of necrosis is necroptosis [5]. Necroptosis is a programmed non-apoptotic cell death induced by a number of extracellular stimuli, such as tumour necrosis factor (TNF) [5]. It was originally defined as cell death characterized by necrotic cell death morphology with concomitant activation of receptor-interacting serine/threonine-protein kinase 1 (RIPK1). RIPK1 activates receptor-interacting serine/threonine-protein kinase 3 (RIPK3) to form a complex that is called necrosome [6]. Later, the activated RIPK3 gains the ability to phosphorylate and activate mixed lineage kinase domain-like (MLKL) [6]. Phosphorylated MLKL molecules are able to form oligomers to facilitate their translocation to cell membrane through binding to phosphatidylinositol lipids and cardiolipin. The translocated MLKL oligomers act as channels in cell membrane to induce either influx of sodium and efflux of potassium ions [7], or alternatively influx of calcium ions [8]. In both ways this will lead to necrotic cell death through plasma membrane permeabilization and rupture, leading to spilling of the intracellular content into the organ.
In this project we have used cisplatin (Cis) to induce acute tubular necrosis. Cis has a wide range of anti-tumor effects and has been used to treat various malignant tumors [9]. Nevertheless, nephrotoxicity is the main side effect and characterized by renal tubular cell necrosis, tissue damage, renal dysfunction, and acute kidney failure [10]. Despite various measures have been taken to overcome kidney injury, almost 4–23% of patients are affected by AKI [11]. The known mechanisms of cisplatin-induced renal injury include apoptosis, oxidative stress, and inflammatory response due to direct injury to renal tubular epithelial cells and renal vessels [12].
Galectin-3 (GAL-3), 35 kDa protein, is a unique chimera-like that has one C-terminal carbohydrate recognition domain (CRD) connected to a long N-terminal domain (ND) [13].
GAL-3 is found on the cell surface, cytoplasm and the nucleus of cells as well as in extracellular matrix [13].
Intracellular GAL-3 has been involved in cell proliferation and anti-apoptotic mechanisms [14, 15]. It affects K-Ras and Akt proteins and so also regulates differentiation survival, and death [14, 15]. While, extracellular GAL-3 mediates cell-cell adhesion, cell-matrix interaction and signaling, inflammation and apoptosis [16].
GAL-3 has been shown to translocate either from the cytosol or from the nucleus to the mitochondria following exposure to apoptotic stimuli and to block changes in the mitochondrial membrane potential, thereby preventing apoptosis [17]. Studies have also shown that GAL-3 can inhibit TNF-induced apoptosis through activation of AKT [18]. Other studies have shown GAL-3 and Beclin1 are involved in two coordinated pathways of programmed cell death, apoptosis and autophagy [18]. In this project, we hypothesize that GAL-3 has a protective role on renal tubular epithelium in acute tubular injury. We have used a murine model of acute tubular injury to investigate the protective role of GAL-3 in cisplatin induced acute tubular injury through measuring renal functions (plasma urea and creatinine), kidney necroptosis proteins (RIP-1, RIP-3, and MLKL), necrosis proteins (Cathepsin D and Cathepsin B), apoptosis proteins (cleaved Caspase-3, cleaved PARP, TRAIL and FAS), and cells survival markers (p-NF-κB, beta catenin, and Wnt), using standard enzyme linked immunosorbent assay, biochemical analyzer, histologic and immunohistochemical procedures.
Materials and Methods
We have used a mouse experimental model of acute kidney injury which has been extensively described in literature and used for studying acute kidney injury in laboratories worldwide [19].
Mouse model of acute tubular necrosis
C57BL/6 and C57BL/6 –GAL-3 knock-out (KO) mice weighing 25-30 g were used. Mice were maintained on a standard diet. Mice were housed five per cage under a 12-h light and dark schedule for at least 1 week before Cisplatin administration.
Cisplatin (EBEWE Pharma GmbH Nfg. KG, Unterach, AUSTRIA) was freshly used the day of administration at a concentration of 0.5 mg/ml. Mice were given either 30 mg/kg body weight of
Cisplatin [11] or vehicle (normal saline) intraperitoneal (IP), after which the mice again had free access to food and water. The method of euthanasia started with intraperitoneal injection of anesthetic drugs, which included a combination of Ketamine (100 mg/kg) and Xylazine (10 mg/kg), then kidneys were removed and blood samples were collected 96 hours after cisplatin administration. Blood was collected in EDTA vacutainers. Kidneys were then resected, washed in ice cold phosphate buffered saline (PBS), one half of each kidney was immediately frozen in liquid nitrogen and later stored in −80°C freezer. The other half was immediately fixed in 10% buffered formal saline for 24 hours. Collected blood was centrifuged at 3000 RPM for 15 minutes. The plasma was collected, alliquoted and stored at −80°C until further analysis.
Sample Processing for Protein Extraction
Total protein was extracted from kidney samples by homogenizing with lysis buffer and collecting the supernatant after centrifugation. For total cell lysate, the kidney samples were thawed, weighed and put in cold lysis buffer containing 50 mM Tris, 300 mM NaCl, 1 mM MgCl2, 3 mM EDTA, 20 mM β-glycerophosphate, 25 mM NaF, 1% Triton X-100, 10%w/v Glycerol and protease inhibitor tablet (Roche Complete protease inhibitor cocktail tablets). The kidneys were homogenized on ice by a homogenizer (IKA T25 Ultra Turrax). The samples were then centrifuged at 14000 RPM for 15 minutes at 4°C, supernatant collected, alliquoted and stored at −80°C until further analysis. Nuclear and cytoplasmic protein extraction were done following the protocol described elsewhere [19]. Briefly, the kidney samples were thawed on ice, weighed and homogenized on ice with buffer containing Tris HCl 10 mmol/l, CaCl2 3 mmol/l, MgCl2 2 mmol/l, EDTA 0.1 mmol/l, Phenylmethanesulfonyl fluoride (PMSF) 0.5 mmol/l, Sucrose 0.32 mmol/l, Dithiothreitol (DTT) 1 mmol/l, Nonidet P-40 (NP-40) 0.5% and Protease inhibitor cocktail 1%. The homogenates were centrifuged at 800 RPM for 10 minutes. The supernatant were removed and kept as cytoplasmic fraction. The pellet was washed twice with homogenization buffer without NP-40 and resuspended with a low salt buffer containing HEPES 20 mmol/l, MgCl2 1.5 mmol/l, KCl 20 mmol/l, EDTA 0.2 mmol/l. Glycerol 25%, PMSF 0.5 mmol/l and DTT 0.5 mmol/l. After incubation on ice for 5 minutes, an equal volume of high salt buffer containing HEPES 20 mmol/l, MgCl2 1.5 mmol/l, KCl 800 mmol/l, EDTA 0.2 mmol/l. Glycerol 25%, PMSF 0.5 mmol/l, DTT 0.5 mmol/l, NP-40 1% and protease inhibitor cocktail 1%, were added, the mixture incubated on ice for 30 minutes, centrifuged at 14000 RPM for 15 minutes at 4°C and supernatants were saved as the nuclear fraction. Total protein concentration was determined by BCA protein assay method (Thermo Scientific Pierce BCA Protein Assay Kit).
Sample Processing for Histology
Kidneys were excised, washed with ice-cold PBS and weighed. Each kidney was sectioned into two halves, and each half was cassetted and fixed directly in 10% buffered formalin. Sections were dehydrated in increasing concentrations of ethanol, cleared with xylene and embedded with paraffin. Three-µm sections were prepared from paraffin blocks and stained with haematoxylin and eosin and periodic acid Schiff (PAS) stains using standard procedures [20]. The stained sections were evaluated by the histopathologist that participated in this project.
Immunohistochemistry
Five-µm sections were deparaffinized with xylene and rehydrated with graded alcohol. Sections were then placed in Retrieval Solution with a high pH (pH 9) in a water bath at 95oC for 20 minutes. Sections were then washed with distilled water for 5 minutes followed by TBST buffer for 5 minutes. Sections were then treated with peroxidase block for 10 minutes followed by protein block for 10 minutes. Sections were then incubated for one hour at room temperature with anti-cleaved caspase-3 antibody (Rabbit Polyclonal, 1:300, Cell signaling technology, Danvers, MA USA), anti-cleaved PARP antibody (Rabbit Polyclonal, 1:100, Cell signaling technology, Danvers, MA, USA), anti-beta-catenin antibody (Rabbit Polyclonal, 1:100, Abcam, Cambridge, MA, USA), anti-phospho-NF-κB antibody (Rabbit Polyclonal, 1:100, Abcam, Cambridge, MA, USA), anti-Wnt-3 (Rabbit Polyclonal, 1:100, Abcam, Cambridge, MA, USA), anti-RIPK1 (Rabbit polyclonal,1:100, Thermo Scientific, Waltham, MA, USA), anti-RIPK3 (Rabbit polyclonal,1:100, Thermo Scientific, Waltham, MA, USA), and anti-MLKL 1 (Rabbit monoclonal, 1:100, Thermo Scientific, Waltham, MA, USA). After conjugation with primary antibodies, sections were incubated with secondary antibody (EnVisionTM Detection System, DAKO, Agilent, USA) for 20 minutes at room temperature followed by addition of DAB chromogen (EnVisionTM Detection System, DAKO, Agilent, Santa Clara, CA, USA) and counter staining done with haematoxylin. Appropriate positive controls were used. For negative control, the primary antibody was not added to sections. Positive and negative controls were used in every batch of stained slides (not shown in figures).
Immunofluorescent labeling
Five-μm sections were deparaffinized with xylene and rehydrated with graded alcohol. Sections were placed in Retrieval Solution with a high pH (pH 9) in a water bath at 95°C for 20 minutes. Sections were then washed with distilled water for 5 minutes followed by TBST buffer for 5 minutes. Sections were then incubated with anti-GAL-3 antibody (Rabbit Polyclonal,1:50, Santa Cruz Biotechnology, Dallas, Texas, USA), anti-RIPK1 (Rabbit polyclonal,1:50, Thermo Scientific, Thermo Scientific, Waltham, MA, USA), anti-RIPK3 1 (Rabbit polyclonal,1:50, Thermo Scientific, Thermo Scientific, Waltham, MA, USA), and anti-MLKL 1 (Rabbit monoclonal, 1:50, Thermo Scientific, Thermo Scientific, Waltham, MA, USA) overnight at room temperature. Sections were subsequently incubated with donkey anti-rabbit Alexa Fluor 488, (Jackson Immune Research Laboratories, Bar Harbor, Maine, USA, 1:100) antibody. Finally, sections were mounted in DAPI-water-soluble mounting media (Abcam, Cambridge, MA, USA) and viewed with Olympus Fluorescent microscope. Appropriate positive control sections were used. For negative control, the primary antibody was not added to sections and the whole procedure carried out in the same manner as mentioned above. Positive and negative controls were used in every batch of stained slides (not shown in figures).
Morphometric analysis
Morphometric analysis of acute tubular necrosis was done by two investigators participating in this study. Morphometric analysis of cleaved caspase-3, cleaved PARP, RIPK1, RIPK3, MLKL, phospho-NFK-B, Wnt-3, Beta-Catenin, expression in renal tubular cells was done using ImageJ software (http://rsbweb.nih.gov/ij/). Cleaved caspase-3, cleaved PARP, RIPK1, RIPK3, MLKL, phospho-NFK-B, Wnt-3, Beta-Catenin, labeling were determined by counting the number of positive cells in randomly-selected high power fields (HPF) in the kidney. The mean numbers of positive cells will be converted from per HPF to per mm2 (Each mm2= 4HPF). For, cleaved caspase-3, cleaved PARP, RIPK1, RIPK3, and Wnt-3, labeling, cells were considered positive when there was a cytoplasmic staining pattern. For MLKL labeling, cells were considered positive when there was a membranous and cytoplasmic staining pattern. For phospho-NFK-B and Beta-Catenin, labeling, cells were considered positive when there was a nuclear staining pattern.
Enzyme Linked Immunosorbent Assay
Kidney concentrations of GAL-3, Cathepsin D, Cathepsin B, Cleaved caspase-3, TRAIL, and FAS were determined using DuoSet enzyme linked immunosorbent assay (ELISA) Development kit (R&D Systems, Minneapolis, MN, USA) for sandwich ELISA, using standard procedure according to the manufacturer’s instructions. Kidney cleaved PARP concentrations were determined using Cell signaling technology Elisa kit (Danvers, MA, USA) for sandwich Elisa, using standard procedure according to the manufacturer’s instructions. Kidney RIPK1, RIPK3 and MLKL concentrations were determined using MyBioSource (San Diego, CA, USA) Elisa kits for sandwich Elisa, using standard procedure according to the manufacturer’s instructions. Absorbance readings were made at 450 nm, using a 96-well plate spectrophotometer (BioTek ELx800 microplate Elisa reader, Winooski, VT, USA). GAL-3, Cathepsin D, Cathepsin B, cleaved caspase-3, TRAIL, RIPK1, RIPK3, MLKL, cleaved PARP and FAS concentrations in kidney samples were determined by interpolation from a standard curve. The levels were normalized to total protein concentrations.
Plasma samples analysis
Plasma levels of urea and creatinine were measured using an automated analyzer Integra 400 Plus. (Roche Diagnostics, Mannheim, Germany).
Statistical analysis
All statistical analyses were done using Graph Pad Prism Software version 5. Multiple comparisons between the various groups were achieved by one-way analysis of variance (ANOVA), followed by Newman-Keuls post hoc multiple range tests. Comparisons between two groups were achieved by Student t-test. Data are presented in mean ± standard error (S.E). P values < 0.05 are considered significant.
Results
Cisplatin-induced acute tubular necrosis
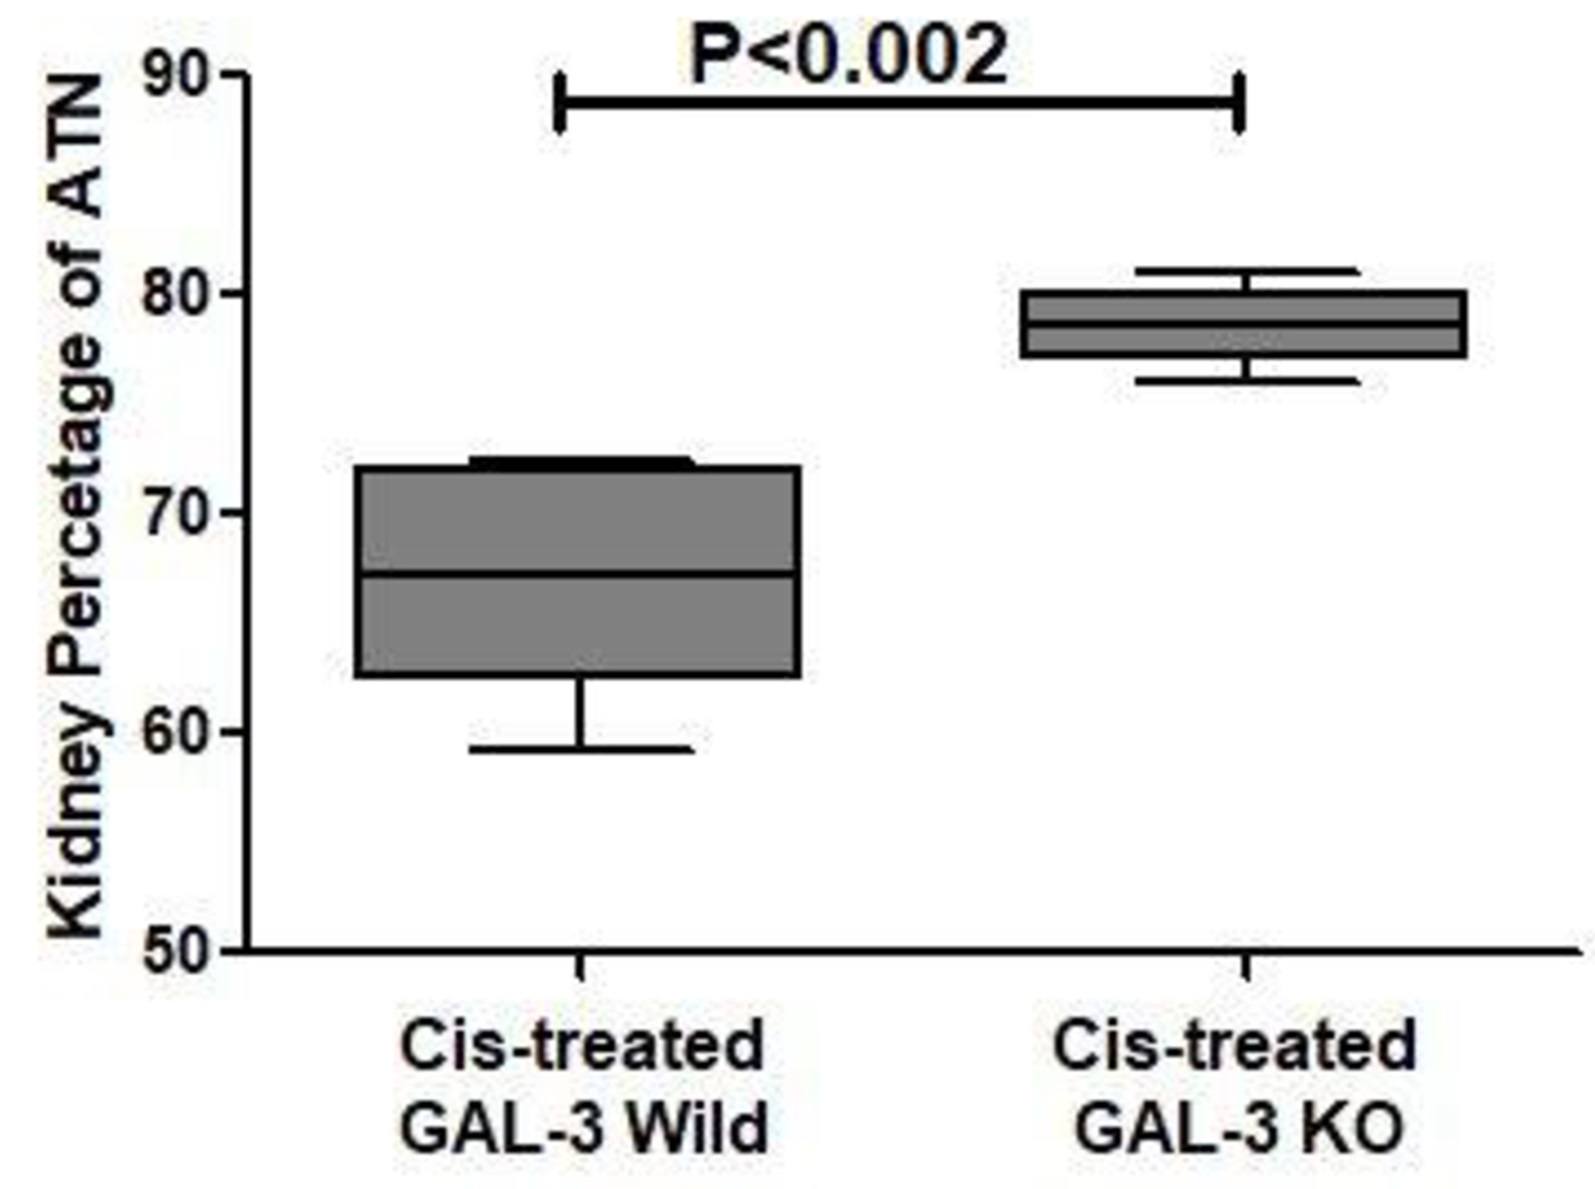
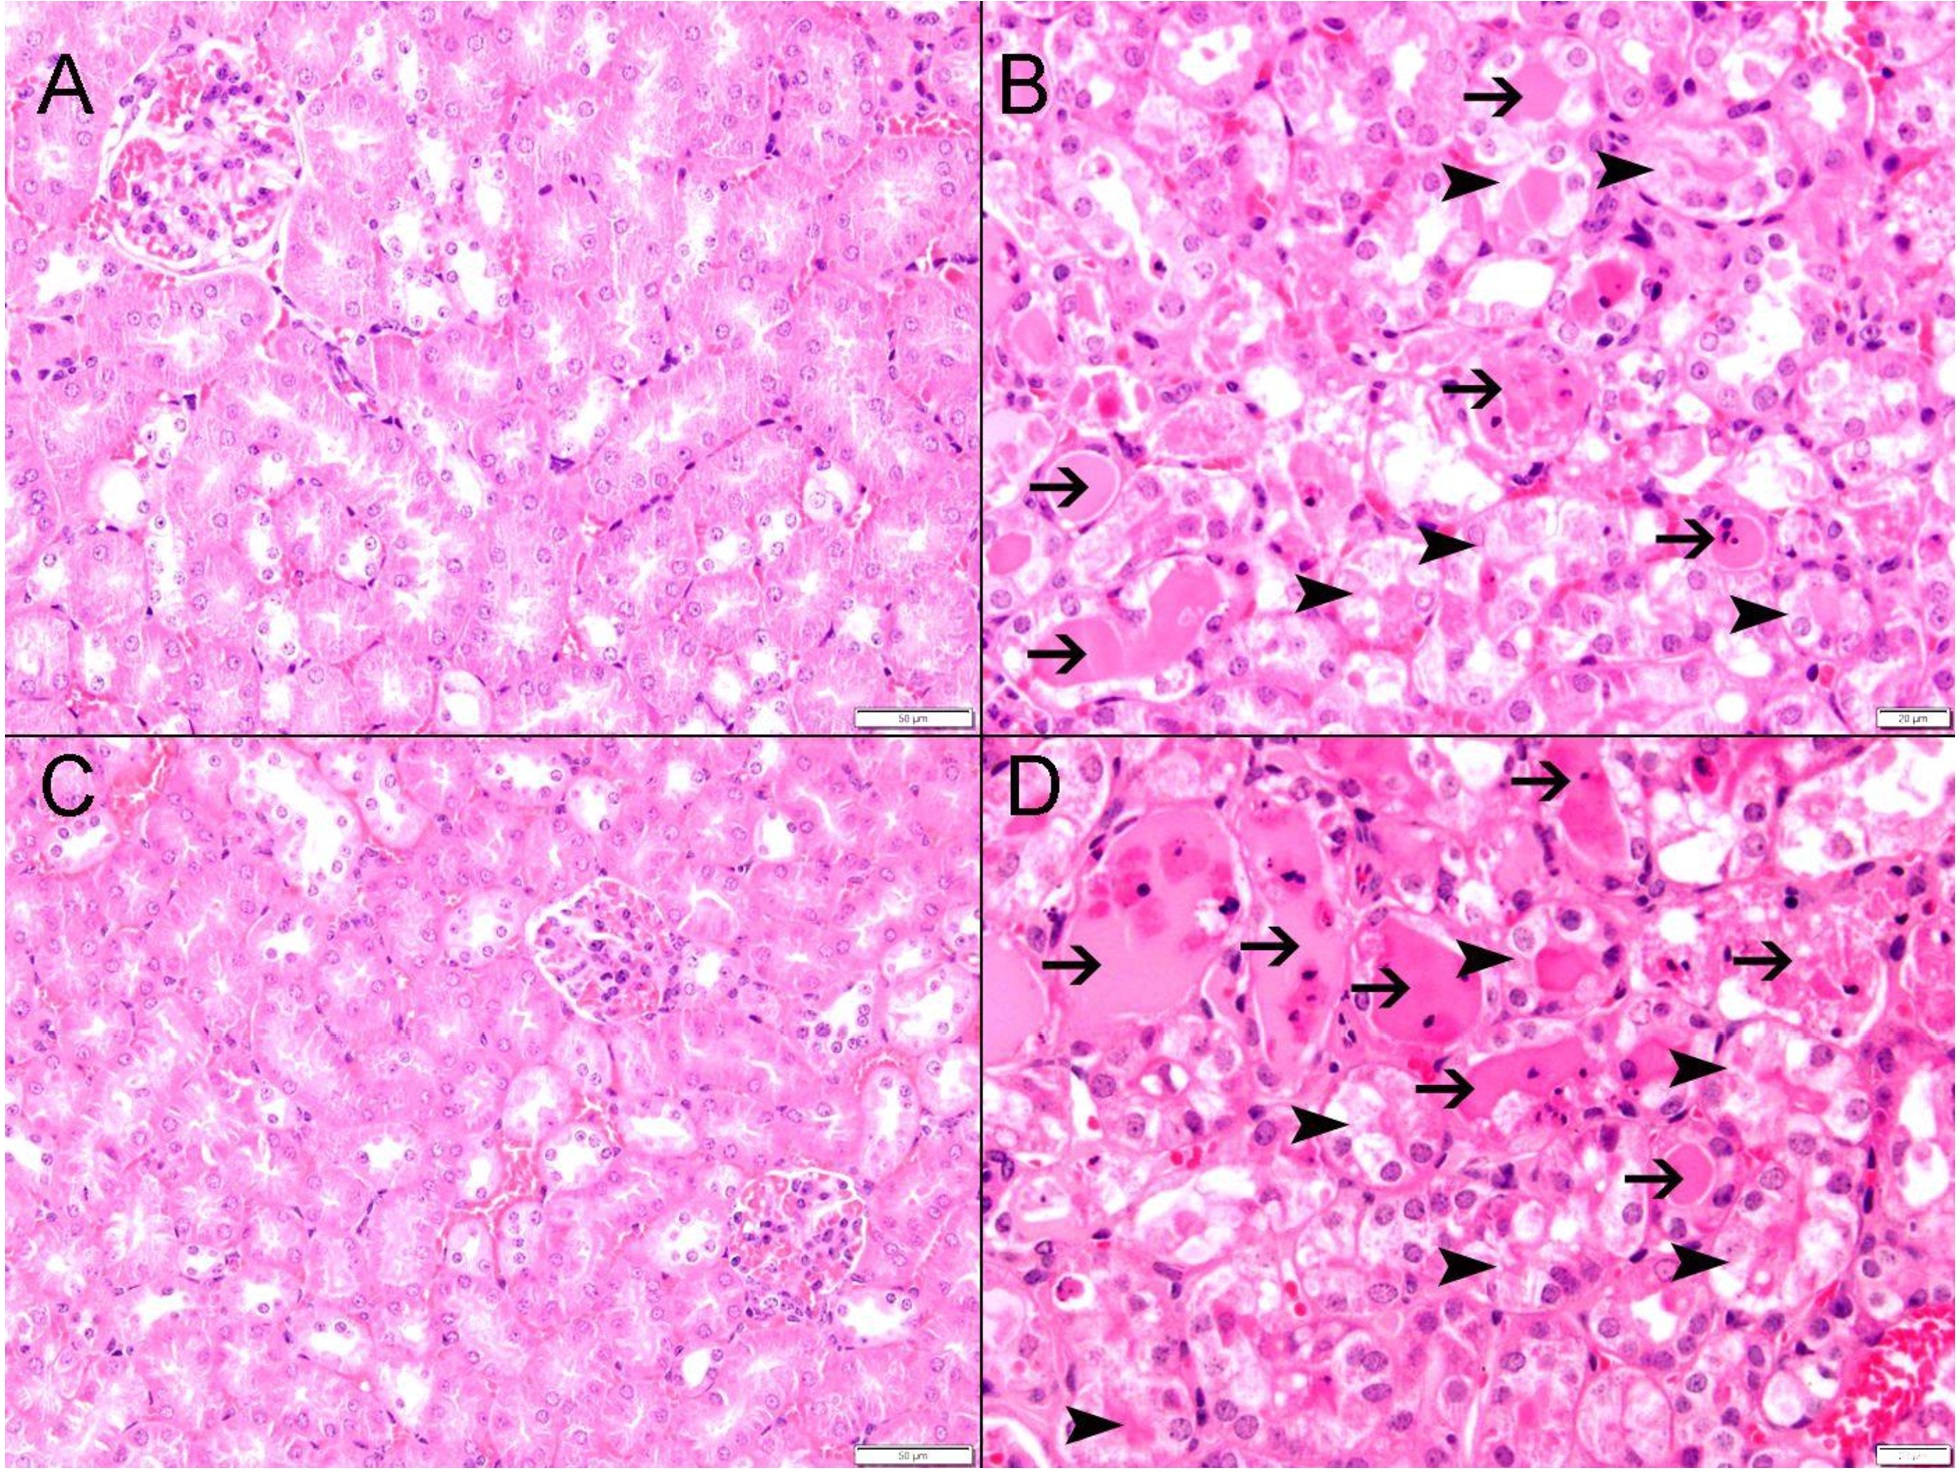
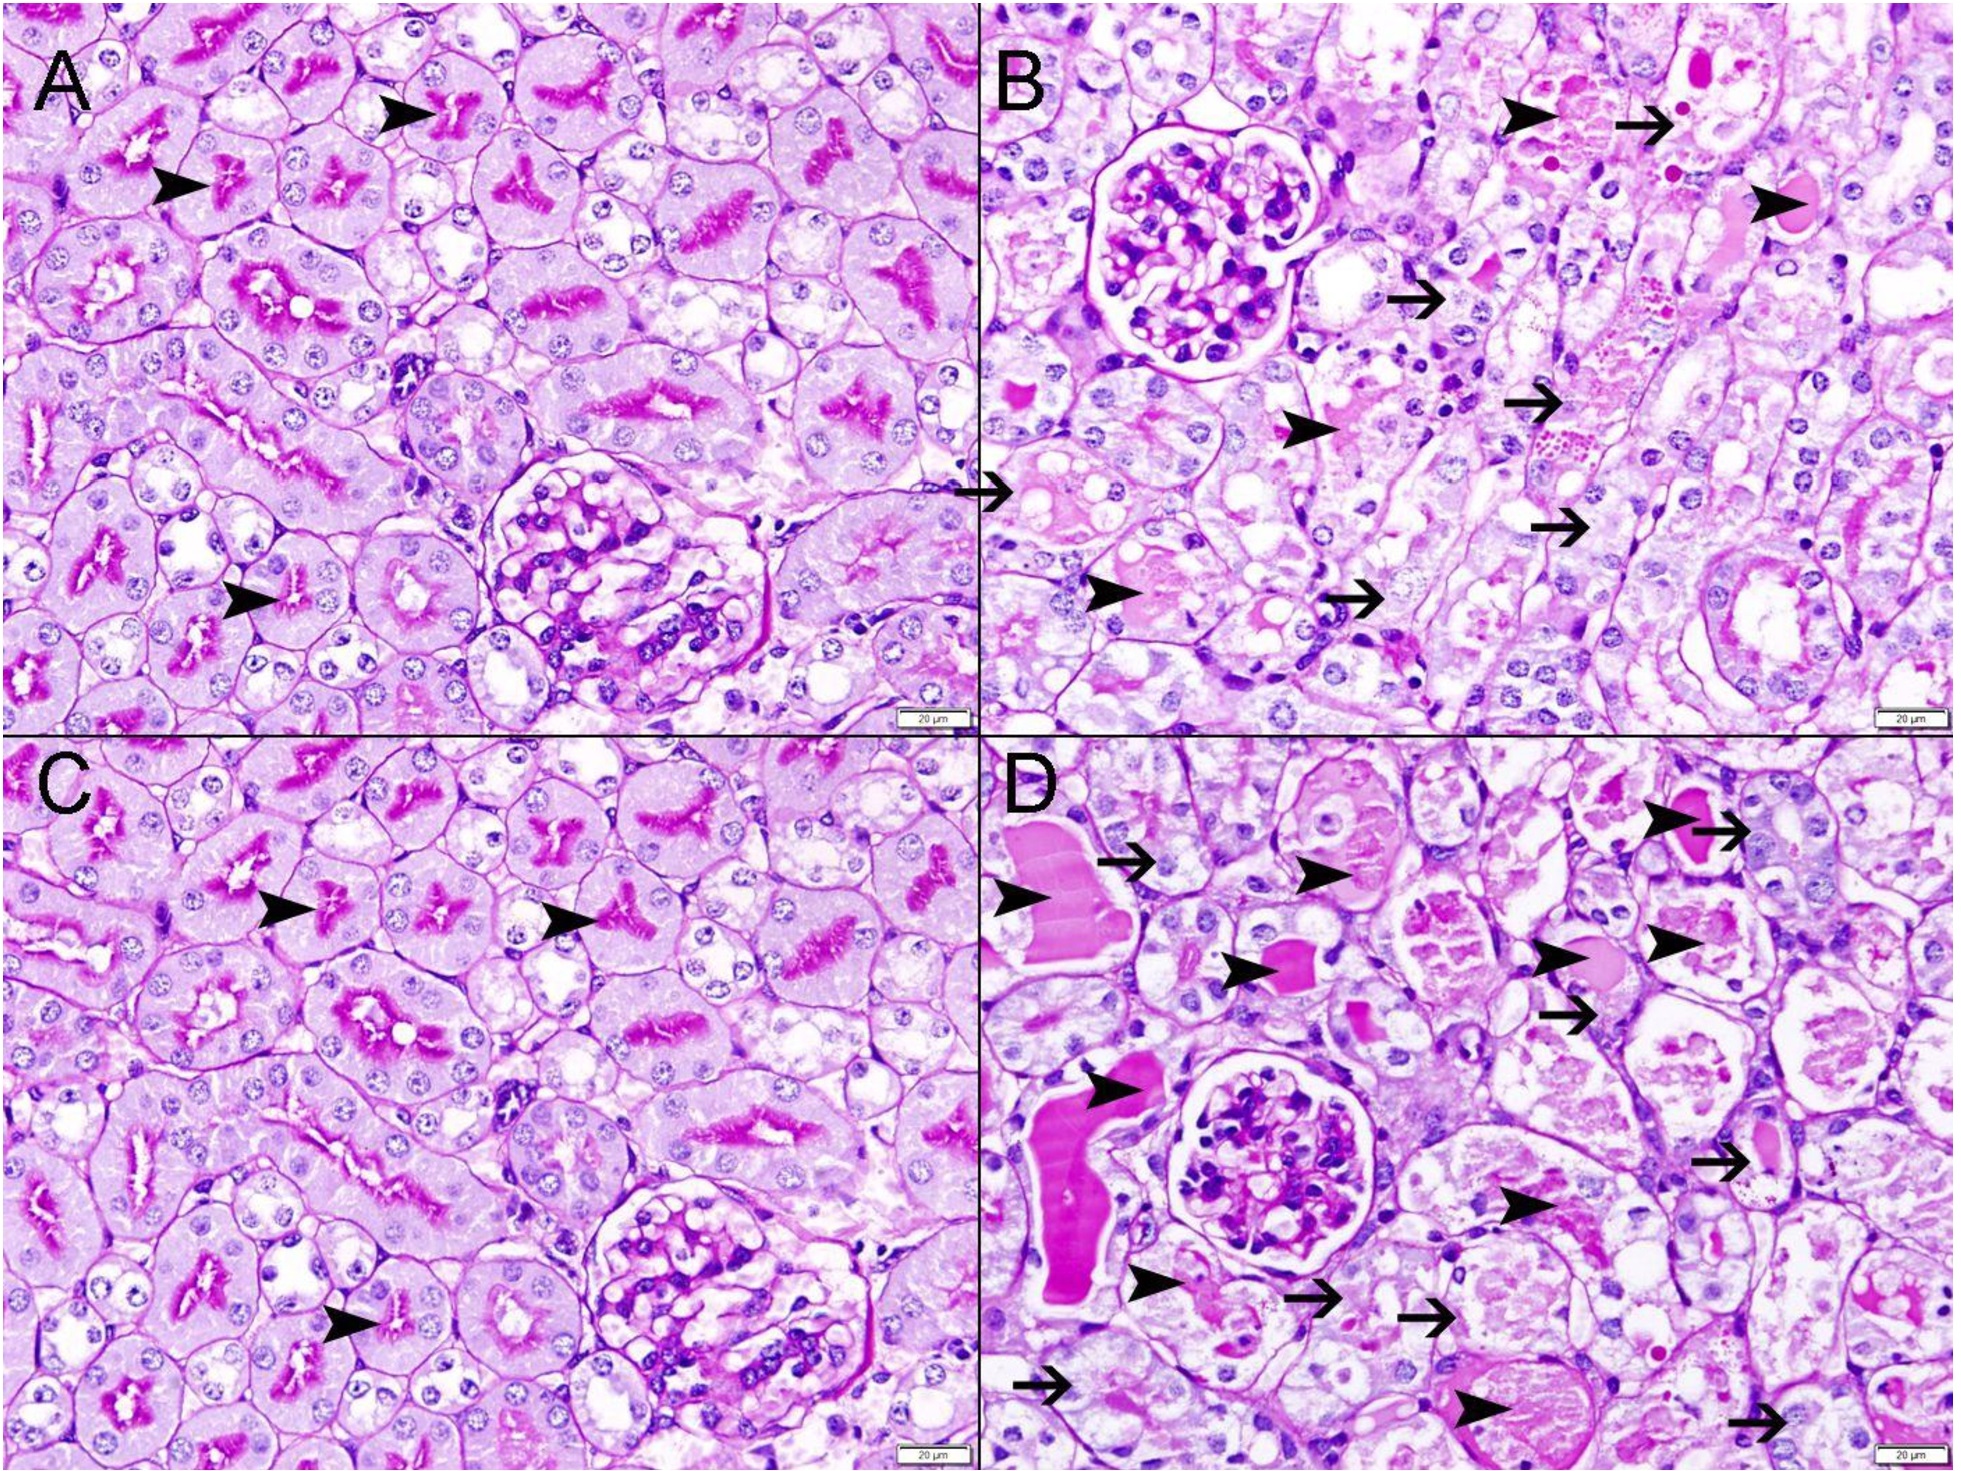
The cisplatin treated GAL-3 wild group shows ATN involving (67.29% ± 2.392) of renal parenchyma (Fig. 1) with loss of brush borders, swelling of tubular cells, intratubular falling cells, intratubular secretions and mitosis (Fig. 2B & 3B).
The cisplatin treated GAL-3 KO group shows ATN involving (78.54% ± 0.8120) of renal parenchyma (Fig. 1) with loss of brush borders, swelling of tubular cells, intratubular falling cells, intratubular secretions and mitosis (Fig. 2D & 3D).
There is a significantly higher percentage of ATN in kidneys in cisplatin-treated GAL-3 KO mice than cisplatin-treated GAL-3 wild mice (P<0.002) (Fig. 1).
GAL-3 is expressed in acute tubular necrosis
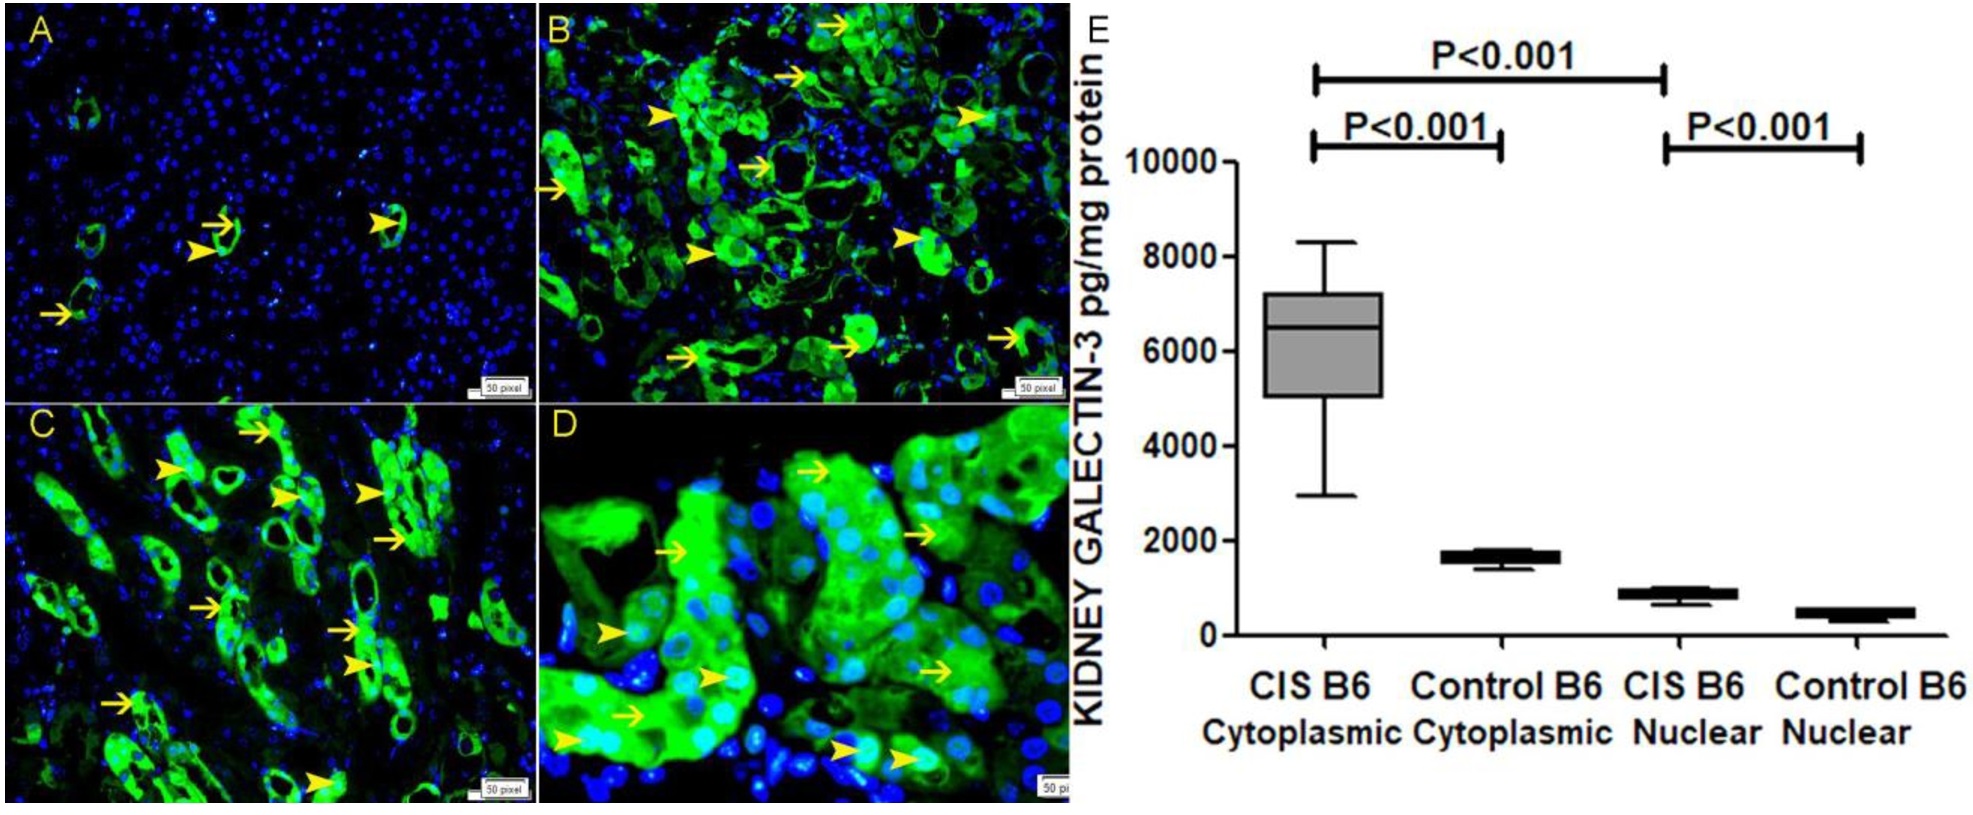
There is a significant increase in the cytoplasmic fraction concentration of GAL-3 in kidneys in cisplatin-treated GAL-3 wild group (6084 ± 587.3 pg/mg) when compared with GAL-3 wild control group (1620 ± 62.3 pg/mg), (P<0.001), (Fig. 4E). There is a significant increase of the nuclear fraction concentration of GAL-3 in kidneys in cisplatin-treated GAL-3 wild group (841.8 ± 41.11 pg/mg) when compared with GAL-3 wild control group (429.2 ± 39.56 pg/mg), (P<0.001), (Fig. 4E). Multiple comparisons between the four experimental groups using one-way ANOVA, followed by Newman-Keuls post hoc test were statistically significant (P<0.0001).
Immunofluorescent staining of representative kidney sections has shown a significantly higher expression of GAL-3 in renal tubules affected by acute tubular necrosis (Fig. 4B-D) when compared with GAL-3 wild control mice (Fig. 4A).
GAL-3 is an anti-necroptotic mediator
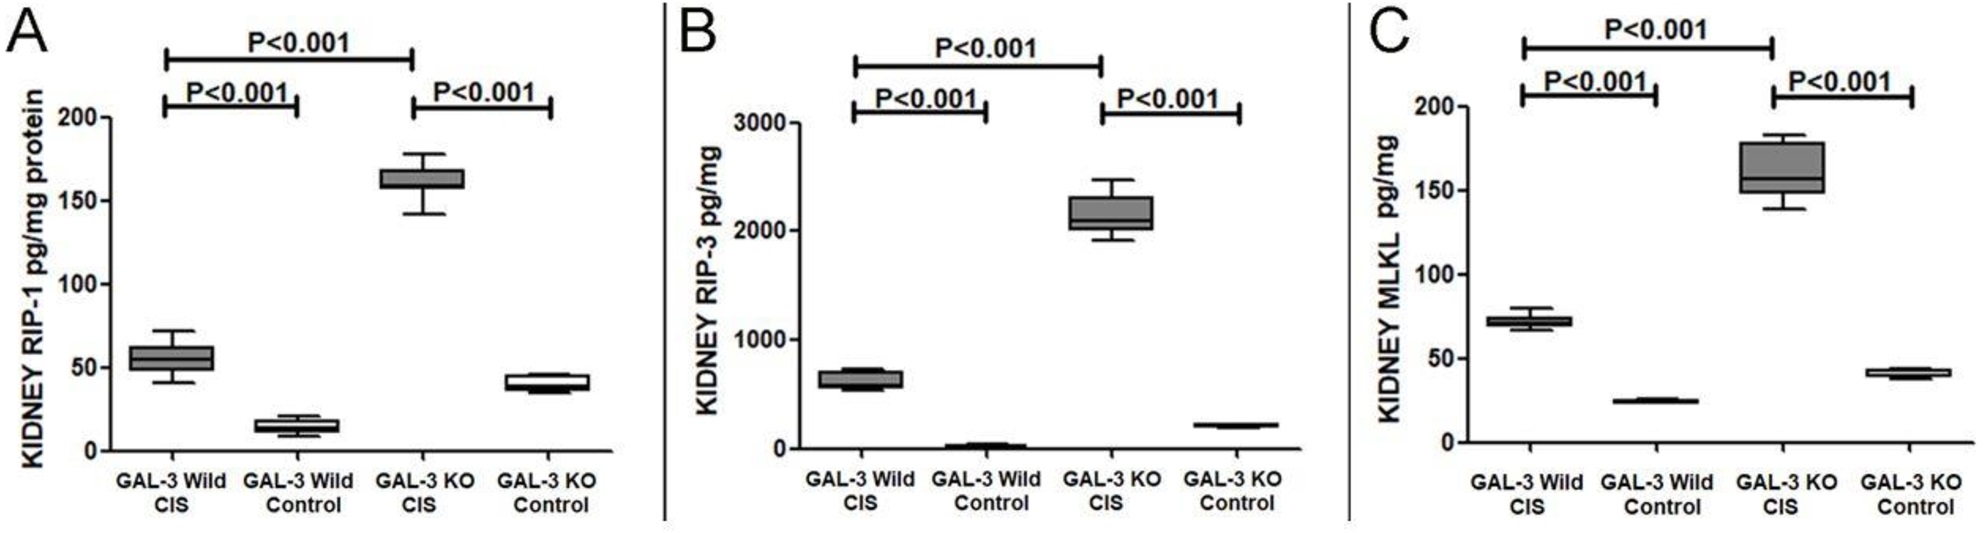
Receptor-interacting serine/threonine-protein kinase 1 (RIPK1). There was a significant increase in RIPK-1 concentration (55.33 ± 3.766 pg/mg) in kidneys of cisplatin-treated GAL-3 wild mice when compared with GAL-3 wild control mice (14.22 ± 1.687 pg/mg), (P<0.001), (Fig. 5A). There was a significant increase in RIPK-1 concentration (159.7 ± 4.183 pg/mg) in kidneys of cisplatin-treated GAL-3 KO mice when compared with GAL-3 KO control mice (39.59 ± 1.808 pg/mg), (P<0.001), (Fig. 5A). There was a significantly higher concentration of RIPK-1 (159.7 ± 4.183 pg/mg) in kidneys of cisplatin-treated GAL-3 KO mice than cisplatin-treated GAL-3 wild mice (55.33 ± 3.766 pg/mg), (P<0.001), (Fig. 5A).
Multiple comparisons between the four experimental groups using one-way ANOVA, followed by Newman-Keuls post hoc test were statistically significant (P<0.0001).
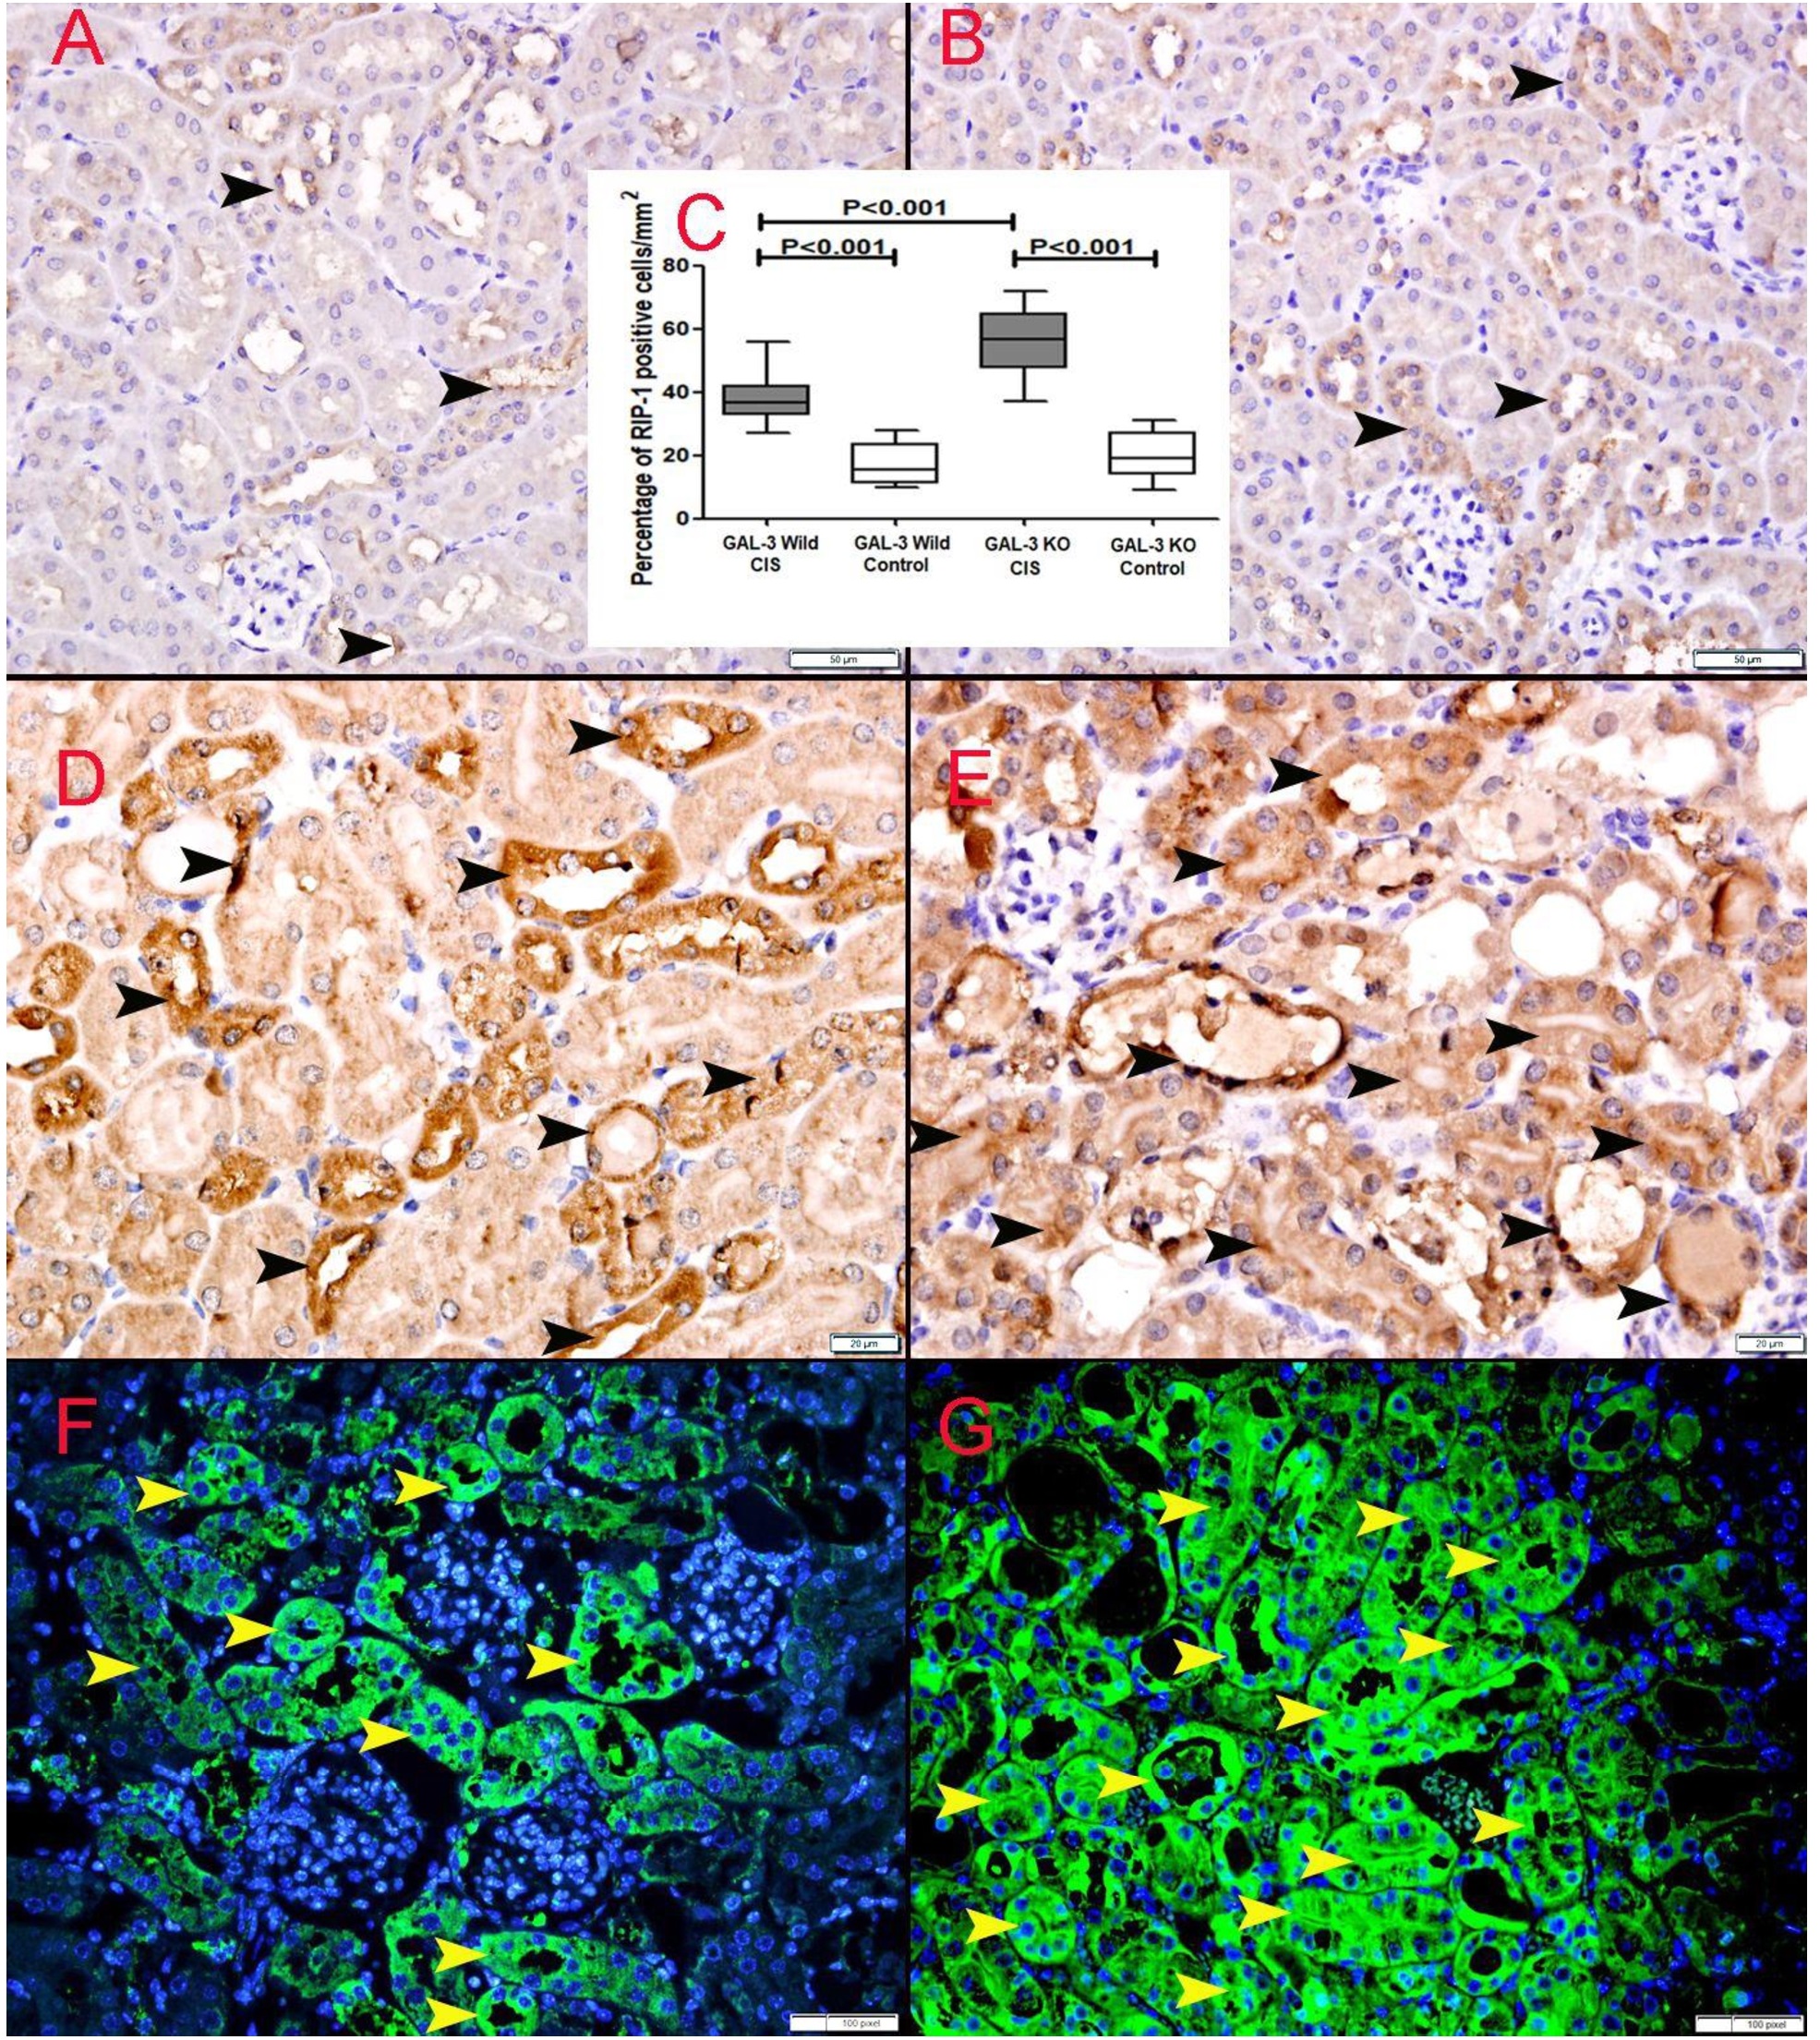
Immunohistochemical staining for RIPK-1 showed a significant higher number of cells expressing RIPK-1 in kidneys of cisplatin-treated GAL-3 KO mice than cisplatin-treated GAL-3 wild mice (P<0.001), (Fig. 6).
Receptor-interacting serine/threonine-protein kinase 3 (RIPK3). There was a significant increase in RIPK-3 concentration (616.4 ± 27.07 pg/mg) in kidneys of cisplatin-treated
GAL-3 wild mice when compared with GAL-3 wild control mice (17.46 ± 7.002 pg/mg), (P<0.001), (Fig. 5B). There was a significant increase in RIPK-3 concentration (2165 ± 73.29 pg/mg) in kidneys of cisplatin-treated GAL-3 KO mice when compared with GAL-3 KO control mice (203.1 ± 6.443 pg/mg), (P<0.001), (Fig. 5B). There was a significantly higher concentration of RIPK-3 (2165 ± 73.29 pg/mg) in kidneys of cisplatin-treated GAL-3 KO mice than cisplatin-treated GAL-3 wild mice (616.4 ± 27.07 pg/mg), (P<0.001), (Fig. 5B).
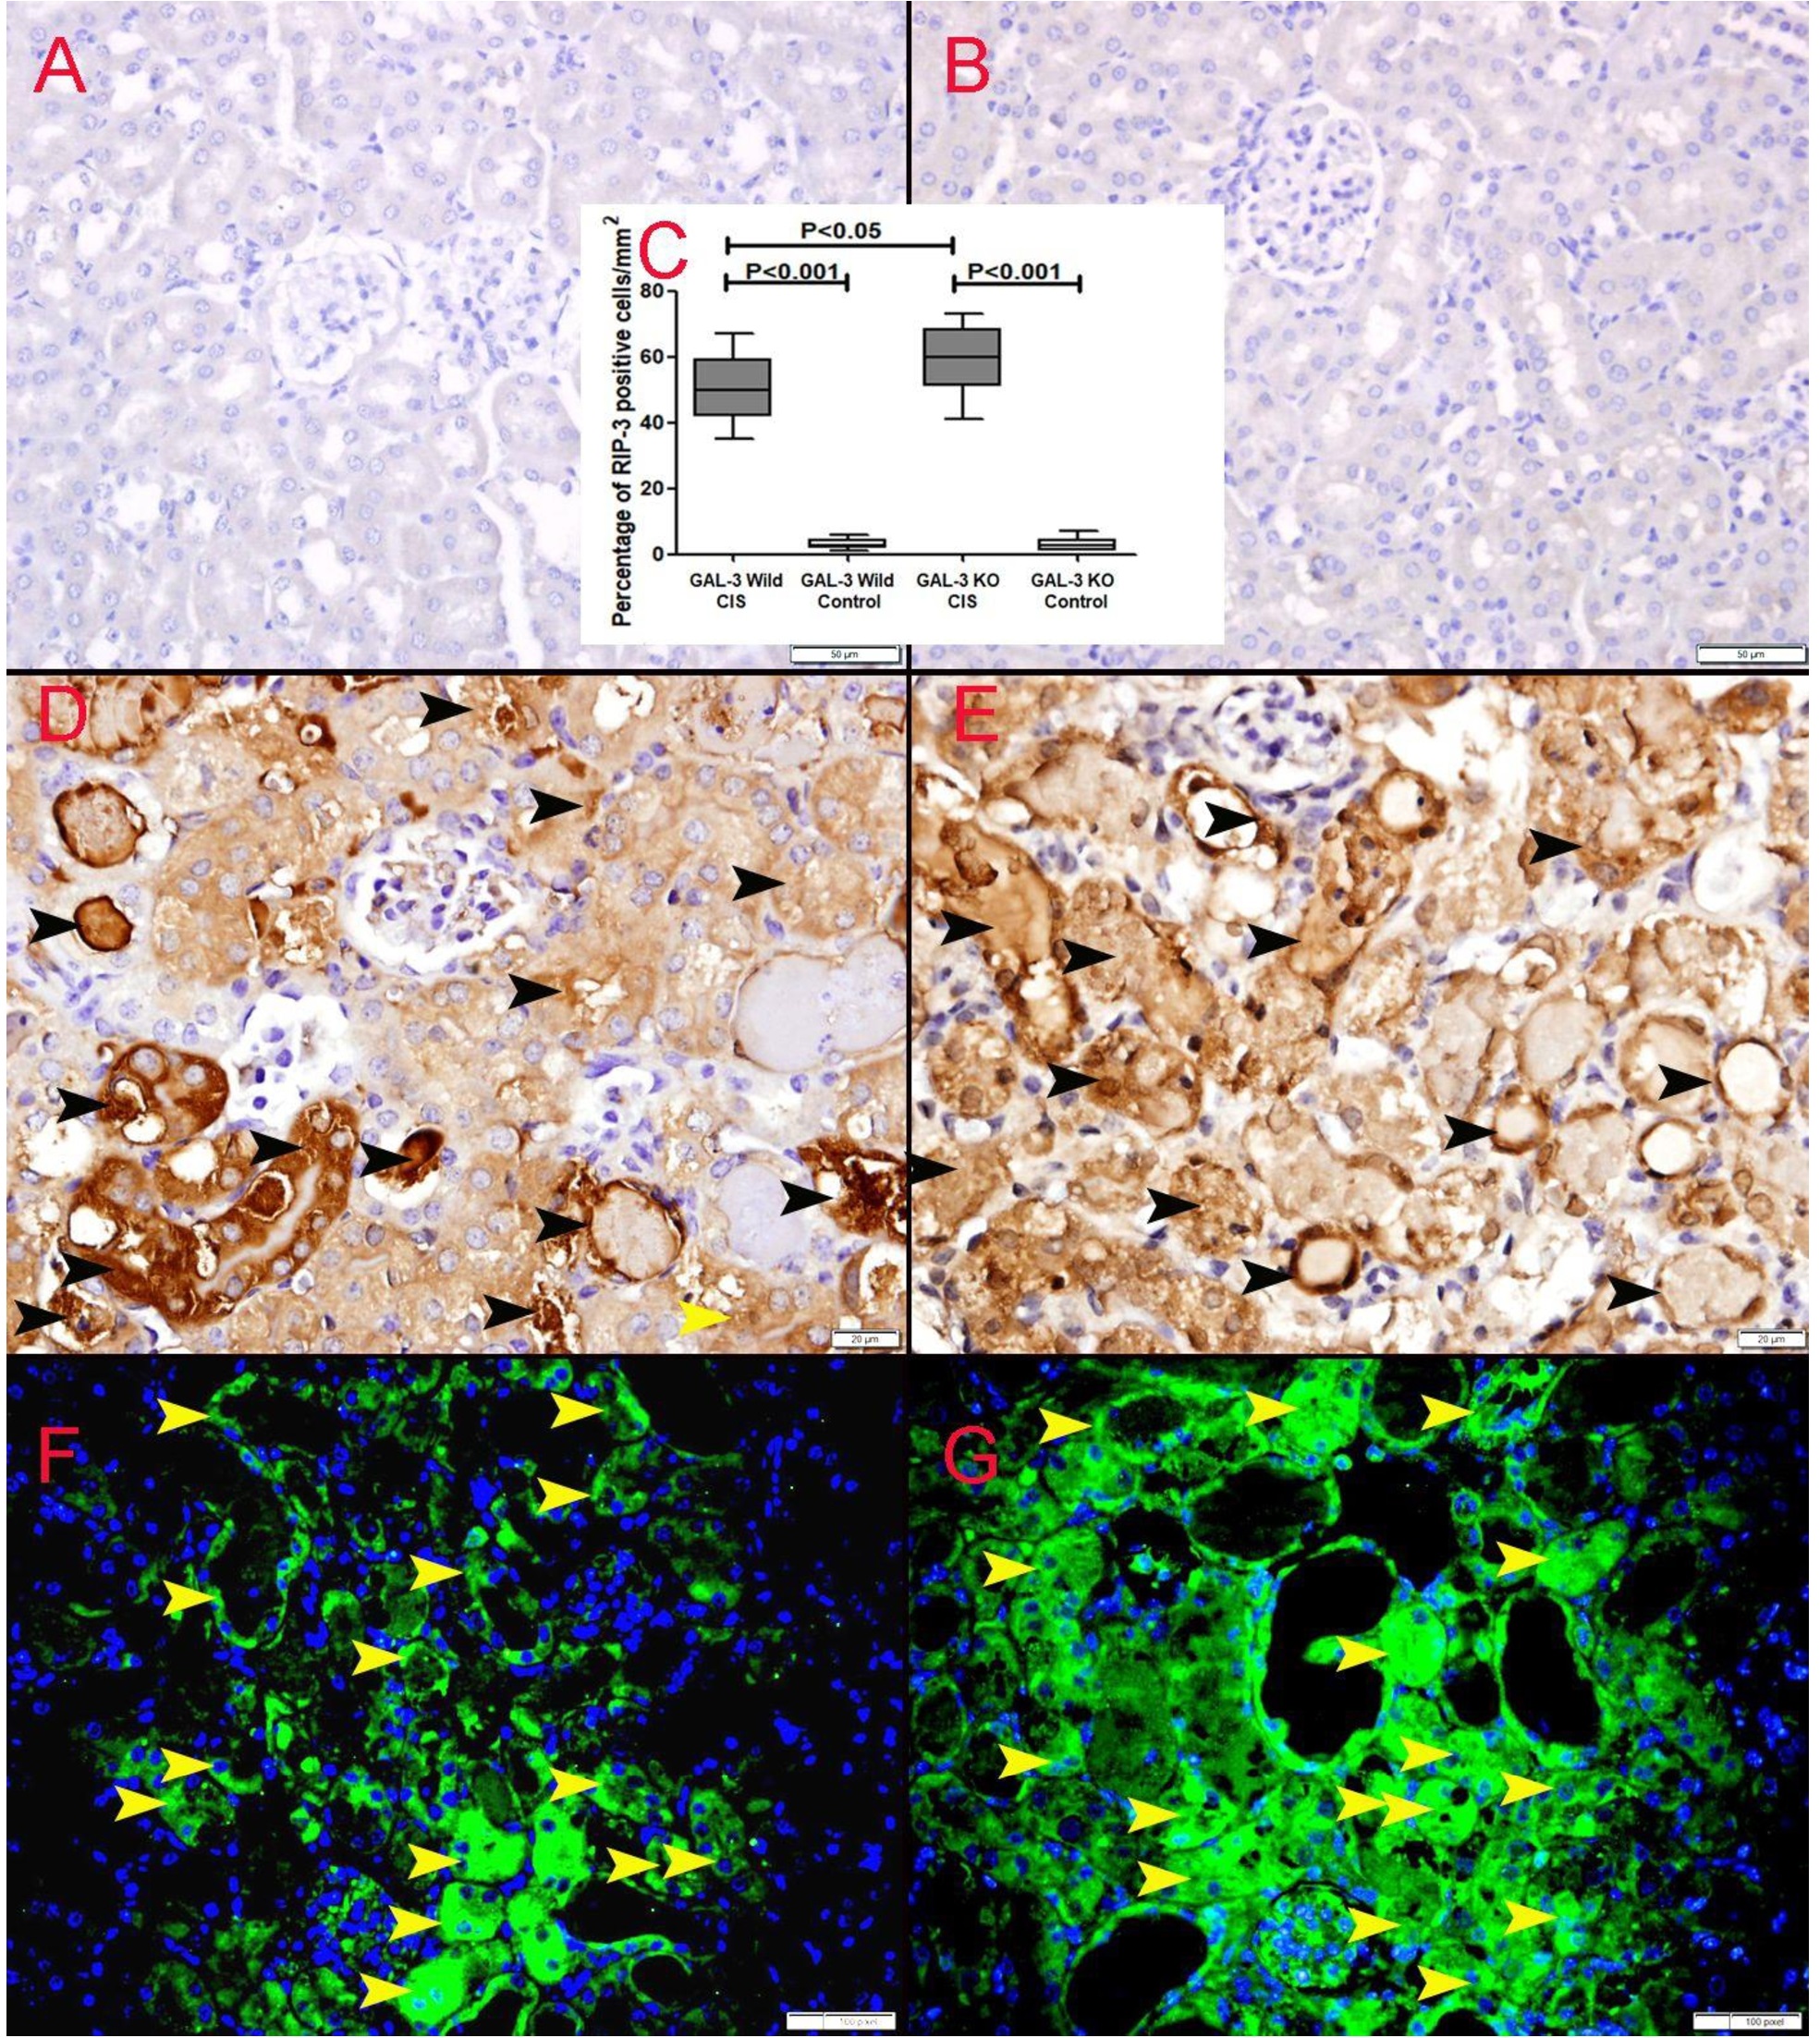
Immunohistochemical staining for RIPK-3 showed a significant higher number of cells expressing RIPK-3 in kidneys of cisplatin-treated GAL-3 KO mice than cisplatin-treated GAL-3 wild mice (P<0.001), (Fig. 7). Multiple comparisons between the four experimental groups using one-way ANOVA, followed by Newman-Keuls post hoc test were statistically significant (P<0.0001).
Mixed lineage kinase domain-like (MLKL). There was a significant increase in MLKL concentration (71.46 ± 1.757 pg/mg) in kidneys of cisplatin-treated GAL-3 wild mice when compared with GAL-3 wild control mice (23.30 ± 0.5897pg/mg), (P<0.001), (Fig. 5C). There was a significant increase in MLKL concentration (160.3 ± 6.648 pg/mg) in kidneys of cisplatin-treated GAL-3 KO mice when compared with GAL-3 KO control mice (40.30 ± 1.090 pg/mg), (P<0.001), (Fig. 5C). There was a significantly higher concentration of MLKL (160.3 ± 6.648 pg/mg) in kidneys of cisplatin-treated GAL-3 KO mice than cisplatin-treated GAL-3 wild mice (71.46 ± 1.757 pg/mg), (P<0.001), (Fig. 5C).
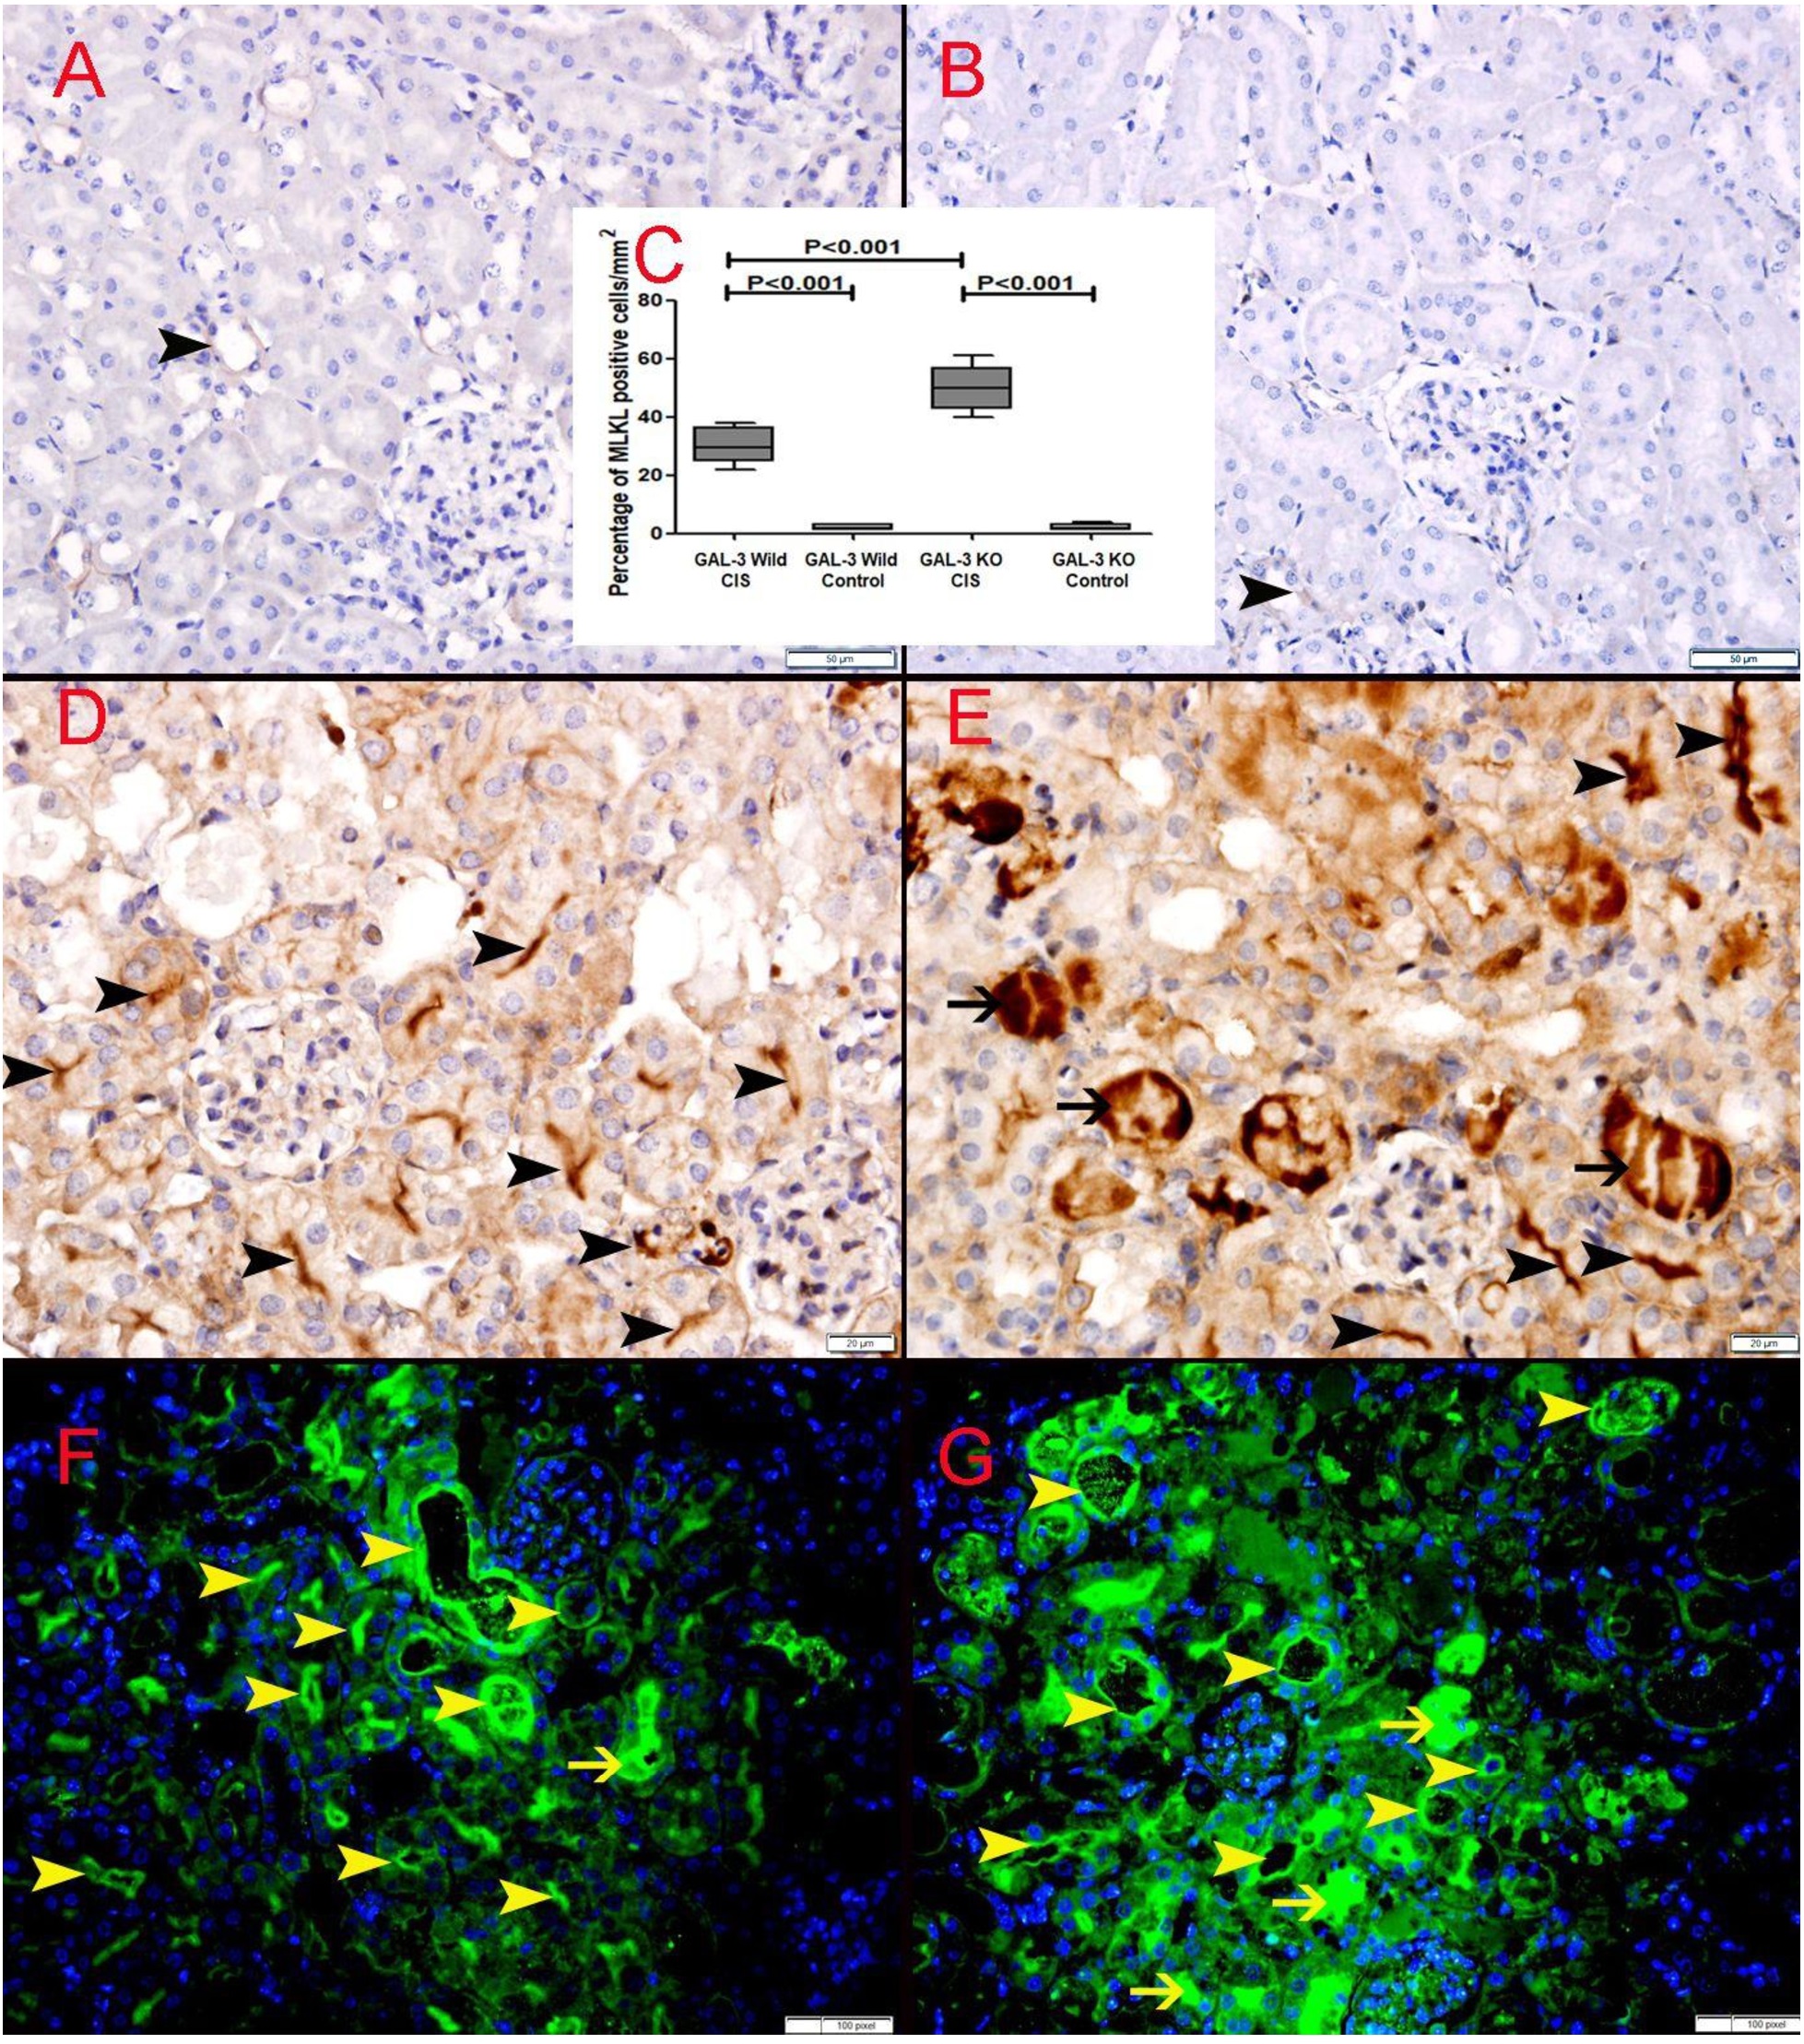
Immunohistochemical staining for MLKL showed a significant higher number of cells expressing MLKL in kidneys of cisplatin-treated GAL-3 KO mice than cisplatin-treated GAL-3 wild mice (P<0.001), (Fig. 8). Multiple comparisons between the four experimental groups using one-way ANOVA, followed by Newman-Keuls post hoc test were statistically significant (P<0.0001).
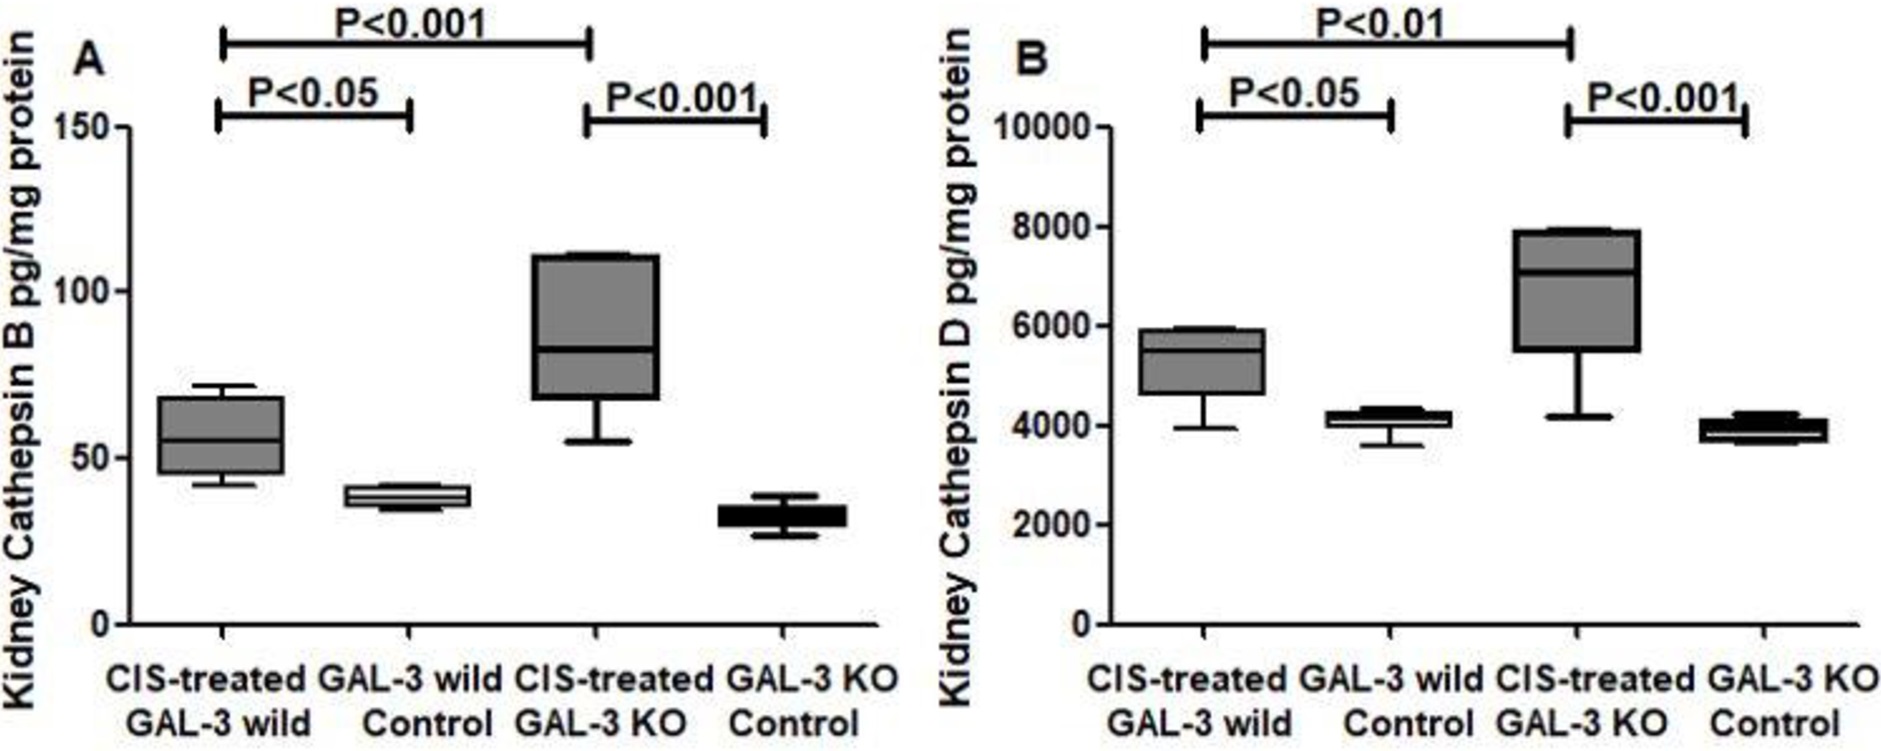
Cathepsin B. There was a significant increase in Cathepsin-B concentration in kidneys of cisplatin-treated GAL-3 wild mice (55.79 ± 4.141 pg/mg) when compared with GAL-3 wild control mice (37.99 ± 1.206 pg/mg), (P<0.05), (Fig. 9A). There was a significant increase in Cathepsin-B concentration in kidneys of cisplatin-treated GAL-3 KO mice (85.87 ± 9.220 pg/mg when compared with GAL-3 wild control mice (32.81 ± 1.570 pg/mg), (P<0.001), (Fig. 9A). There was a significantly higher concentration of Cathepsin-B in kidneys of cisplatin-treated GAL-3 KO mice (85.87 ± 9.220 pg/mg than cisplatin-treated GAL-3 wild mice (55.79 ± 4.141 pg/mg), (P<0.001), (Fig. 9A).
Multiple comparisons between the four experimental groups using one-way ANOVA, followed by Newman-Keuls post hoc test were statistically significant (P<0.0001).
Cathepsin-D. There was a significant increase in Cathepsin-D concentration in kidneys of cisplatin-treated GAL-3 wild mice (5145 ± 286.1pg/mg) when compared with GAL-3 wild control mice (4066 ± 107.7 pg/mg), (P<0.05), (Fig. 9B). There was a significant increase in Cathepsin-D concentration in kidneys of cisplatin-treated GAL-3 KO mice (6695 ± 587.7 pg/mg) when compared with GAL-3 wild control mice (3914 ± 87.51 pg/mg), (P<0.001), (Fig. 9B). There was a significantly higher concentration of Cathepsin-D in kidneys of cisplatin-treated GAL-3 KO mice (6695 ± 587.7 pg/mg) than cisplatin-treated GAL-3 wild mice (4066 ± 107.7 pg/mg), (P<0.01), (Fig. 9B).
Multiple comparisons between the four experimental groups using one-way ANOVA, followed by Newman-Keuls post hoc test were statistically significant (P<0.0001).
GAL-3 is an anti-Apoptotic mediator
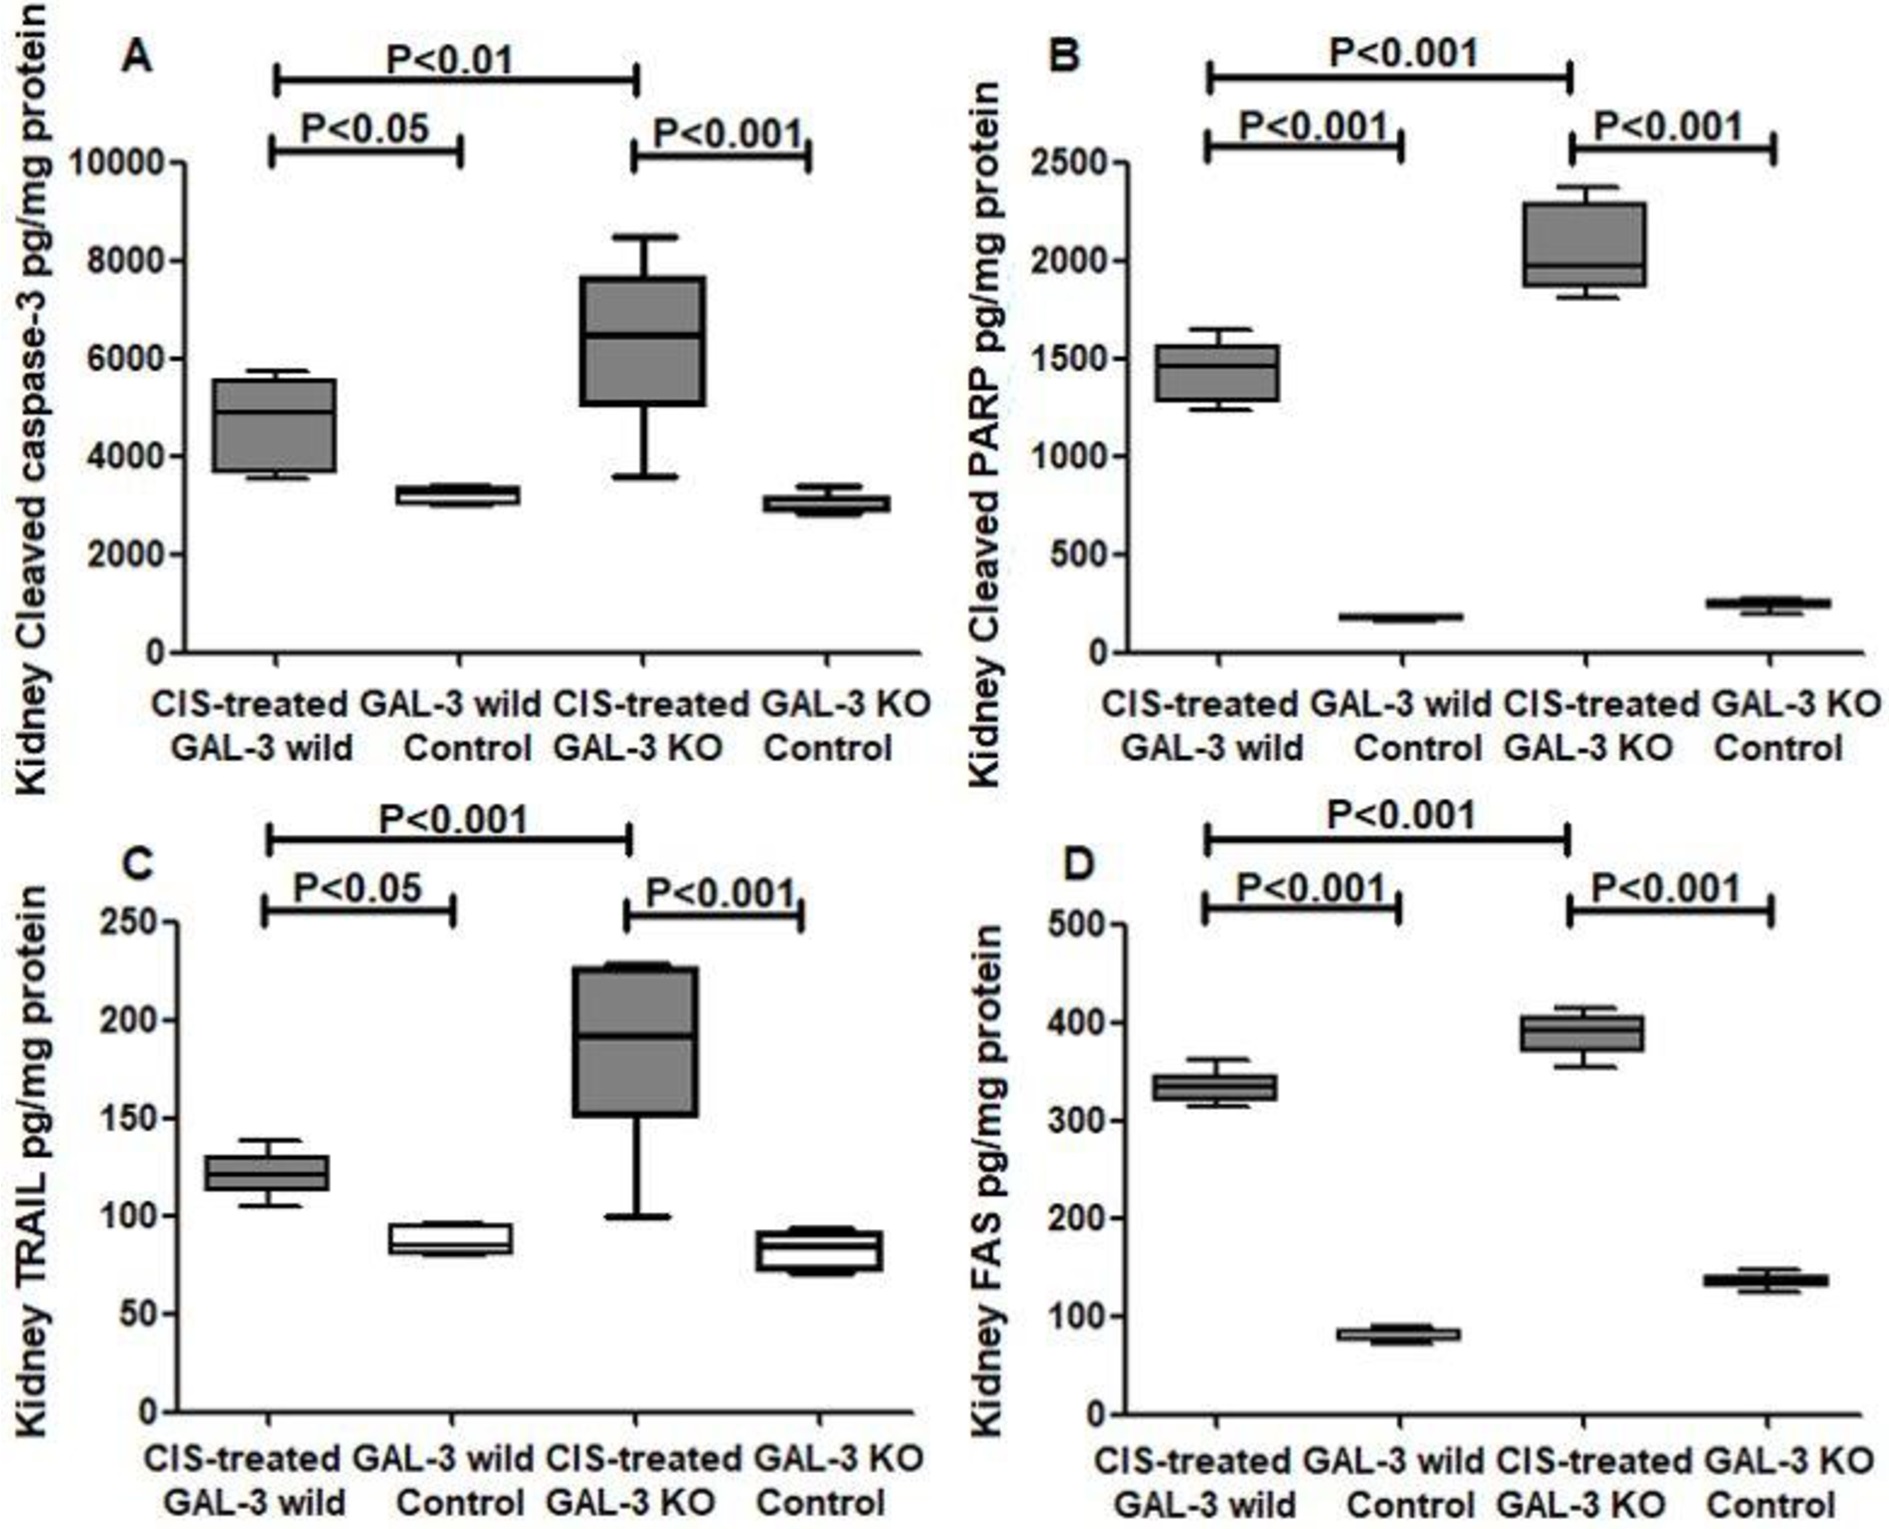
Cleaved caspase-3. There was a significant increase in Cleaved caspase-3 concentration (4665 ± 330.9 pg/mg) in kidneys of cisplatin-treated GAL-3 wild mice when compared with GAL-3 wild control mice (3193 ± 75.30 pg/mg), (P<0.05), (Fig. 10A). There was a significant increase in Cleaved caspase-3 concentration (6319 ± 686 pg/mg) in kidneys of cisplatin-treated GAL-3 KO mice when compared with GAL-3 KO control mice (3022 ± 78.57 pg/mg), (P<0.001), (Fig. 10A). There was a significantly higher concentration of Cleaved caspase-3 (6319 ± 686 pg/mg) in kidneys of cisplatin-treated GAL-3 KO mice than cisplatin-treated GAL-3 wild mice (4665 ± 330.9 pg/mg), (P<0.01), (Fig. 10A). Multiple comparisons between the four experimental groups using one-way ANOVA, followed by Newman-Keuls post hoc test were statistically significant (P<0.0001).
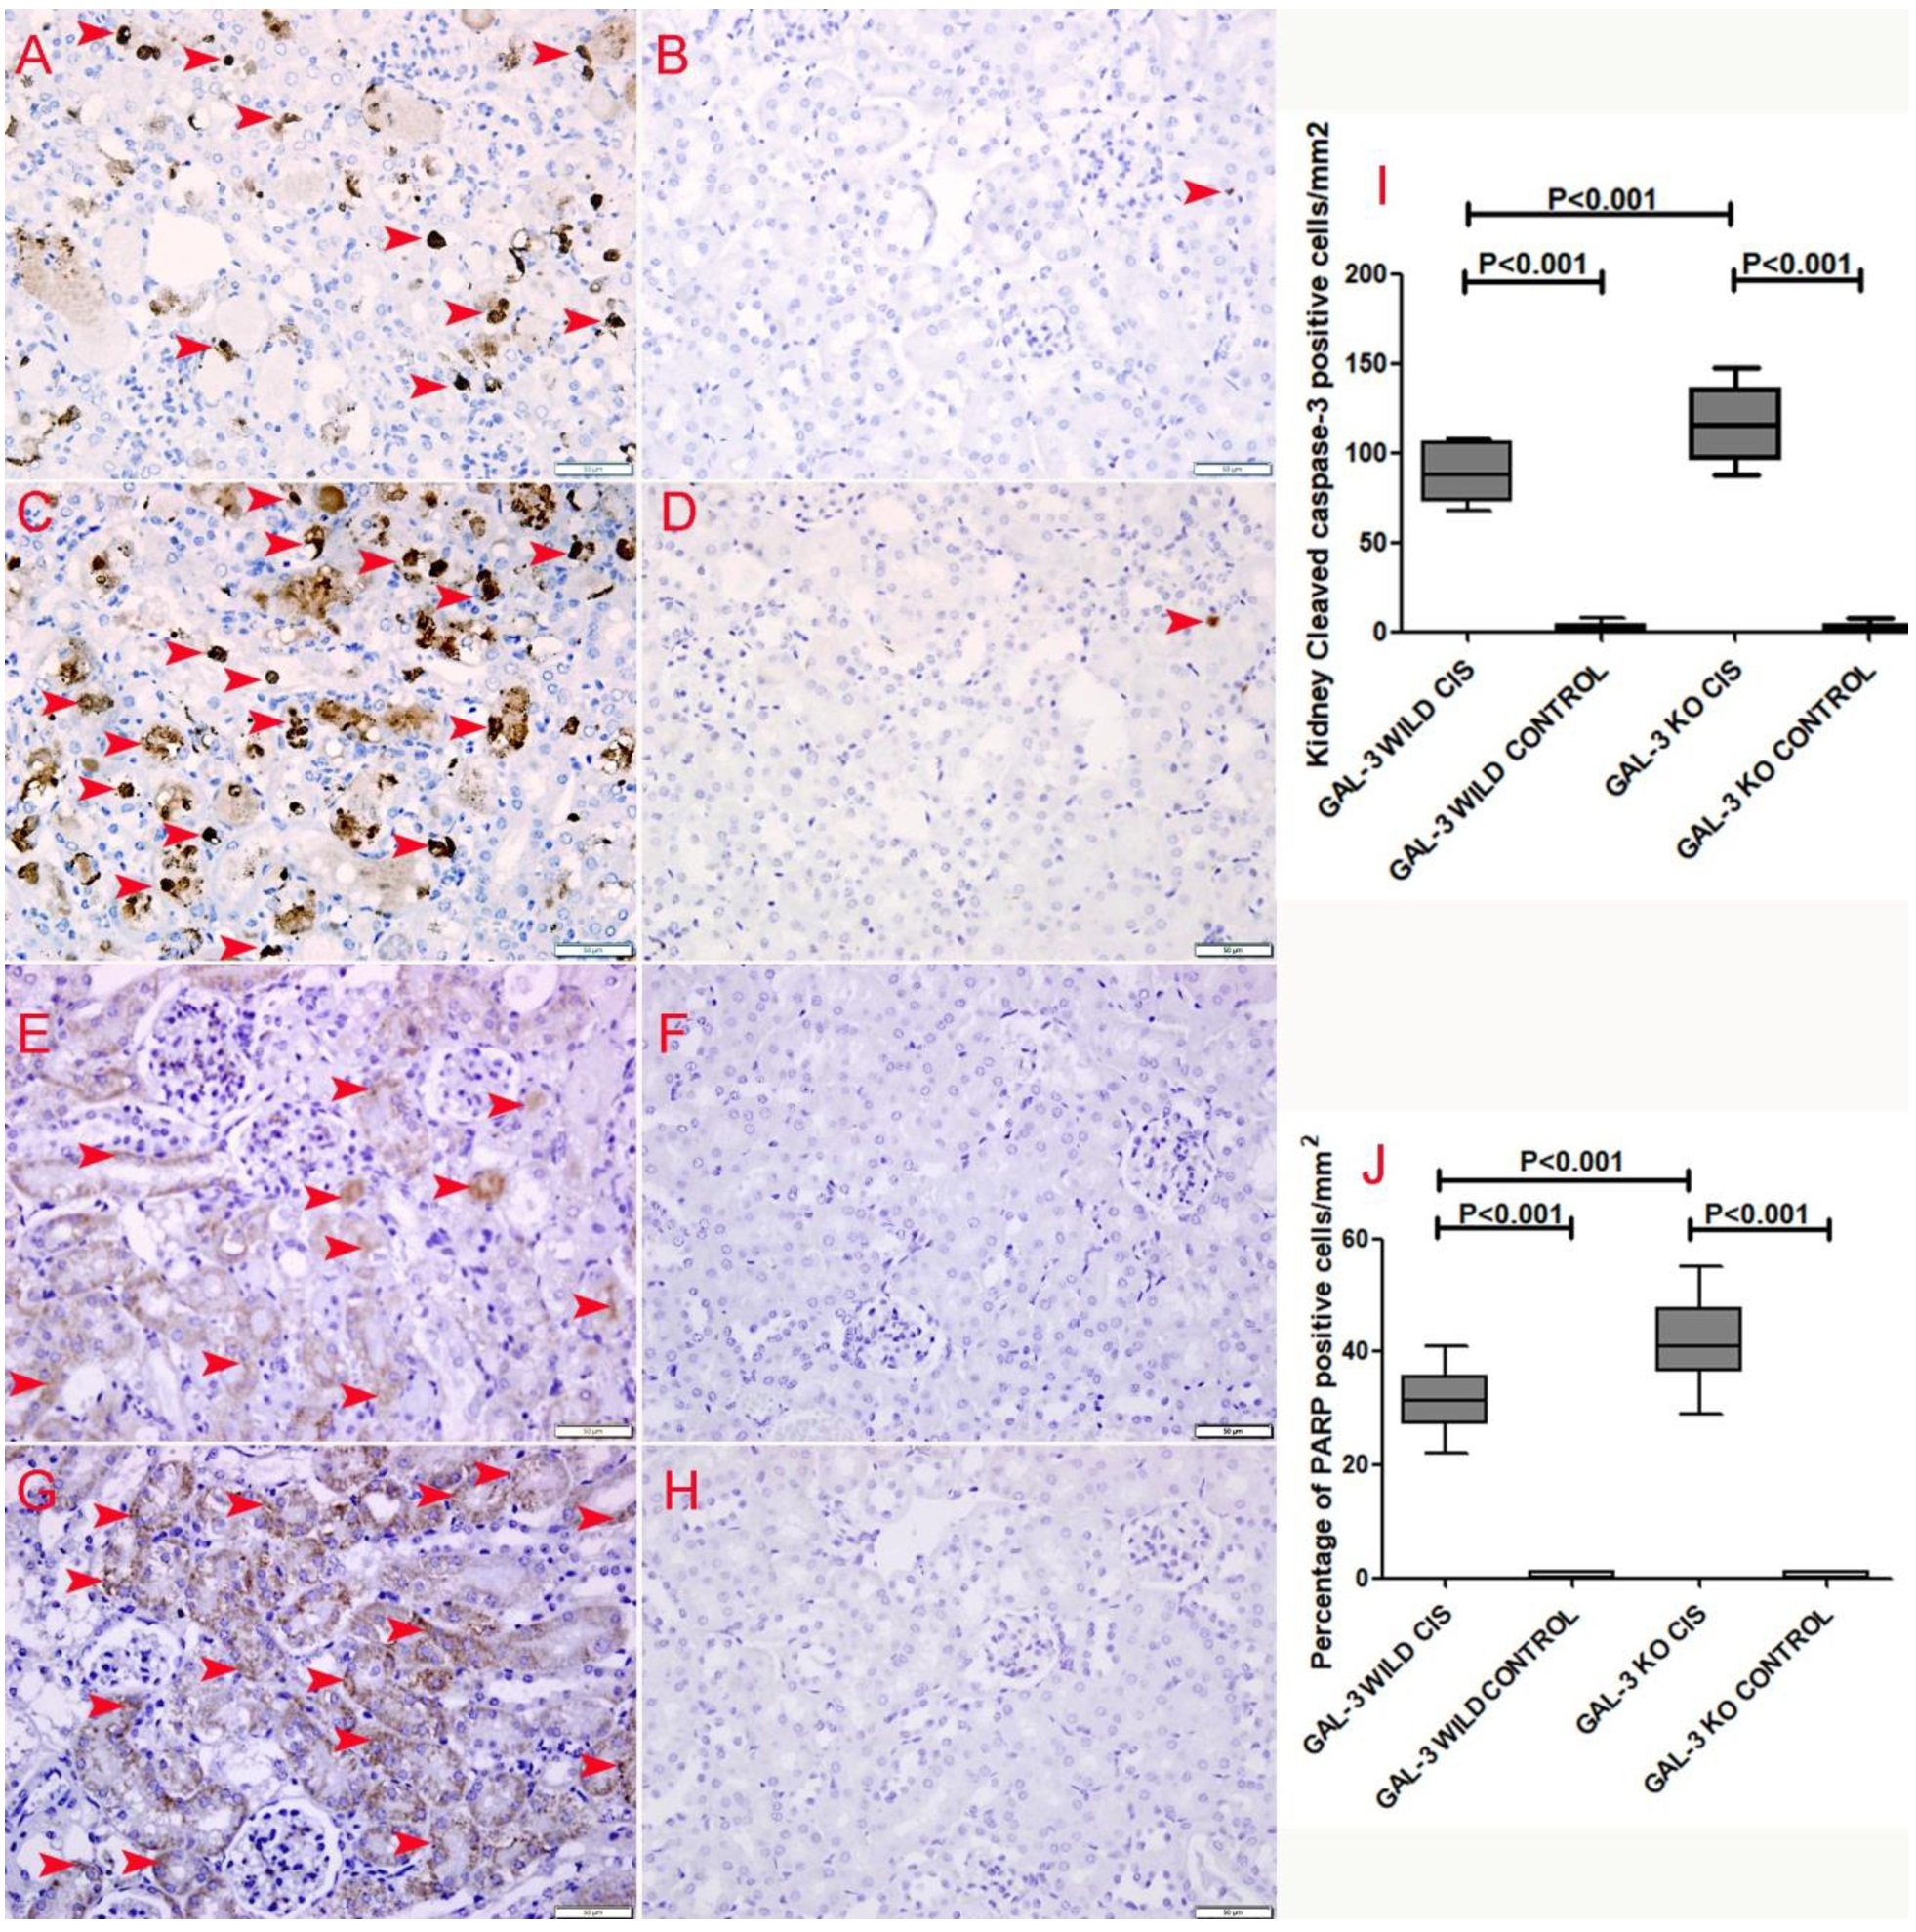
Immunohistochemical staining for cleaved caspase-3 showed a significant higher number of apoptotic cells in in kidneys of cisplatin-treated GAL-3 KO mice than cisplatin-treated GAL-3 wild mice (P<0.001), (Fig. 11 A, C, I).
Cleaved PARP. There was a significant increase in Cleaved PARP concentration (1446 ± 56.97 pg/mg) in kidneys of cisplatin-treated GAL-3 wild mice when compared with GAL-3 wild control mice (171.5 ± 3.926 pg/mg), (P<0.001), (Fig. 10B). There was a significant increase in Cleaved PARP concentration (2044 ± 91.47 pg/mg) in kidneys of cisplatin-treated GAL-3 KO mice when compared with GAL-3 KO control mice (236.1 ± 11.86 pg/mg), (P<0.001), (Fig. 10B). There was a significantly higher concentration of Cleaved PARP (2044 ± 91.47 pg/mg) in kidneys of cisplatin-treated GAL-3 KO mice than cisplatin-treated GAL-3 wild mice (1446 ± 56.97 pg/mg), (P<0.001), (Fig. 10B). Multiple comparisons between the four experimental groups using one-way ANOVA, followed by Newman-Keuls post hoc test were statistically significant (P<0.0001).
Immunohistochemical staining for cleaved PARP showed a significant higher number of positive cell in in kidneys of cisplatin-treated GAL-3 KO mice than cisplatin-treated GAL-3 wild mice (P<0.001), (Fig. 11 E, G, J).
TNF-related apoptosis-inducing ligand (TRAIL). There was a significant increase in TRAIL concentration (120.9 ± 4.748 pg/mg) in kidneys of cisplatin-treated GAL-3 wild mice when compared with GAL-3 wild control mice (86.14 ± 2.879 pg/mg), (P<0.05), (Fig. 10C). There was a significant increase in TRAIL concentration (184.3 ± 19.47 pg/mg) in kidneys of cisplatin-treated GAL-3 KO mice when compared with GAL-3 KO control mice (82.77 ± 3.881 pg/mg), (P<0.001), (Fig. 10C). There was a significantly higher concentration of TRAIL (184.3 ± 19.47 pg/mg) in kidneys of cisplatin-treated GAL-3 KO mice than cisplatin-treated GAL-3 wild mice (120.9 ± 4.748 pg/mg), (P<0.001), (Fig. 10C). Multiple comparisons between the four experimental groups using one-way ANOVA, followed by Newman-Keuls post hoc test were statistically significant (P<0.0001).
FAS legend. There was a significant increase in FAS concentration (332.5 ± 6.395 pg/mg) in kidneys of cisplatin-treated GAL-3 wild mice when compared with GAL-3 wild control mice (77.72 ± 2.805 pg/mg), (P<0.001), (Fig. 10D). There was a significant increase in FAS concentration (387.9 ± 8.520 pg/mg) in kidneys of cisplatin-treated GAL-3 KO mice when compared with GAL-3 KO control mice (134.1 ± 3.597 pg/mg), (P<0.001), (Fig. 10D). There was a significantly higher concentration of FAS (387.9 ± 8.520 pg/mg) in kidneys of cisplatin-treated GAL-3 KO mice than cisplatin-treated GAL-3 wild mice (332.5 ± 6.395 pg/mg), (P<0.001), (Fig. 10D).
Multiple comparisons between the four experimental groups using one-way ANOVA, followed by Newman-Keuls post hoc test were statistically significant (P<0.0001).
GAL-3 and prosurvival signals
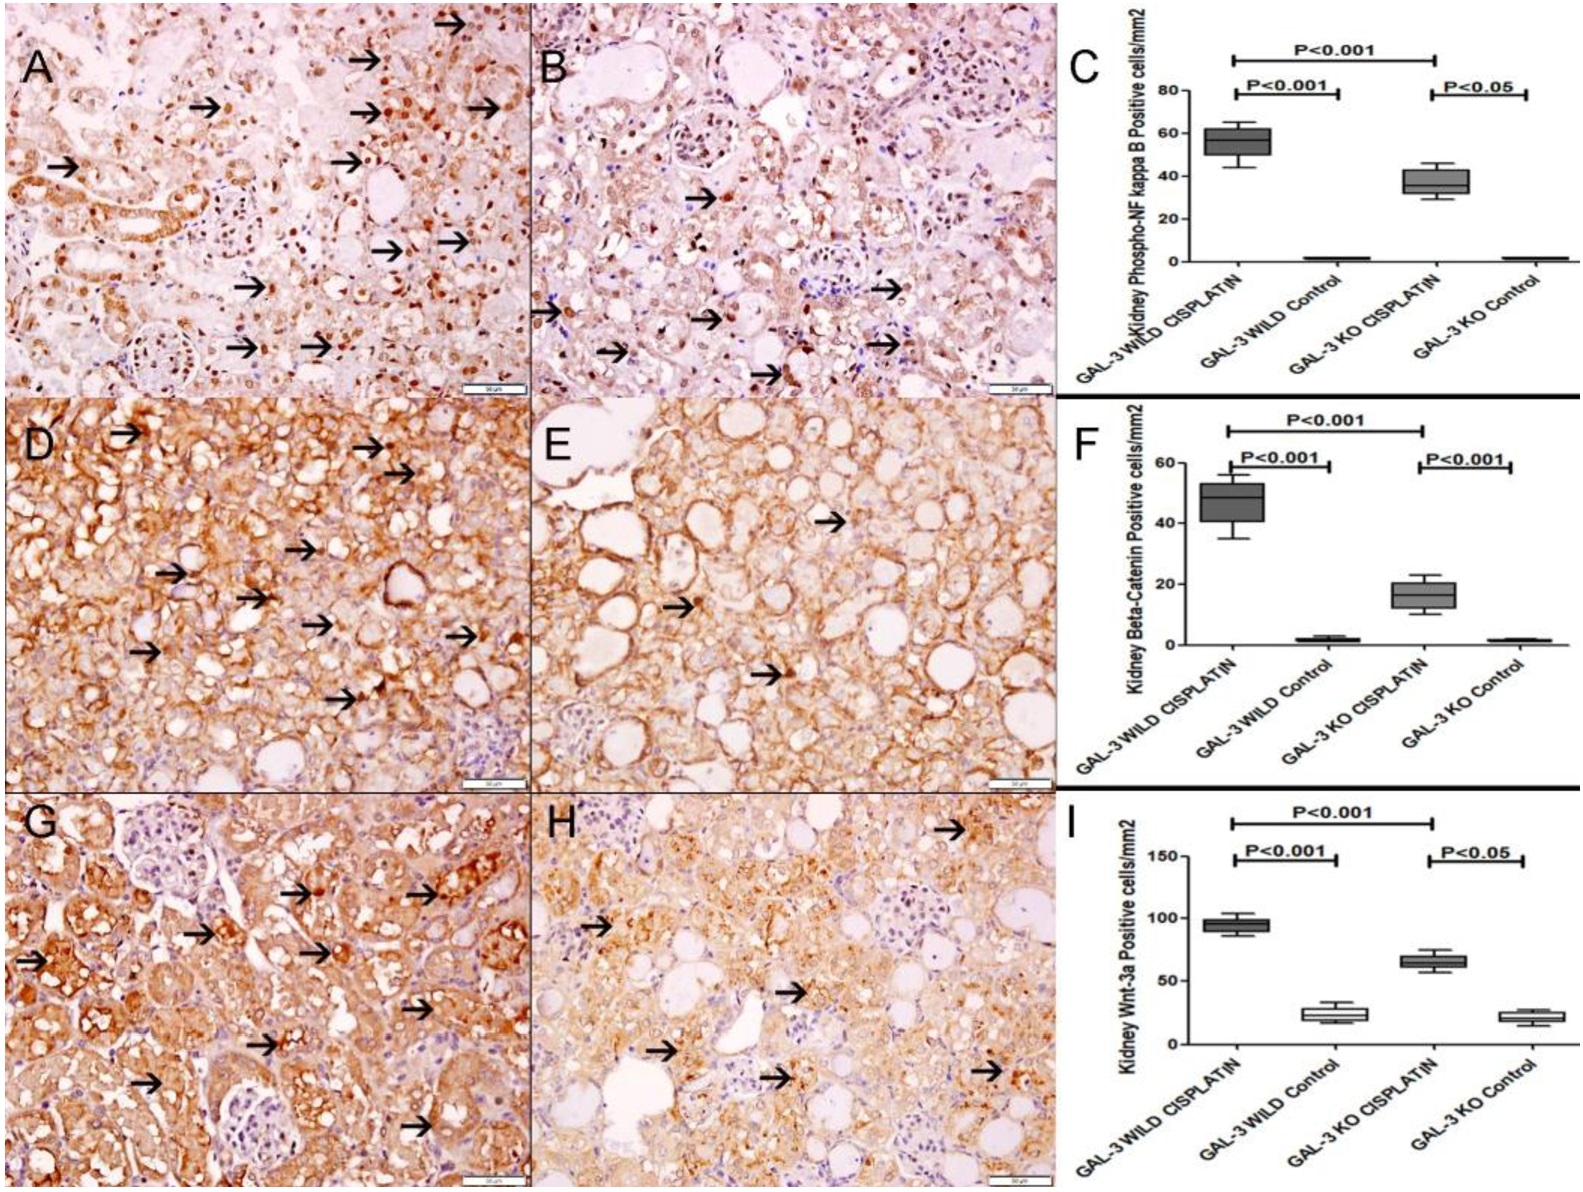
NF-κB. Immunohistochemical staining for phosphor-NF-κB showed a significant higher number of cells stained with phosphor-NF-κB in kidneys of cisplatin-treated GAL-3 wild mice than cisplatin-treated GAL-3 KO mice (P<0.001), (Fig. 12 A-C).
Beta Catenin. Immunohistochemical staining for Beta catenin showed a significant higher number of cells stained with Beta catenin in kidneys of cisplatin-treated GAL-3 wild mice than cisplatin-treated GAL-3 KO mice (P<0.001), (Fig. 12 D-F).
Wnt-3a. Immunohistochemical staining for Wnt-3a showed a significant higher number of cells stained with Wnt-3a in kidneys of cisplatin-treated GAL-3 wild mice than cisplatin-treated GAL-3 KO mice (P<0.001), (Fig. 12 G-I).
Plasma Urea
There was a significant increase in plasma urea concentration (23.88 ± 6.715mmol/L) in cisplatin-treated GAL-3 wild mice when compared with GAL-3 wild control mice (6.688 ± 0.6066 mmol/L), (P<0.001), (Fig. 13A). There was a significant increase in plasma urea concentration (36.10 ± 2.878 mmol/L) in cisplatin-treated GAL-3 KO mice when compared with GAL-3 KO control mice (8.331 ± 0.5194 mmol/L), (P<0.001), (Fig. 13A). There was a significantly higher plasma urea concentration (36.10 ± 2.878 mmol/L) in cisplatin-treated GAL-3 KO mice than cisplatin-treated GAL-3 wild mice (23.88 ± 6.715mmol/L), (P<0.001), (Fig. 13A).
Multiple comparisons between the four experimental groups using one-way ANOVA, followed by Newman-Keuls post hoc test were statistically significant (P<0.0001).
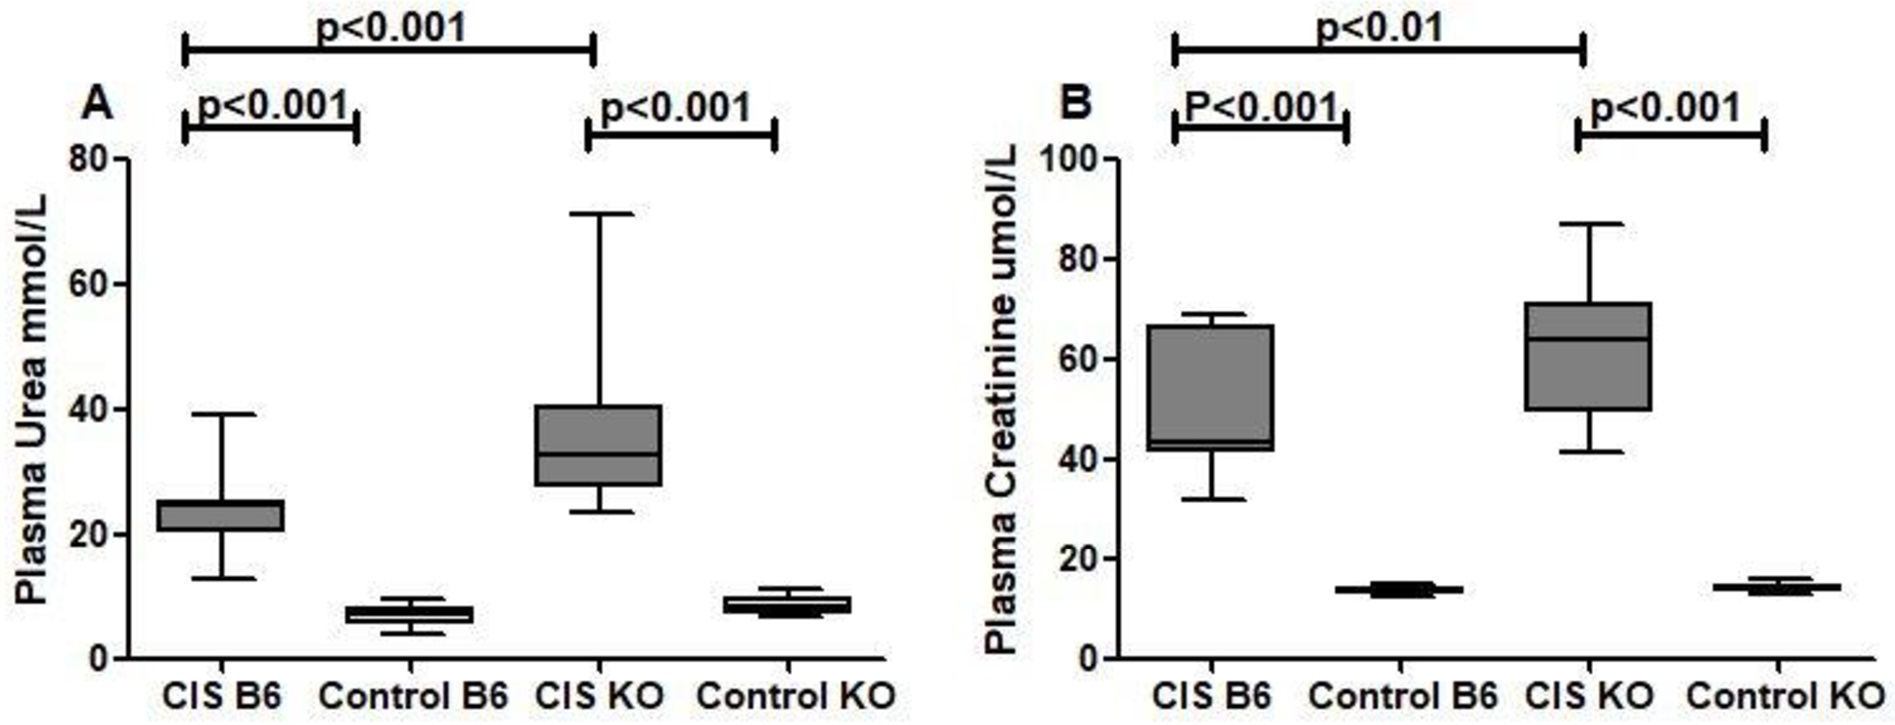
Plasma Creatinine
There was a significant increase in plasma creatinine concentration (48.42 ± 3.992 umol/L) in cisplatin-treated GAL-3 wild mice when compared with GAL-3 wild control mice (13.27 ± 0.3106 umol/L), (P<0.001), (Fig. 13B). There was a significant increase in plasma creatinine concentration (62.36 ± 3.605 umol/L) in cisplatin-treated GAL-3 KO mice when compared with GAL-3 KO control mice (13.88 ± 0.4183 umol/L), (P<0.001), (Fig. 13B). There was a significantly higher plasma creatinine concentration (62.36 ± 3.605 umol/L) in cisplatin-treated GAL-3 KO mice than cisplatin-treated GAL-3 wild mice (48.42 ± 3.992 umol/L), (P<0.01), (Fig. 13B). Multiple comparisons between the four experimental groups using one-way ANOVA, followed by Newman-Keuls post hoc test were statistically significant (P<0.0001).
Discussion
Acute kidney injury is a common health problem worldwide. Every year, there are about 13.3 million cases of acute kidney injury (AKI). A burden that is becoming particularly high in emerging countries [21]. Globally, there are 1.7 million deaths per year caused by AKI. From that, around 1.4 million occur in low- and middle-income countries [21]. AKI is often preventable and treatable with only few, if any, long-term health consequences. Identifying main mechanisms and players that participate in the development of AKI will be reflected on improving patients’ care and minimizing mortality and morbidity.
We have shown a significant increase in GAL-3 concentration in kidneys subjected to AKI. We have also shown a significantly higher expression of GAL-3 in renal tubules affected by acute tubular necrosis in cisplatin-treated GAL-3 wild mice than renal tubules in saline treated control group. Both cytoplasmic and nuclear concentrations of GAL-3 are significantly raised in renal tubules following ATN when compared with saline-treated mice. The raised level of GAL-3 in injured renal tubules suggests GAL-3 as an important player in ATN.
We also have used GAL-3 KO mice to investigate the mechanistic role of GAL-3 in ATN. This helps us to look closely to the modulations of pro-apoptotic, pro-necroptotic, and prosurvival proteins in the presence and absence of GAL-3 and determines whether GAL-3 has any effect or not on these changes.
We have shown a significantly higher percentage of tubules affected by ATN in cisplatin-treated GAL-3 KO mice than in cisplatin-treated GAL-3 wild mice. Our results have also shown a significant increase in cathepsin B and cathepsin D in kidneys affected by ATN. In addition, there are significant higher levels of cathepsin B and cathepsin D in kidneys of cisplatin-treated GAL-3 KO mice than in cisplatin-treated GAL-3 wild mice. Cathepsins play important roles in the signaling pathways driving apoptotic and necrotic cell death, by degrading different substrates and/or contributing to mitochondrial destabilization [22]. Lysosomal proteases, cathepsin B and cathepsin D are abundantly expressed in the kidneys [23].
Cathepsin B, a cysteine proteinase that has optimum activity in acidic environment, participates in many physiological and pathological processes. It digests structural proteins and enzymes in the cell, degrades the main elements of the basement membrane, and activates proenzymes, hormones, and growth factors [24]. Increased expression levels and activation of cathepsin B have been observed in the human proximal tubular epithelial cell line HK-2 undergoing to apoptosis [25].
Cathepsin D is significantly expressed in proximal tubular cells. Cathepsin D is a key lysosomal aspartic protease that is responsible for the degradation of proteins and organelles by autophagy-lysosomal as well as during cellular necrosis and rupture of lysosomal membrane [26]. Cathepsin D is significantly increased in injured tubules following renal ischemia/reperfusion injury supporting our finding of significant increase in cathepsin D in kidney with acute tubular necrosis [27].
The higher levels of Cathepsin B and D with higher percentage of ATN in kidneys of cisplatin treated GAL-3 KO mice than cisplatin treated GAL-3 wild mice suggests GAL-3 as an anti-necrotic mediator.
We have also shown significant higher levels of necroptosis proteins; RIPK1, RIPK3 and MLKL in kidneys of cisplatin-treated mice. Moreover, we have identified significant higher concentrations of RIPK1, RIPK3 and MLKL in kidneys of cisplatin-treated GAL-3 KO mice than cisplatin-treated GAL-3 wild mice.
Studies have shown that cisplatin is associated with increased oxidative stress [28]. Generation of reactive oxygen species (ROS), accumulation of lipid peroxidation products in kidneys, and suppressed antioxidant systems are thought to be major mechanisms of cisplatin-induced AKI [29]. Within the cell, cisplatin is converted into a highly reactive form rapidly reacting with thiol-containing antioxidant molecules such as glutathione [30]. Cisplatin may also cause mitochondrial dysfunction and increased ROS production through an impaired respiratory chain [31]. ROS facilitates RIPK1 autophosphorylation and promotes recruitment of RIPK-3 and the formation of necrosome [32]. In addition, ROS is a critical inducer of lysosomal membrane permeability (LMP) [33].
Cai et al. [34] have shown ROS-mediated LMP is involved in the induction of necroptosis in rabbit intervertebral disc cells. Likewise, RIPK1-induced mitochondrial-ROS production is followed by LMP and mitochondrial dysfunction as a result of a positive feedback loop between Ca2+ and JNK, leading to necroptosis of A549 and H1299 cells [35, 36].
Moreover, it has been shown that upregulated-RIPK3 in necroptosis induces endoplasmic reticulum stress which increases cellular Ca2+ concentration and the expression of xanthine oxidase leading to boosted ROS generation [37].
Cathepsins B and D are the major functional contents released from lysosomes with increased LMP during the process of cell death [34]. Cathepsin B and D activation can augment the necroptotic pathway [38]. So necroptosis can be induced by receptor-independent manner [39]. Besides, reports have shown that there are additional stimuli, other than ROS, cathepsin B and D, for induction of necroptosis and these include up-regulation of TRAIL, and FAS legend proteins [40]. So the increased ROS whether due to cisplatin or the induction of RIPK1 or RIPK3 can lead to increased LMP and release of cathepsin B and D which in turn augment necroptosis. Likewise, the increased ROS can activate RIPK1, recruitment of RIPK3, enhancement of necrosome formation, phosphorylation of MLKL, translocation of phosphorylated MLKL to cell membrane leading to necrotic cell death through plasma membrane permeabilization and rupture.
In this study, we believe that the increased ROS, cathepsin B, cathepsin D, TRAIL and FAS are involved in the induction of necroptosis in ATN.
To determine the role of GAL-3 in necroptosis, we have measured RIPK1, RIPk3 and MLKL concentrations in the presence and absences GAL-3 by using GAL-3 wild and GAL-3 KO mice.
The significantly higher concentrations of RIPK1, RIPK3 and MLKL in cisplatin –treated GAL-3 KO mice than cisplatin-treated GAL-3 mice indicate that knocking-out of GAL-3 is associated with significant increase in necroptosis proteins, suggesting an anti-necroptotic role of GAL-3.
Moreover, we have shown a significantly higher levels of pro-apoptotic proteins; cleaved caspase-3, cleaved PARP, TRAIL, FAS and apoptotic bodies in kidneys following ATN.
During ATN, lysosomal membrane permeabilization allows translocation of cathepsin D and cathepsin B from the lysosome into the cytosol where it can exert its pro-apoptotic function. Cytosolic cathepsin D cleaves Bid protein into tBid triggering the insertion of Bax protein into the mitochondrial membrane. This leads to cytochrome c release from the mitochondria into the cytosol, and the activation of pro-caspases 9 and 3 [41]. In this study, both immunofluorescent staining and protein concentration have shown significantly higher expression of intracellular GAL-3, both cytoplasmic and nuclear fractions, in ATN in kidneys of GAL-3 wild mice compared to control mice.
So the higher levels of pro-apoptotic proteins; cleaved caspase-3, TRAIL, FAS and apoptotic bodies in kidneys of cisplatin-treated GAL-3 KO mice than in cisplatin-treated GAL-3 wild mice suggests an anti-apoptotic role of GAL-3. GAL-3 has been found to be critically involved in apoptosis depending on its subcellular localization. Studies have shown intracellular GAL-3 can inhibit apoptosis [42-44]. In support of the anti-apoptotic role of GAL-3 we have identified a significantly higher number of cells expressing phospho-NF-κB, beta-catenin and Wnt proteins in kidneys of cisplatin-treated GAL-3 wild mice than GAL-3 KO mice. NF-κB is a transcription factor that plays important roles in regulating inflammation, cell proliferation and cell survival. Phosphorylation plays a critical role in the activation of NF-κB downstream of all these stimuli [45]. NF-κB is now recognized as an important contributor to cell survival and protection from apoptosis [46]. The Wnt proteins has been shown to have protective effects on injured cells through its anti-apoptotic function via activation of β-catenin and c-Myc [47].
Wu et al. have also shown a significant increase in p-NF-κB in kidneys with ATN [48]. Wang et al. have also shown up-regulation of Wnt/β-catenin signaling pathway in acute kidney injury [49]. Studies have shown NF-κB to be involved in the induction of GAL-3 [50] as well as GAL-3 is involved in the activation of NF-κB [51]. Interestingly, GAL-3 has been found to be a novel binding partner of β-catenin [52].
These findings suggest that the anti-apoptotic role of GAL-3 can also be mediated through activation of NF-κB and Wnt/β-catenin pathways. GAL-3 appears to link these pro survival signal transduction pathways investigated in our study. These pathways also have cross talk between them at various levels. Wnt/β-catenin pathway players modulate many of their effects through interaction with NF-κB and reciprocally NF-κB also influences the Wnt/β-catenin signaling pathway [53]. Therefore, it is understandable that GAL-3 is playing a central connector role in the prosurvival signal transduction pathways.
Our study demonstrates that the presence or absence of intracellular GAL-3 is associated with significant changes in proapoptotic, pronecroptotic, and prosurvival proteins in cisplatin induced ATN and that the high levels of GAL-3 in renal tubules is mediating an anti-apoptotic, antinecroptotic and prosurvival environment that may shape the future course of the disease. This suggests a protective role for GAL-3 in acute cisplatin induced ATN, which is supported by significantly lower plasma levels of urea and creatinine in GAL-3 wild cisplatin-treated mice than GAL-3 KO cisplatin-treated mice (Fig. 13).
Conclusion
GAL-3 can affect cell survival and death through its interaction with necroptotic, apoptotic and pro-survival proteins in renal tubules during cisplatin-induced acute tubular necrosis.
Author Contributions
All authors reviewed and approved the submitted version of the manuscript. S.A introduced the concept, designed the study, analyzed and interpreted the data, designed the figures and wrote the paper. G.J performed animal experiments and ELISA technique, M.S performed immunohistochemical and immunofluorescent staining and related tissue processing. H.T performed animal experiments and ELISA technique. J.Y performed biochemical analysis of kidney function and submit the resulted data.
Funding
The authors would like to thank College of Medicine & Health Sciences, United Arab Emirates University for their support of this project (Faculty grant #NP-17-06).
Statement of Ethics
All animal experimental procedures were approved by the United Arab Emirates University Animals Research Ethics Committee (Protocol: ERA_2015_3150).
The authors declare to have no competing interests.
| 1 Lameire NH, Bagga A, Cruz D, De Maeseneer J, Endre Z, Kellum JA, Liu KD, Mehta RL, Pannu N, Van Biesen W, Vanholder R: Acute kidney injury: an increasing global concern. Lancet 2013;382:170-179. https://doi.org/10.1016/S0140-6736(13)60647-9 |
||||
| 2 KDIGO: Clinical Practice Guideline for Acute Kidney Injury. Kidney Int 2012;2:1-138. | ||||
| 3 Schumer M, Colombel MC, Sawczuk IS, Gobe G, Connor J, O'Toole KM, Olsson CA, Wise GJ, Buttyan R: Morphologic, biochemical, and molecular evidence of apoptosis during the reperfusion phase after brief periods of renal ischemia. Am J Pathol 1992;140:831-838. | ||||
| 4 Schumer AT, Davies DR, McLaren AJ, Cerundolo L, Morris PJ, Fuggle SV: Apoptosis in ischemia/reperfusion injury of human renal allografts. Transplantation 1998;66:872-876. https://doi.org/10.1097/00007890-199810150-00010 |
||||
| 5 Degterev A, Huang Z, Boyce M, Li Y, Jagtap P, Mizushima N, Cuny GD, Mitchison TJ, Moskowitz MA, Yuan J: Chemical inhibitor of nonapoptotic cell death with therapeutic potential for ischemic brain injury. Nat Chem Biol 2005;1:112-119. https://doi.org/10.1038/nchembio711 |
||||
| 6 Vandenabeele P, Galluzzi L, Vanden Berghe T, Kroemer G: Molecular mechanisms of necroptosis: an ordered cellular explosion. Nat Rev Mol Cell Biol 2010;11:700-714. https://doi.org/10.1038/nrm2970 |
||||
| 7 Chen X, Li W, Ren J, Huang D, He WT, Song Y, Yang C, Li W, Zheng X, Chen P, Han J: Translocation of mixed lineage kinase domain-like protein to plasma membrane leads to necrotic cell death. Cell Res 2014;24:105-121. https://doi.org/10.1038/cr.2013.171 |
||||
| 8 Cai Z, Jitkaew S, Zhao J, Chiang HC, Choksi S, Liu J, Ward Y, Wu LG, Liu ZG: Plasma membrane translocation of trimerized MLKL protein is required for TNF-induced necroptosis. Nat Cell Biol 2014;16:55-65. https://doi.org/10.1038/ncb2883 |
||||
| 9 Wang Y, Liu Y, Liu Y, Zhou W, Wang H, Wan G, Sun D, Zhang N, Wang Y: A polymeric prodrug of cisplatin based on pullulan for the targeted therapy against hepatocellular carcinoma. Int J Pharm 2015;483:89-100. https://doi.org/10.1016/j.ijpharm.2015.02.027 |
||||
| 10 Pabla N, Dong Z: Cisplatin nephrotoxicity: mechanisms and renoprotective strategies. Kidney Int 2008;73:994-1007. https://doi.org/10.1038/sj.ki.5002786 |
||||
| 11 Mi XJ, Hou JG, Wang Z, Han Y, Ren S, Hu JN, Chen C, Li W: The protective effects of maltol on cisplatin-induced nephrotoxicity through the AMPK-mediated PI3K/Akt and p53 signaling pathways. Sci Rep 2018;8:15922. https://doi.org/10.1038/s41598-018-34156-6 |
||||
| 12 Ozkok A, Edelstein CL: Pathophysiology of cisplatin-induced acute kidney injury. Biomed Res Int 2014;2014:1-17. https://doi.org/10.1155/2014/967826 |
||||
| 13 Hughes RC: Secretion of the galectin family of mammalian carbohydrate-binding proteins. Biochim Biophys Acta 1999;1473:172-185. https://doi.org/10.1016/S0304-4165(99)00177-4 |
||||
| 14 Liu FT, Patterson RJ, Wang JL: Intracellular functions of galectins. Biochim Biophys Acta 2002;1572:263-273. https://doi.org/10.1016/S0304-4165(02)00313-6 |
||||
| 15 van den Brûle FA, Waltregny D, Liu FT, Castronovo V: Alteration of the cytoplasmic/nuclear expression pattern of galectin-3 correlates with prostate carcinoma progression. Int J Cancer 2000;89:361-367. https://doi.org/10.1002/1097-0215(20000720)89:4<361::AID-IJC8>3.0.CO;2-U |
||||
| 16 Xue J, Gao X, Fu C, Cong Z, Jiang H, Wang W, Chen T, Wei Q, Qin C: Regulation of galectin-3-induced apoptosis of Jurkat cells by both O-glycans and N-glycans on CD45. FEBS Lett 2013;587:3986-3994. https://doi.org/10.1016/j.febslet.2013.10.034 |
||||
| 17 Matarrese P, Fusco O, Tinari N, Natoli C, Liu FT, Semeraro ML, Malorni W, Iacobelli S: Galectin-3 overexpression protects from apoptosis by improving cell adhesion properties. Int J Cancer 2000;85:545-554. https://doi.org/10.1002/(SICI)1097-0215(20000215)85:4<545::AID-IJC17>3.0.CO;2-N |
||||
| 18 Oka N, Nakahara S, Takenaka Y, Fukumori T, Hogan V, Kanayama HO, Yanagawa T, Raz A: Galectin-3 inhibits tumor necrosis factor-related apoptosis-inducing ligand-induced apoptosis by activating Akt in human bladder carcinoma cells. Cancer Res 2005;65:7546-7553. https://doi.org/10.1158/0008-5472.CAN-05-1197 |
||||
| 19 Hashmi S, Al-Salam S: Galectin-3 is expressed in the myocardium very early post-myocardial infarction. Cardiovasc Pathol 2015;24:213-223. https://doi.org/10.1016/j.carpath.2014.12.001 |
||||
| 20 Zhang S, Li R, Dong W, Yang H, Zhang L, Chen Y, Wang W, Li C, Wu Y, Ye Z, Zhao X, Li Z, Zhang M, Liu S, Liang X: RIPK3 mediates renal tubular epithelial cell apoptosis in endotoxin‑induced acute kidney injury. Mol Med Rep 2019;20:1613-1620. https://doi.org/10.3892/mmr.2019.10416 |
||||
| 21 Liyanage T, Ninomiya T, Jha V, Neal B, Patrice HM, Okpechi I, Zhao MH, Lv J, Garg AX, Knight J, Rodgers A, Gallagher M, Kotwal S, Cass A, Perkovic V: Worldwide access to treatment for end-stage kidney disease: a systematic review. Lancet 2015;385:1975-1982. https://doi.org/10.1016/S0140-6736(14)61601-9 |
||||
| 22 Turk B, Stoka V: Protease signalling in cell death: caspases versus cysteine cathepsins. FEBS Lett 2007;581:2761-2767. https://doi.org/10.1016/j.febslet.2007.05.038 |
||||
| 23 Pavlock GS, Southard JH, Starling JR, Belzer FO: Lysosomal enzyme release in hypothermically perfused dog kidneys. Cryobiology 1984;21:521-528. https://doi.org/10.1016/0011-2240(84)90050-6 |
||||
| 24 Werle B, Jülke B, Lah T, Spiess E, Ebert W: Cathepsin B fraction active at physiological pH of 7.5 is of prognostic significance in squamous cell carcinoma of human lung. Br J Cancer 1997;75:1137-1143. https://doi.org/10.1038/bjc.1997.196 |
||||
| 25 Wang C, Jiang Z, Yao J, Wu X, Sun L, Liu C, Duan W, Yan M, Sun L, Liu J, Zhang L: Participation of cathepsin B in emodin-induced apoptosis in HK-2 Cells. Toxicol Lett 2008;181:196-204. https://doi.org/10.1016/j.toxlet.2008.05.013 |
||||
| 26 Suzuki C, Tanida I, Ohmuraya M, Oliva Trejo JA, Kakuta S, Sunabori T, Uchiyama Y: Lack of Cathepsin D in the Renal Proximal Tubular Cells Resulted in Increased Sensitivity against Renal Ischemia/Reperfusion Injury. Int J Mol Sci 2019;20:1711. https://doi.org/10.3390/ijms20071711 |
||||
| 27 Lameire N, Van Biesen W, Vanholder R. Acute renal failure. Lancet 2005;365:417-430. https://doi.org/10.1016/S0140-6736(05)70238-5 |
||||
| 28 Yu W, Chen Y, Dubrulle J, Stossi F, Putluri V, Sreekumar A, Putluri N, Baluya D, Lai SY, Sandulache VC: Cisplatin generates oxidative stress which is accompanied by rapid shifts in central carbon metabolism. Sci Rep 2018;8:4306. https://doi.org/10.1038/s41598-018-22640-y |
||||
| 29 Aydinoz S, Uzun H, Cermiketal G: Effects of different doses of hyperbaric oxygen on cisplatin-induced nephrotoxicity. Renal Failure 2007;29:257-263. https://doi.org/10.1080/08860220601166487 |
||||
| 30 Siddik ZH: Cisplatin: mode of cytotoxic action and molecular basis of resistance. Oncogene 2003;22:7265-7279. https://doi.org/10.1038/sj.onc.1206933 |
||||
| 31 Kruidering M, Van de Water B, de Heer E, Mulder GJ, Nagelkerke JF: Cisplatin-induced nephrotoxicity in porcine proximal tubular cells: mitochondrial dysfunction by inhibition of complexes I to IV of the respiratory chain. J Pharmacol Exp Ther 1997;280:638-649. | ||||
| 32 Zhang DW, Shao J, Lin J, Zhang N, Lu BJ, Lin SC, Dong MQ, Han J: RIP3, an energy metabolism regulator that switches TNF-induced cell death from apoptosis to necrosis. Science 2009;325:332-336. https://doi.org/10.1126/science.1172308 |
||||
| 33 Vanden Berghe T, Vanlangenakker N, Parthoens E, Deckers W, Devos M, Festjens N, Guerin CJ, Brunk UT, Declercq W, Vandenabeele P: Necroptosis, necrosis and secondary necrosis converge on similar cellular disintegration features. Cell Death Differ 2010;17:922-930. https://doi.org/10.1038/cdd.2009.184 |
||||
| 34 Cai X, Liu Y, Hu Y, Liu X, Jiang H, Yang S, Shao Z, Xia Y, Xiong L: ROS-mediated lysosomal membrane permeabilization is involved in bupivacaine-induced death of rabbit intervertebral disc cells. Redox Biol 2018;18:65-76. https://doi.org/10.1016/j.redox.2018.06.010 |
||||
| 35 Sun W, Yu J, Gao H, Wu X, Wang S, Hou Y, Lu JJ, Chen X: Inhibition of lung cancer by 2-methoxy-6-acetyl-7-methyljuglone through induction of necroptosis by targeting receptor-interacting protein 1. Antioxid Redox Signal 2019;31:93-108. https://doi.org/10.1089/ars.2017.7376 |
||||
| 36 Ma YM, Peng YM, Zhu QH, Gao AH, Chao B, He QJ, Li J, Hu YH, Zhou YB: Novel CHOP activator LGH00168 induces necroptosis in A549 human cancer cells via ROS-mediated ER stress and NF-kappaB inhibition. Acta Pharmacol Sin 2016;37:1381-1390. https://doi.org/10.1038/aps.2016.61 |
||||
| 37 Zhu P, Hu S, Jin Q, Li D, Tian F, Toan S, Li Y, Zhou H, Chen Y: RIPK3 promotes ER stress induced necroptosis in cardiac IR injury: a mechanism involving calcium overload/XO/ROS/mPTP pathway. Redox Biol 2018;16:157-168. https://doi.org/10.1016/j.redox.2018.02.019 |
||||
| 38 Wang W, Wang WH, Azadzoi KM, Su N, Dai P, Sun J, Wang Q, Liang P, Zhang W, Lei X, Yan Z, Yang JH: Activation of innate antiviral immune response via double-stranded RNA-dependent RLR receptor-mediated necroptosis. Sci Rep 2016;6:22550. https://doi.org/10.1038/srep22550 |
||||
| 39 Canli Ö, Alankuş YB, Grootjans S, Vegi N, Hültner L, Hoppe PS, Schroeder T, Vandenabeele P, Bornkamm GW, Greten FR: Glutathione peroxidase 4 prevents necroptosis in mouse erythroid precursors. Blood 2016;127:139-148. https://doi.org/10.1182/blood-2015-06-654194 |
||||
| 40 Alu A, Han X, Ma X, Wu M, Wei Y, Wei X: The role of lysosome in regulated necrosis. Acta Pharm Sin B 2020;10:1880-1903. https://doi.org/10.1016/j.apsb.2020.07.003 |
||||
| 41 Stoka V, Turk B, Schendel SL, Kim TH, Cirman T, Snipas SJ, Ellerby LM, Bredesen D, Freeze H, Abrahamson M, Bromme D, Krajewski S, Reed JC, Yin XM, Turk V, Salvesen GS: Lysosomal protease pathways to apoptosis. cleavage of bid, not pro-caspases, is the most likely route. J Biol Chem 2001;276:3149-3157. https://doi.org/10.1074/jbc.M008944200 |
||||
| 42 Yang RY, Hsu DK, Liu FT: Expression of galectin-3 modulates T-cell growth and apoptosis. Proc Natl Acad Sci U S A 1996;93:6737-6742. https://doi.org/10.1073/pnas.93.13.6737 |
||||
| 43 Al-Salam S, Hashmi S, Jagadeesh GS, Tariq S: Galectin-3: A Cardiomyocyte Antiapoptotic Mediator at 24-Hour Post Myocardial Infarction. Cell Physiol Biochem 2020;54:287-302. https://doi.org/10.33594/000000220 |
||||
| 44 Al-Salam S, Hashmi S: Myocardial Ischemia Reperfusion Injury: Apoptotic, Inflammatory and Oxidative Stress Role of Galectin-3. Cell Physiol Biochem 2018;50:1123-1139. https://doi.org/10.1159/000494539 |
||||
| 45 Christian F, Smith EL, Carmody RJ: The Regulation of NF-κB Subunits by Phosphorylation. Cells 2016;5:E12. https://doi.org/10.3390/cells5010012 |
||||
| 46 Mercurio F, Manning AM: Multiple signals converging on NF-kappaB. Curr Opin Cell Biol 1999;11:226-232. https://doi.org/10.1016/S0955-0674(99)80030-1 |
||||
| 47 You Z, Saims D, Chen S, Zhang Z, Guttridge DC, Guan KL, MacDougald OA, Brown AM, Evan G, Kitajewski J, Wang CY: Wnt signaling promotes oncogenic transformation by inhibiting c-Myc-induced apoptosis. J Cell Biol 2002;157:429-440. https://doi.org/10.1083/jcb.200201110 |
||||
| 48 Wu C, Liu L, Xu W, Jian J, Zhang N, Wang X, Guo B: Correlation analysis of inflammatory response and Klotho expression in renal tissue of mice with acute renal injury induced by cisplatin]. Xi Bao Yu Fen Zi Mian Yi Xue Za Zhi 2019;35:702-706. | ||||
| 49 Wang SY, Yang SX, Zhao XX, Chen F, Shi J: Expression of the Wnt/β-catenin signal pathway in patients with acute renal injury. Eur Rev Med Pharmacol Sci 2017;21:4661-4667, | ||||
| 50 Dumic J, Lauc G, Flögel M.Expression of galectin-3 in cells exposed to stress-roles of jun and NF-kappaB. Cell Physiol Biochem 2000;10:149-158. https://doi.org/10.1159/000016345 |
||||
| 51 Zhou W, Chen X, Hu Q, Chen X, Chen Y, Huang L. Galectin-3 activates TLR4/NF-κB signaling to promote lung adenocarcinoma cell proliferation through activating lncRNA-NEAT1 expression. BMC Cancer 2018;18:580. https://doi.org/10.1186/s12885-018-4461-z |
||||
| 52 Shimura T, Takenaka Y, Fukumori T, Tsutsumi S, Okada K, Hogan V, Kikuchi A, Kuwano H, Raz A. Implication of galectin-3 in Wnt signaling. Cancer Res 2005;65:3535-3537. https://doi.org/10.1158/0008-5472.CAN-05-0104 |
||||
| 53 Ma B, Hottiger MO. Crosstalk between Wnt/β-Catenin and NF-κB Signaling Pathway during Inflammation. Front Immunol 2016;7:378. https://doi.org/10.3389/fimmu.2016.00378 |
||||