×
![]()
Corresponding Author: Joice Margareth de Almeida Rodolpho
Rod. Washington Luís, Km 235 Caixa Postal 676,
CEP 13565-905 - São Carlos - SP (Brazil)
Tel. +55 (16) 33518325 , E-Mail j_jrodolpho@hotmail.com
Apoptosis and Oxidative Stress Triggered by Carbon Black Nanoparticle in the LA-9 Fibroblast
Joice Margareth de Almeida Rodolphoa
Krissia Franco de Godoya
Patrícia Brassolattia
Bruna Dias de Lima Fragellia
Cynthia Aparecida de Castroa
Marcelo Assisb
Carlos Speglichc
Juliana Cancino-Bernardid
Elson Longob
Fernanda de Freitas Anibala
aLaboratório de Inflamação e Doenças Infecciosas, Departamento de Morfologia e Patologia, Universidade Federal de São Carlos, São Carlos, Brazil, bCentro de Desenvolvimento de Materiais Funcionais, Departamento de Química, Universidade Federal de São Carlos, São Carlos, Brazil, cCentro de Pesquisa Leopoldo Américo Miguez de Mello CENPES/Petrobrás, Rio de Janeiro, Brazil, dGrupo de Nanomedicina e Nanotoxicologia, Instituto de Física de São Carlos, Universidade de São Paulo, São Carlos, Brazil
Introduction
Nanostructured materials are widely used in several industrial sectors. Among them is Carbon Black (CB), with applications in the fields of nanotechnology, oil exploration and reservoir characterization, in addition to use in medicine, catalysis and environmental remediation [1].
To facilitate the interaction of the surface of the nanoparticle (NP) with the medium and to improve their dispensability and compatibility, CB can be bonded to covalent polymers; for that its surface is sequentially modified with ethylenediamine (EDA) generating the nanoparticle called CB-EDA [2]. This modification with EDA can completely alter the biological activity of NP, as it is a combination of modified physical-chemical properties, making CB-EDA a substance with toxic potential [3].
However, few studies are found in the literature in biological models with the NP CB-EDA that discuss its application and if the use can be potentially harmful, since its large surface area can interact with different biological systems. Thus, considering the variety of applications and the potential exposure of workers and consumers to this NP, it is of fundamental importance to assess the risks of its cytotoxicity [4].
This leads to the urgent need to understand how NP CB-EDA acts in biological systems, through in vitro/in vivo analysis, seeking to understand how oxidative pathways, such as the production of reactive oxygen species (ROS) and reactive nitrogen species (NOS), are related to synthesis and release of pro-inflammatory molecules, such as TNF-alpha, generating cell death by apoptosis with release of death markers, such as membrane enzymes and reduction of cytotoxicity [5–13].
Thus, it is necessary to evaluate the cytotoxic effects of NP CB-EDA in biological models. Therefore, the aim of this study is to elucidate mechanisms responsible for cytotoxicity in fibroblast cells lineage LA-9, after exposure to NP CB-EDA, to clarify the relationships between inflammation, oxidative stress production and apoptosis.
Materials and Methods
Nanoparticle
The NP CB-EDA was provided by the petroleum industry Centro de Pesquisa Leopoldo Américo Miguez de Mello CENPES/Petrobrás, Rio de Janeiro, RJ, Brazil. PETROBRAS. The experimental design is illustrated in Supplementary Fig. 1 (for all supplementary material see www.cellphysiolbiochem.com).
Characterization
The morphological and size features of NP CB-EDA samples was examined by transmission electron microscopy TEM, and high-resolution TEM (HR-TEM) micrographs were performed with a FEI TECNAI F20 (Netherlands) microscope operating at 200 kV. The zeta potential of the NP CB-EDA suspended in water, DMEM and DMEM + 10% was evaluated using a Malvern spectrometer Nano-ZS (Marvern Instruments). The results are presented as mean ± SD resulting from three different measurements.
Fibroblasts LA9 culture
Fibroblasts of the LA9 lineage of mouse adipose connective tissue from the cell bank of Rio de Janeiro (BCRJ), code 0142, were used. Cultivation occurred in bottles containing Dulbecco’s Modified Eagle’s Medium (DMEM, Sigma) supplemented with 10% fetal bovine serum (LGC Biotechnology) at 37°C and with 5% CO2. A protocol was established with 3 independent experiments in biological triplicate with the following concentrations of the NP CB-EDA modified with ethylenediamine (NP CB-EDA): 1, 50, 250 500 and 1000 µg/mL, for 24 and 48 hours.
Cytotoxicity assay with MTT and EC50
The cytotoxic activity of NP CB-EDA was evaluated using the MTT colorimetric assay (MTT [3-(4,5-dimethylthiazol-2-yl)-2,5-diphenylthetrazolium bromide] -Sigma-Aldrich, USA) (MOSMANN, 1983). Initially, a preliminary test was performed to determine which concentrations of NP CB-EDA would be included in subsequent tests, based on the literature, that reported the most studied concentrations for nanoparticles vary from 1 to 1000 µg / ml [5, 6]. The concentrations of 1, 50, 250, 500 and 1000 µg/ml were chosen to carry out the study. In a 96-well plate 6x10³ cells/well were seeded. After 24 hours for cell adhesion, concentrations of NP CB-EDA were applied. After the exposure time (24 and 48 hours) a 5 mg/mL MTT solution was added to each well and the reaction occurred for 4 hours. In 100 µL of DMSO the formazan crystals produced were solubilized and the absorbance was measured at 570 nm on the plate spectrophotometer (Thermo Scientific™ Multiskan™ GO Microplate Spectrophotometer). The absorbance values were used to calculate the EC50 (concentration that induces half the effect) and cell viability (% of cytotoxicity = absorbance of the test groups x 100/absorbance of the control group). The percentage of cell viability occurred by comparing the data obtained with the control group according to the equation below:
% cytotoxicity = Experimental group x 100
Average control
Detection of reactive nitrogen species (RNS)
Nitric oxide (NO) production was evaluated using the Griess reaction [14, 15]. In a 96-well plate 1x10⁴ cells/well were cultured. After 24 hours for cell adhesion, concentrations 1, 50, 250 500 and 1000 µg/mL of NP CB-EDA were applied. After the exposure times (24 and 48 hours), the supernatant was collected, then 50 µL were added to a new 96-well plate; 50 µL of the Griess reagent (1: 1 mixture of solution A [1% sulfanilamide in 5% phosphoric acid) and 50 µL of solution B [0.1% N-1-naphthylethylenediamine dihydrochloride]) were added followed by incubation for 15 minutes. The absorbance was measured at 540 nm on the plate spectrophotometer (Thermo Scientific™ Multiskan™ GO Microplate Spectrophotometer). A standard curve was constructed with sodium nitrite.
Quantification of IL-6 and TNF-α cytokines
The levels of cytokines IL-6 and TNF-α were measured using the ELISA quantification kit (BD Biosciences). In a 96-well plate 1x10⁴ cells/well were cultured. After 24 hours for cell adhesion, concentrations 1, 50, 250 500 and 1000 µg/mL of NP CB-EDA were applied. After the exposure time (24 and 48 hours), the pool of supernatant from each group was collected and 50 µL was added to a new 96-well plate for ELISA. The absorbance was read at 450 nm on the plate spectrophotometer (Thermo Scientific™ Multiskan™ GO Microplate Spectrophotometer). The cytokine concentrations produced were calculated using a standard kit curve for each sample.
LDH (Lactate dehydrogenase)
Cytotoxicity damage to the cell membrane was assessed by measuring LDH production according to the CyQuant™ LDH Cytotoxicity Assay Kit (Invitrogen). In a 96-well plate 1x10⁴ cells/well were seeded. After 24 hours for cell adhesion, concentrations of NP CB-EDA were applied. After the exposure times (24 and 48 hours), the supernatant from each group was collected and 50 µL was added to a new 96-well plate. The reagent solution 50 µL was added to each well for 30 minutes. The absorbance was read at 490 nm and 680 nm on the plate spectrophotometer (Thermo Scientific™ Multiskan™ GO Microplate Spectrophotometer). To determine LDH activity, the values obtained at 680 nm from 490 nm were subtracted and the % cytotoxicity was calculated using the formula:
% cytotoxicity = (Experimental group−spontaneous LDH activity) x 100
(Maximum LDH activity−spontaneous LDH activity)
The wells of spontaneous LDH activity contained 10 µL of water and the maximum LDH activity contained 10 µL of lysis solution.
Detection of reactive oxygen species (ROS)
The production of reactive oxygen species (ROS) was measured using the fluorescent probe DCFH-DA (2′,7′-Dichlorodihydrofluorescein Diacetate) (Sigma-Aldrich) [16]. In a 96-well plate 1x10⁴ cells/well were cultured. After 24 hours for cell adhesion, concentrations of NP CB-EDA were applied. After the exposure times (24 and 48 hours), the DCFH-DA probe diluted in medium for 30 minutes was applied to each well. The wells were washed with PBS 1X and the fluorescence emission was read at 485-530 nm on the Spectra MAX i3 ® plate spectrophotometer (Molecular Devices). The values obtained were transformed into percentages using the same formula previously mentioned in the MTT test.
Clonogenic assay
The capacity of fibroblasts LA 9 to recover (forming colonies) after exposure to NP CB-EDA was assessed using the clonogenic assay [17]. In a 6-well plate 1000 cells/well were cultured. After 24 hours for cell adhesion, concentrations of NP CB-EDA were applied. After the exposure times (24 and 48 hours) the supernatant was removed and discarded and culture medium was added (1mL). After 7 days of recovery, the cells were fixed with methanol and stained with 0.1% violet crystal. The wells were photographed and using the ImageJ 1.53a software [18] colony counts were made. The absorbance reading was measured at 570 nm in a plate spectrophotometer (Thermo Scientific™ Multiskan™ GO Microplate Spectrophotometer).
Cell morphology
Fibroblasts LA9 morphology was evaluated after exposure to different concentrations of NP CB-EDA. In a 96-well plate 1x10⁴ cells/well were seeded. After 24 hours for cell adhesion, concentrations of NP CB-EDA were applied. After the exposure times (24 and 48 hours), the cell morphology was observed in an optical microscope Axiovert 40 CFL (Zeiss), which images were captured using the coupled camera model LOD-3000 (Bio Focus) and analyzed by software Future WinJoe TM version 2.0.
Cell death by apoptosis/ necrosis using the Annexin V marker
Cell death by apoptosis and necrosis was assessed with the annexin V marker using the BD Biosciences detection kit. In a 24-well plate 1x10⁵ cells/well were cultured. After 24 hours for cell adhesion, concentrations of NP CB-EDA were applied. After the exposure times (24 and 48 hours), the plates were centrifuged and washed; then PE Annexin V and 7AAd antibodies (1 µl/well in binding buffer) were added. The reaction took place for 15 minutes. An Accuri™ C6 BD Biosciences flow cytometer was used for analysis (gate 10.000 events). Data analysis was made using the software flowJo 10.7.1 (BD Biosciences).
Cell death by apoptosis/necrosis with Acridine Orange and Propidium Iodide
Cell death by apoptosis or necrosis was analyzed through an image stained with Acridine Orange (LA) and Propidium Iodide (IP). In a 96-well plate 1x10⁴ cells/well were cultured. After 24 hours for cell adhesion, concentrations of NP CB-EDA were applied. After the exposure times (24 and 48 hours), the supernatant from the wells was removed and 30 µL of LA/IP 0.1% (1:1) pigment were added to each well for 15 minutes. Then the wells were washed and medium was added (1mL). The images were obtained using an automated high-resolution epifluorescent microscopy system ImageXpress Micro (Molecular Devices) with a 40-x objective lens and FITC and Texas Red filters with image overlay.
Statistical analysis
The results were analyzed using GraphPad Prism 7.0 (San Diego, California, USA) and Sigmaplot software (version 14). The identification of the discrepant data was performed through the Grubbs analysis, followed by the distribution of variables tested using the normality (Shapiro-Wilk test) and equal variance (Levene method). For the analysis of multiple comparisons, Two-way ANOVA with Tukey post hoc tests were used to evaluate the variance between groups for parametric data (results were presented in mean and standard deviation) and nonparametric data, the Kruskal-Wallis test was used with post hoc Dunn (results were presented as the median with the upper and lower quartiles: Me [Q1; Q3]). The statistical significance established was p <0.05.
Results
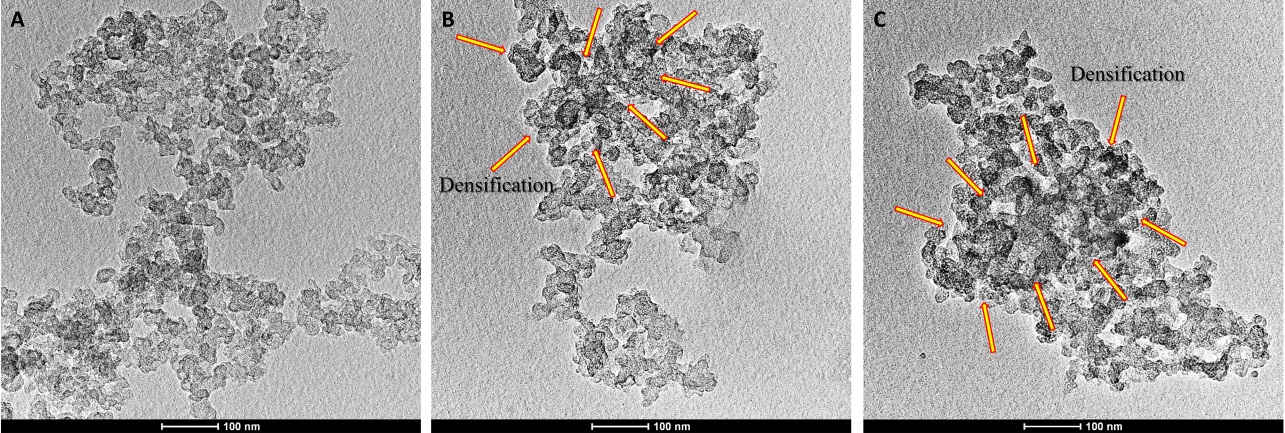
The analysis of TEM was performed to observe the size of pure CB-EDA nanoparticles, CB-EDA 500 µg/ml and CB-EDA 1000 µg/ml, as well as their profile of agglomeration, according to the increase of their concentration in the culture medium (Fig. 1). It was observed for all samples that there is no change in the size of the individual CB particles, which vary between 13 and 68 nm, with an average size of 48 nm. However, the increase in the concentration of CB nanoparticles in the culture medium causes them to start to agglomerate, generating dense regions in specific areas (Fig. 1B, C). The interaction of CB nanoparticles with the culture medium causes the formation of protein corona on their surfaces, which can change not only intrinsic characteristics of the nanoparticles, but also their available surface area. [19, 20]. This happens because of the change in the surface charge of the CB nanoparticles in the culture medium, which becomes more positive, due to the presence of multivalent cations that are a constituent part of the cell culture medium used [11]. The surface charge of NPCB-EDA dispersed in different medium was compared by zeta potential measurements. The zeta potential of the NP CB-EDA in water was approximately -13.3 ± 1.59 mV, revealing a negative charged nanoparticle due to the presence of carboxyl groups at their surface. Zeta potential of CB-EDA in culture medium further confirmed the decrease of their negative charge due to the corona protein formation. The zeta potential of CB-EDA changed from highly negative to -12.5 ± 1.05 mV in DMEM and -9.21 ± 1.24 mV in DMEM + 10% FBS.
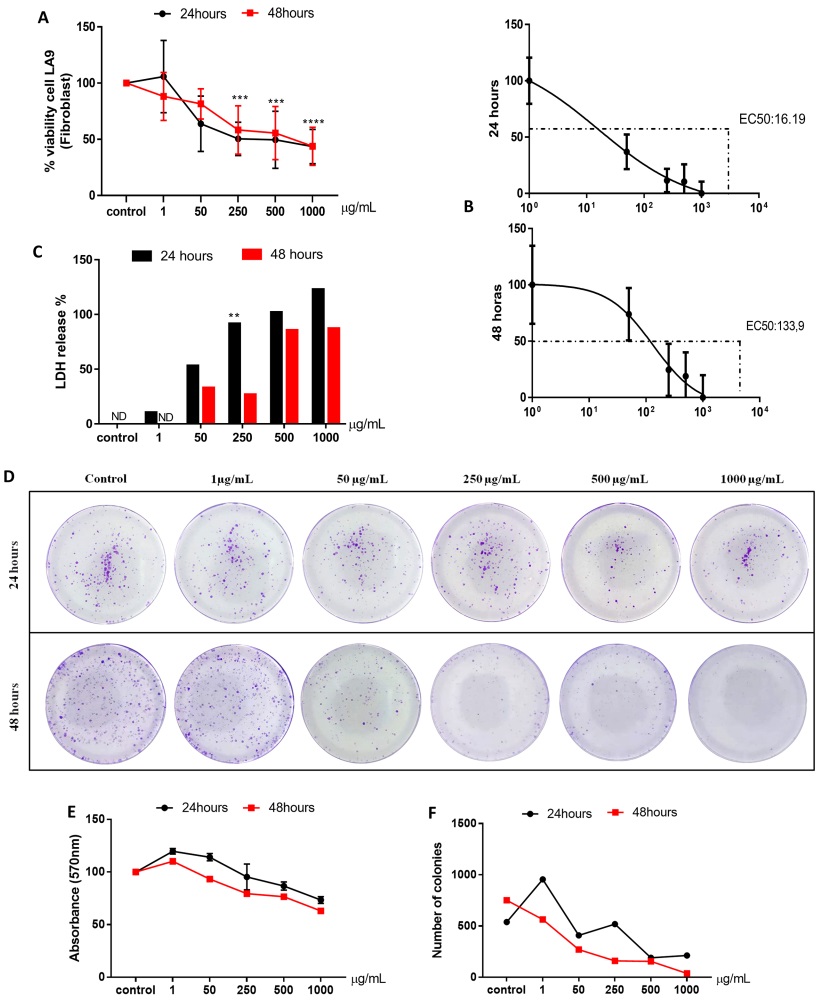
Fig. 2A and B shows the cell viability and EC50 of fibroblasts LA-9 after 24 and 48 hours of exposure to CB-EDA NP in the groups control, 1, 50, 250, 500 and 1000 µg / ml. Cell viability decreased significantly in 24 hours in the groups exposed to 250 µg / ml, 500 µg / ml and 1000 µg / ml of CB-EDA NP, when compared to the control group, and in 48 hours in the groups exposed to 250 µg / ml, 500 µg / ml and 1000 µg / ml of CB-EDA NP, when compared to the control group. There was no significant difference between the two periods (Fig. 2A). EC50 was calculated according to each concentration and each stimulated time of exposure is shown in (Fig. 2B). In 24 hours the EC50 was 16.19 µL, and in 48 hours it was 133.9 µL.
The rupture of the membrane is shown on the LDH assay at 24 and 48 hours, after exposure of different concentrations of NP CB-EDA (1, 50, 250, 500 and 1000 µg/ml) in fibroblasts LA9 (Fig. 2C). The data shows that there was a significant difference in 24 hours in the group exposed to 1000 µg/ml when compared to the control group. Within 48 hours there was a significant difference in the concentrations of 50 µg/ml and 1000 µg/ml, when compared to the control group.
In Fig. 2D, it is observed the colony formation test (clonogenic assay) of the control group and the groups exposed to NP CB-EDA 1.50, 250, 500 and 1000 µg/ml in 24 and 48 hours. The decrease in the number of colonies was observed both in 24 and 48 hours at concentrations of 250, 500 and 1000 µg/ml of the NP CB-EDA, when compared with the control group (Fig. 2E). The concentrations of 500 and 1000 µg/ml showed similar number of colonies compared to the control group (Fig, 2F). As a non-colorimetric test, it helps to certify the feasibility of the other tests performed.
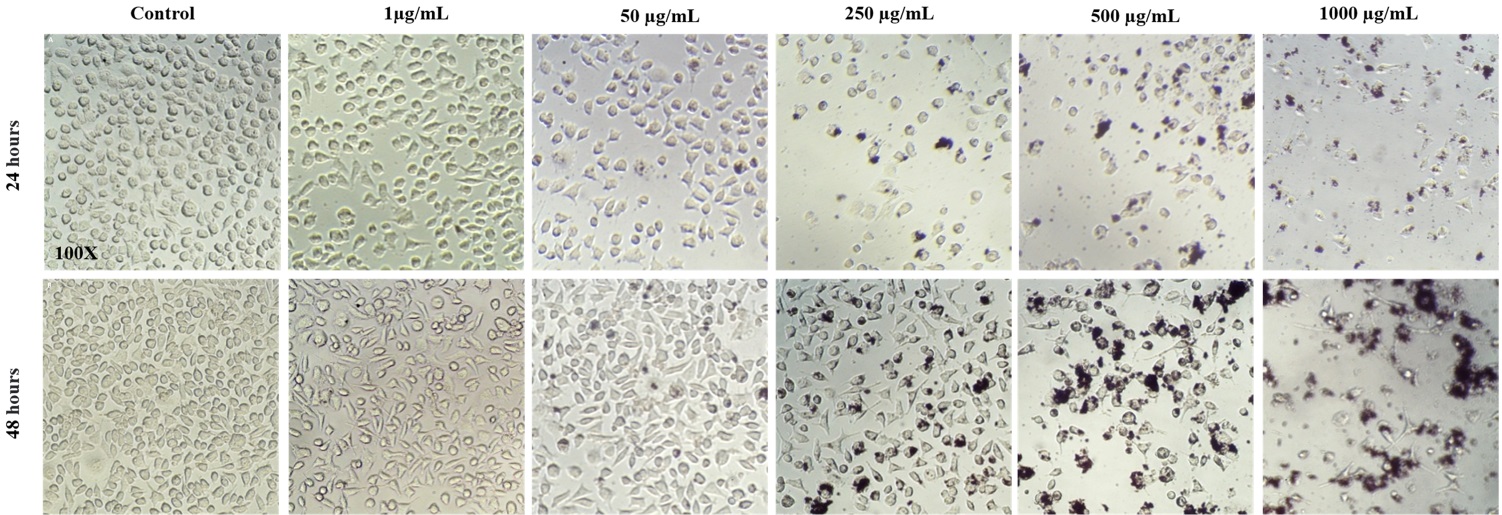
Fig. 3A shows the morphology of the fibroblasts LA-9 after exposure to NP CB-EDA in the groups control, 1, 50, 250, 500 and 1000 µg / ml. It is possible to observe in the images a decrease in the size and in the number of the cells in 24 hours as in 48 hours in the groups treated with 250ug / mL, 500ug / mL and 1000 µg / ml, when compared to the control group. (Fig. 3A).
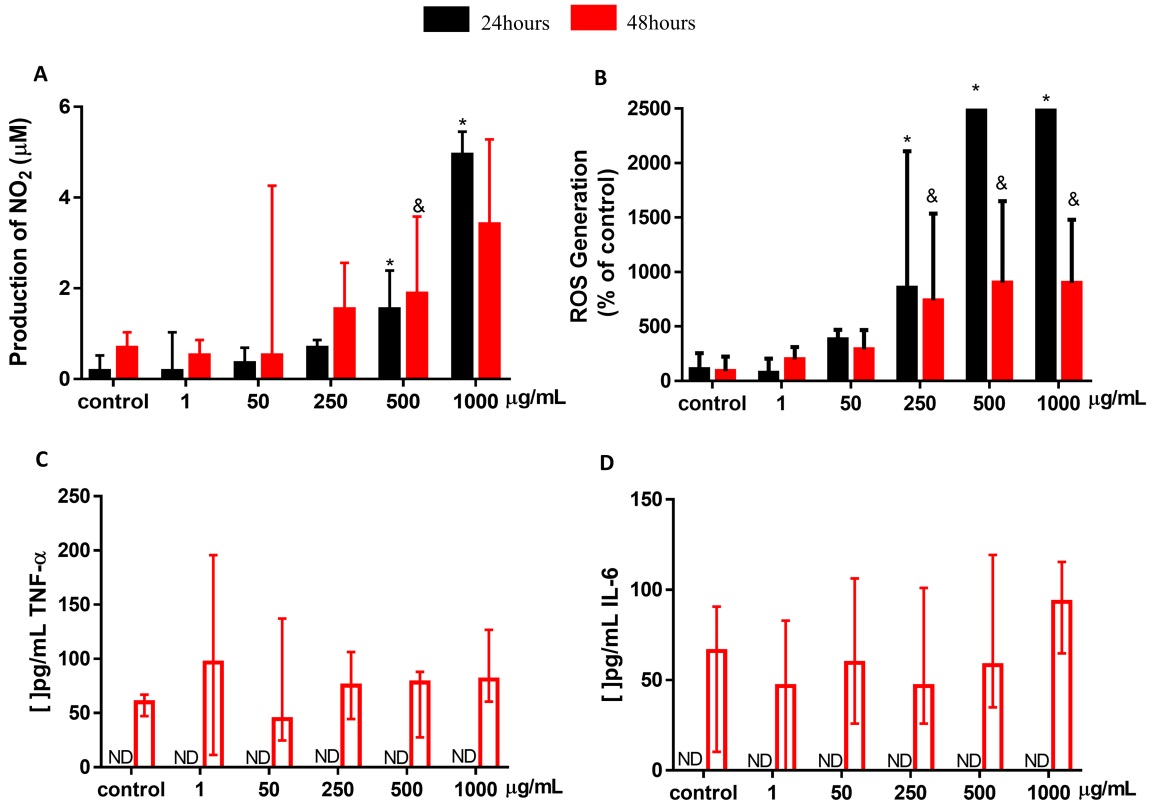
Fig. 4A shows the production of NO detected by the Griss reaction after exposure of different concentrations of NP CB-EDA (1, 50, 250, 500 and 1000 µg/ml), with a significant difference in the period of 24 hours, when the cells were exposed to concentrations of 500 µg/ml and 1000 µg/ml; it was possible to observe an increase in the production of NO in both concentrations when compared to control. In the 48 hours period, there is a significant difference when the cells were exposed to concentrations of 500 µg/ml, where it was possible to observe an increase in the production of NO in both concentrations.
Fig. 4B shows the production of reactive oxygen species (ROS) in the control group and in the groups exposure to 1, 50, 250, 500 and 1000 µg/ml of NP CB -EDA, after 24 and 48 hours, assessed by fluorescence measurement using the DCF-DA probe. Significant difference in the increase in ROS was observed at concentrations of 250 µg/ml and 1000 µg/ml, when compared to the control, in the 24 hours exposure period. Regarding the evaluation of the 48 hours period, there is a significant difference in the concentrations of 250 µg/ml and
1000 µg/ml.
The expression of TNF-α and IL-6 cytokines is shown in Fig. 4C and D. No detection was found within 24 hours. In the 48 hours exposure period, despite the expression of TNF-α being present in all evaluated groups, no statistically significant difference was found comparing with the control.
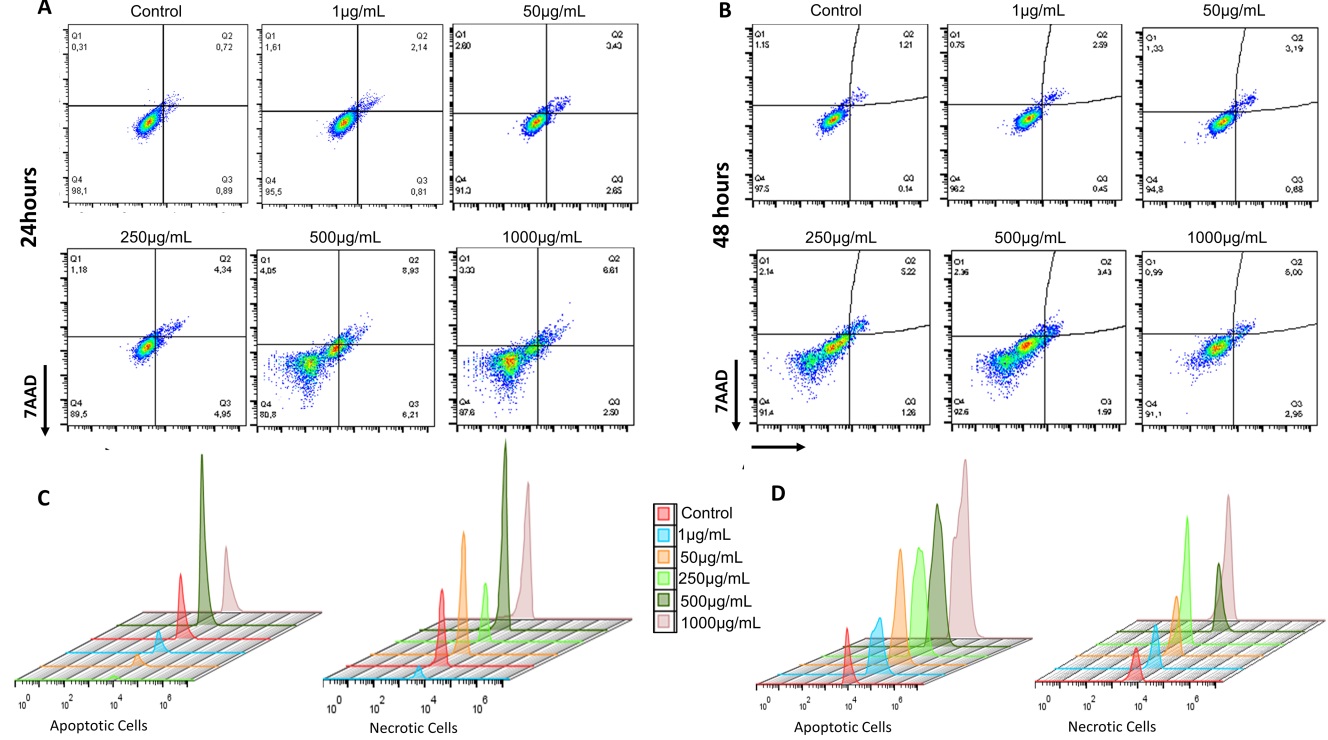
Cell death by apoptosis/necrosis was illustrated using the Dot Plot graph after 24 hours (Fig. 5A) and 48 hours (Fig. 5B), in the control group and the groups exposed to 1, 50, 250, 500 and 1000 µg/ml of NP CB -EDA in fibroblasts LA9. Each marker is exprssed by % fluorescence. The marker 7AAD in the X axis, represents necrosis, and PE Annexin V in the y axis, represents apoptosis.
The Dot Plot graph is represented by the upper left quadrant (Q1), in which are the cells marked with 7AAD and in a state of necrosis. In the lower right quadrant (Q3) are the cells marked with Annexin V (PE) and in an initial apoptosis state. In the upper right quadrant (Q2) are the double positive cells, that are marked with both PE and 7AAD, showing late apoptosis. Living cells are represented in the lower left quadrant (Q4). Fig. 5C and D shows the fluorescence emission peaks of the Anexin PE and 7AAD markers, representing apoptosis and necrosis in fibroblasts LA-9, after 24 and 48 hours of exposure to NP CB-EDA. Each emission peak represents a group differentiated by color.
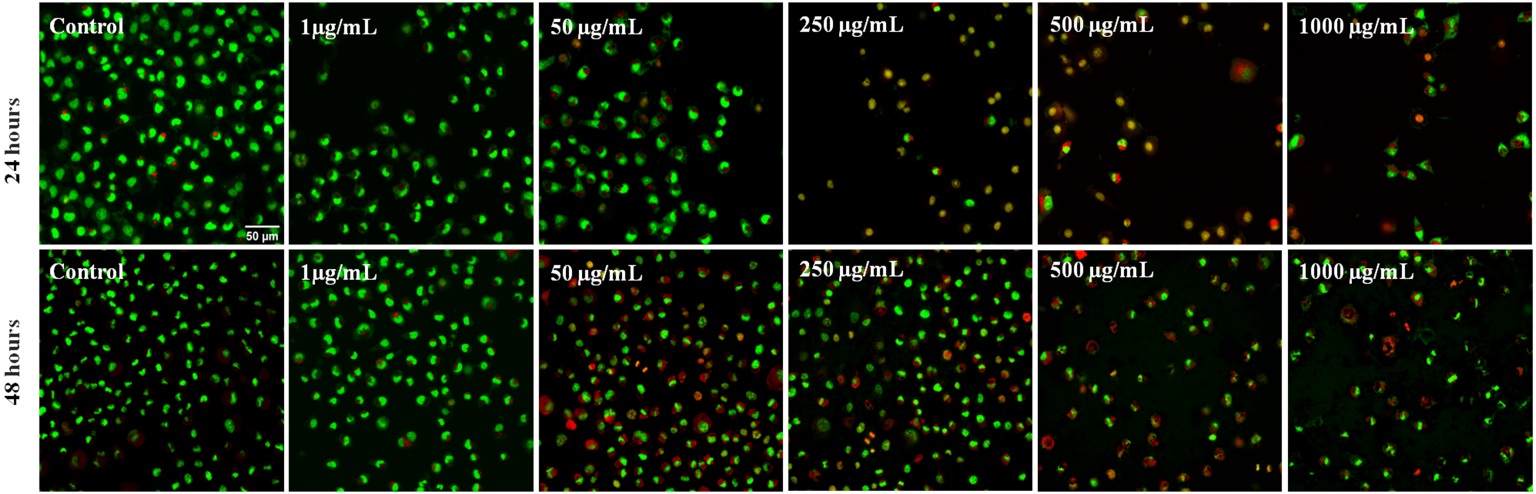
Fig. 6A shows high resolution epifluorescent microscopy images of fibroblasts LA-9, after 24 and 48 hours of exposure to different concentrations 1, 50, 250, 500 and 1000 µL/mL of NP CB-EDA, and stained with acridine orange, which marks living and dead cells and emits green, and with propidium iodide that marks dead cells, in which the reddish cytoplasm indicates initial apoptosis, and the reddish nucleus indicates late apoptosis and necrosis. The overlapping of images shows that the groups control, 1 ug/mL and 50 µg/mL in 24 hours, and control in 48 hours do not present cellular damage, with preserved morphology, green color and high number of cells. The other groups have altered morphology, decreased number of orange cells and nucleus showing late apoptosis and necrosis, both in 24 and 48 hours.
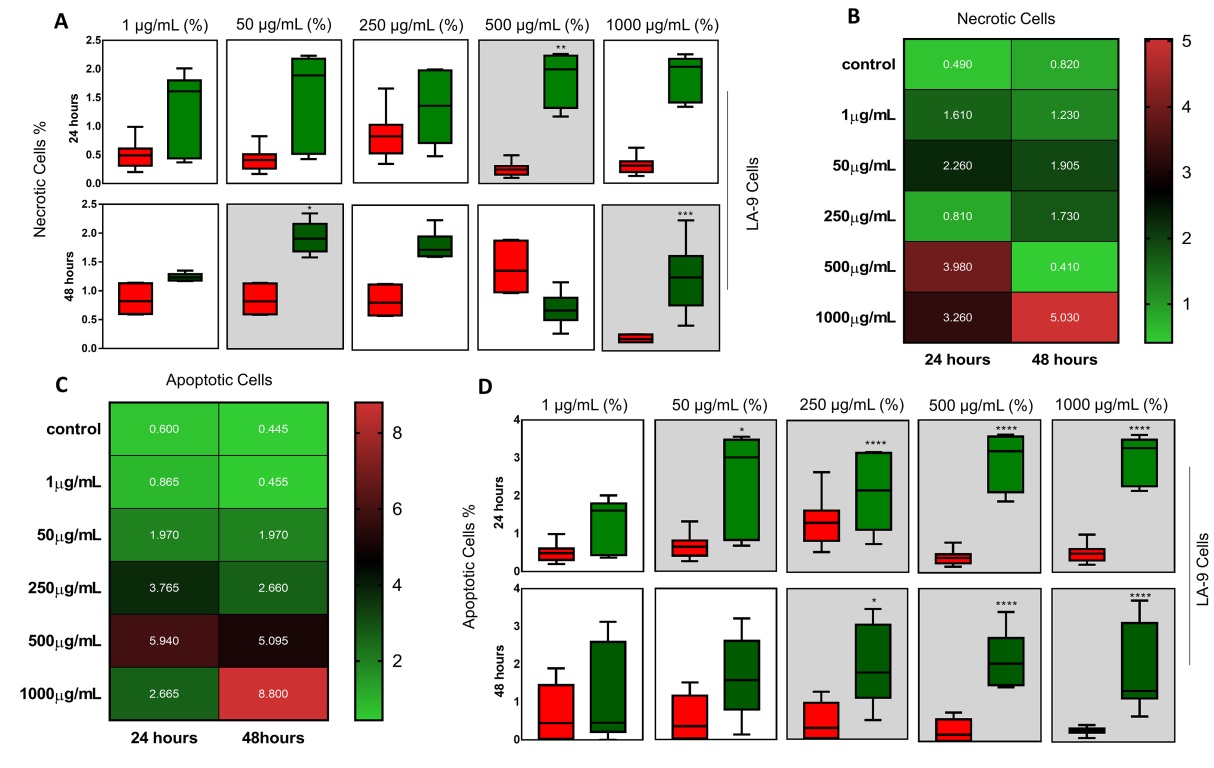
Fig. 7A and D shows the % of each apoptosis/necrosis marker after 24 and 48 hours of exposure to NP CB-EDA, according to each concentration analyzed. The necrotic cells are represented in Fig. 5A, in which, within 24 hours, showed a significant increase in cell % in the group exposed to 500 µg/ml, when compared with the control group. After 48 hours, there was a significant increase in the % of cells exposed to 50 and 1000 µg/ml.
Apoptotic cells are represented in Fig. 7D. After 24 hours, there was a significant increase in the % of apoptotic cells in the groups exposed to 50, 250, 500 and 1000 µg/ml of NP CB-EDA, when compared to the control group. In 48 hours, there was a significant increase in the % of apoptotic cells in the groups exposed to 250, 500 and 1000 µg/ml of NP CB-EDA.
Fig. 7B and C show the heatmap graph with the comparison between the average number of cells. Fig. 7B shows the comparison between necrotic cells between the 24 and 48 hours. Fig. 7C represents the comparison of apoptotic cells between the periods of 24 and 48 hours. Such comparisons make it possible to understand which group has more apoptotic/necrotic cells, where the green color represents the minimum and the red color the maximum value obtained. Representative scheme of the results can be found in the Supplementary Fig. 2.
It is worth mentioning that, when exposed to 1000 µg/ml concentration of NP CB-EDA, the macrophages produced a greater amount of IL-6. This fact can be important since IL-6 is considered as a fundamental mediator in several stages of inflammation [27]. Secreted by fibroblasts, their concentration levels may be related to the acute phase suggesting an inflammatory response and toxic potential for cells [28]. IL-6 can induce the oxidative stress pathway of ROS/RNS through the generation of active oxygen metabolites, produced after stimulation with TNF-α, triggering the entire process of cell apoptosis [8].
The immune response may have been triggered from the release of LDH from cells exposed to NP CB-EDA, which means that its causes cell damage due to toxicity. This can be explained by the number of electrons that are relocated on the surface of the nanoparticle carbon nanotubes (CNTs). Fewer defects in CNTs result in many electrons being relocated which can generate hydrophobicity causing damage to lipid membranes [25]. In our study, LDH was released in fibroblasts LA-9 in both 24 and 48 hours when exposed to NP CB-EDA in the highest concentrations of 500 and 1000 µg/ml.
The correlation of the data begins with MTT assays suggesting a decrease in cell viability in the tested times of 24 and 48 hours in fibroblasts LA-9 fibroblast. The MTT assay data showed that in the two times observed (24 and 48 hours) the NP CB-EDA significantly inhibited the viability of the cells exposure to250 µg/ml, 500 µg/ml and 1000 µg/ml. The studies by [26, 30], with A549 and 3T3 cells, showed that with exposure to carbon black (CB) for 24 hours, there was a reduction in cell viability in the highest concentrations when compared to the control group. The results of [29], reported that in longer exposure times to CB there was a reduction in A549 cell viability by up to 40% in a dose-dependent response; these data corroborate our findings, to confirm the cytotoxicity observed by the MTT method [30].
Our results showed a reduction in cell viability at the two periods analyzed, at concentrations of 250 µg/ml and 1000 µg/ml of NP CB-EDA. There were observed reductions in the number of colonies and in the quantification obtained [31]. Therefore, it is possible to perceive that the highest concentrations of NP CB-EDA, when in contact with fibroblasts LA-9, seem to induce the oxidative stress pathway such as ROS and RNS, leading to an inflammatory response of IL-6 and TNF-α and affecting integrity cell membrane, causing decreased in cell viability, and apoptosis/necrosis, showing a possible cytotoxic effect.
Conclusion
The results presented here show a cytotoxic potential of NP CB-EDA in murine fibroblasts LA-9, being dependent on the concentration. In general, there was a reduction in cell viability, damage to the cell membrane, a decrease in proliferative capacity, an increase in reactive oxygen and nitrogen species, an inflammatory profile leading to an increase in apoptotic cells in the exposure periods of 24 and 48 hours. These analyzes are extremely important, as this nanoparticle was synthesized for use in industry, which makes it able to circulate in the environment and in contact with organisms, it can cause irreparable damages.
The authors would like to thank Dra. Márcia Regina Cominetti (Department of Gerontology, Federal University of São Carlos – UFSCar. This work was supported by PETROBRAS /Project: Proc. No 2017/00010-7.
Author Contributions
Development of the study: J, K, B, P.
Study design: CS, F.
Data analysis: J, K, P, C, M.
Preparation of the article: J, K B, P, C, M.
Contribution of equipment and analysis: E, M.
Funding
This study was supported by PETROBRAS/Project: Proc. No 2017/00010-7.
Statement of Ethics
The authors have no conflicts of interest to declare.
The authors have no conflicts of interest to declare.
| 1 Khodabakhshi S, Fulvio PF, Andreoli E: Carbon black reborn: Structure and chemistry for renewable energy harnessing. Carbon 2020;162:604-649. https://doi.org/10.1016/j.carbon.2020.02.058 |
||||
| 2 Lima MCFS, Zaida do Amparo S, Ribeiro H, Soares AL, Viana MM, Seara LM, Paniago RM, Silva GG, Caliman V: Aqueous suspensions of carbon black with ethylenediamine and polyacrylamide-modified surfaces: Applications for chemically enhanced oil recovery. Carbon 2016;109:290-299. https://doi.org/10.1016/j.carbon.2016.08.021 |
||||
| 3 Lindner K, Ströbele M, Schlick S, Webering S, Jenckel A, Kopf J, Danov O, Sewald K, Buj C, Creutzenberg O, Tillmann T, Pohlmann G, Ernst H, Ziemann C, Hüttmann G, Heine H, Bockhorn H, Hansen T, König P, Fehrenbach H: Biological effects of carbon black nanoparticles are changed by surface coating with polycyclic aromatic hydrocarbons. Part Fibre Toxicol 2017;14:1-17. https://doi.org/10.1186/s12989-017-0189-1 |
||||
| 4 Boland S, Hussain S, Baeza-Squiban A: Carbon black and titanium dioxide nanoparticles induce distinct molecular mechanisms of toxicity. Wiley Interdiscip Rev Nanomed Nanobiotechnol 2014;6:641-652. https://doi.org/10.1002/wnan.1302 |
||||
| 5 Du J, Wang S, You H, Zhao X: Understanding the toxicity of carbon nanotubes in the environment is crucial to the control of nanomaterials in producing and processing and the assessment of health risk for human: A review. Environ Toxicol Pharmacol 2013;36:451-462. https://doi.org/10.1016/j.etap.2013.05.007 |
||||
| 6 Kinaret PAS, Scala G, Federico A, Sund J, Greco D: Carbon Nanomaterials Promote M1/M2 Macrophage Activation. Small 2020;16:e1907609. https://doi.org/10.1002/smll.201907609 |
||||
| 7 Basuroy S, Tcheranova D, Bhattacharya S, Leffler CW, Parfenova H: Nox4 NADPH oxidase-derived reactive oxygen species, via endogenous carbon monoxide, promote survival of brain endothelial cells during TNF-α-induced apoptosis. Am J Physiol Cell Physiol 2011;300:C256-C265. https://doi.org/10.1152/ajpcell.00272.2010 |
||||
| 8 Nermin Özcan , Ceren Karaman , Necip Atar , Onur Karaman MLY: A Novel Molecularly Imprinting Biosensor Including Graphene Quantum Dots/Multi-Walled Carbon Nanotubes Composite for Interleukin-6 Detection and Electrochemical Biosensor Validation. ECS J Solid State Sci Technol 2020;9:121010. https://doi.org/10.1149/2162-8777/abd149 |
||||
| 9 Kaur S, Bansal Y, Kumar R, Bansal G: A panoramic review of IL-6: Structure, pathophysiological roles and inhibitors. Bioorg Med Chem 2020;28:115327. https://doi.org/10.1016/j.bmc.2020.115327 |
||||
| 10 Deweirdt J, Quignard JF, Lacomme S, Gontier E, Mornet S, Savineau JP, Marthan R, Guibert C, Baudrimont I: In vitro study of carbon black nanoparticles on human pulmonary artery endothelial cells: effects on calcium signaling and mitochondrial alterations. Arch Toxicol 2020;94:2331-2348. https://doi.org/10.1007/s00204-020-02764-9 |
||||
| 11 Li Y, Yang M, Meng T, Niu Y, Dai Y, Zhang L, Zheng X, Jalava P, Dong G, Gao W, Zheng Y: Oxidative stress induced by ultrafine carbon black particles can elicit apoptosis in vivo and vitro. Sci Total Environ 2020;709:135802. https://doi.org/10.1016/j.scitotenv.2019.135802 |
||||
| 12 Niranjan R, Thakur AK: The toxicological mechanisms of environmental soot (black carbon) and carbon black: Focus on Oxidative stress and inflammatory pathways. Front Immunol 2017;8:1-20. https://doi.org/10.3389/fimmu.2017.00763 |
||||
| 13 Samak DH, El-Sayed YS, Shaheen HM, El-Far AH, Onoda A, Abdel-Daim MM, Umezawa M: In-ovo exposed carbon black nanoparticles altered mRNA gene transcripts of antioxidants, proinflammatory and apoptotic pathways in the brain of chicken embryos. Chem Biol Interact 2018;295:133-139. https://doi.org/10.1016/j.cbi.2018.02.031 |
||||
| 14 Saltzman BE: Colorimetric microdetermination of NO2 in the atmosphere. Anal Chem 1963;20:1949-1954. https://doi.org/10.1021/ac60096a025 |
||||
| 15 Green LC, Wagner DA, Glogowski J, Skipper PL, Wishnok JS, Tannenbaum SR: Analysis of nitrate, nitrite, and [15N]nitrate in biological fluids. Anal Biochem 1982;126:131-138. https://doi.org/10.1016/0003-2697(82)90118-X |
||||
| 16 Wan CP, Myung E, Lau BHS: An automated micro-fluorometric assay for monitoring oxidative burst activity of phagocytes. Journal of Immunological Methods 1993;159:131-138. https://doi.org/10.1016/0022-1759(93)90150-6 |
||||
| 17 Franken NAP, Rodermong HM, Stap J, Havemann J, van Bree C: Clonogenic assay of cells in vitro. Nat Protoc 2006;1:2315-2319. https://doi.org/10.1038/nprot.2006.339 |
||||
| 18 Schindelin J, Arganda-Carreras I, Frise E, Kaynig V, Longair M, Pietzsch T, Preibisch S, Rueden C, Saalfeld S, Schmid B, Tinevez JY, White DJ, Hartenstein V, Eliceiri K, Tomancak P, Cardona A: Fiji: An open-source platform for biological-image analysis. Nat Methods 2012;9:676-682. https://doi.org/10.1038/nmeth.2019 |
||||
| 19 Cai X, Ramalingam R, Wong HS, Cheng J, Ajuh P, Cheng SH, Lam YW: Characterization of carbon nanotube protein corona by using quantitative proteomics. Nanomedicine 2013;9:583-593. https://doi.org/10.1016/j.nano.2012.09.004 |
||||
| 20 Hussain S, Boland S, Baeza-Squiban A, Hamel R, Thomassen LCJ, Martens JA, Billon-Galland MA, Fleury-Feith J, Moisan F, Pairon JC, Marano F: Oxidative stress and proinflammatory effects of carbon black and titanium dioxide nanoparticles: Role of particle surface area and internalized amount. Toxicology 2009;260:142-149. https://doi.org/10.1016/j.tox.2009.04.001 |
||||
| 21 Phenrat T, Saleh N, Sirk K, Tilton RD, Lowry GV: Aggregation and sedimentation of aqueous nanoscale zerovalent iron dispersions. Environ Sci Technol 2007;41:284-290. https://doi.org/10.1021/es061349a |
||||
| 22 Elmore S: Apoptosis: A Review of Programmed Cell Death. Toxicol Pathol 2007;35:495-516. https://doi.org/10.1080/01926230701320337 |
||||
| 23 Bartsch H, Nair J: New DNA-based biomarkers for oxidative stress and cancer chemoprevention studies. Eur J Cancer 2000;36:1229-1234. https://doi.org/10.1016/S0959-8049(00)00095-2 |
||||
| 24 Chen B, Liu Y, Song WM, Hayashi Y, Ding XC, Li WH: In vitro evaluation of cytotoxicity and oxidative stress induced by multiwalled carbon nanotubes in murine RAW 264.7 macrophages and human A549 Lung cells. Biomed Environ Sci 2011;24:593-601. | ||||
| 25 Hoshino K, Kashiwamura SI, Kuribayashi K, Kodama T, Tsujimura T, Nakanishi K, Matsuyama T, Takeda K, Akira S: The absence of interleukin I receptor-related T1/ST2 does not affect T helper cell type 2 development and its effector function. J Exp Med 1999;190:1541-1547. https://doi.org/10.1084/jem.190.10.1541 |
||||
| 26 Usman M, Zaheer Y, Younis MR, Demirdogen RE, Hussain SZ, Sarwar Y, et al.: The effect of surface charge on cellular uptake and inflammatory behavior of carbon dots. Colloids Interface Sci Commun 2020;35:100243. https://doi.org/10.1016/j.colcom.2020.100243 |
||||
| 27 Gallucci RM, Simeonova PP, Matheson JM, Kommineni C, Guriel JL, Sugawara T, Luster MI: Impaired cutaneous wound healing in interleukin‐6‐deficient and immunosuppressed mice. FASEB J 2000;14:2525-2531. https://doi.org/10.1096/fj.00-0073com |
||||
| 28 Garcia JBS, Issy AM, Sakata RK: Cytokines and anesthesia. Braz J Anesthesiol 2002;52:86-100. https://doi.org/10.1590/S0034-70942002000100011 |
||||
| 29 Stone V, Shaw J, Brown DM, Macnee W, Faux SP, Donaldson K: The role of oxidative stress in the prolonged inhibitory effect of ultrafine carbon black on epithelial cell function. Toxicol In Vitro 1998;12:649-659. https://doi.org/10.1016/S0887-2333(98)00050-2 |
||||
| 30 Gellein K, Hoel S, Evje L, Syversen T: The colony formation assay as an indicator of carbon nanotube toxicity examined in three cell lines. Nanotoxicology 2009;3:215-221. https://doi.org/10.1080/17435390902906811 |
||||
| 31 Louro H, Pinhão M, Santos J, Tavares A, Vital N, Silva MJ: Evaluation of the cytotoxic and genotoxic effects of benchmark multi-walled carbon nanotubes in relation to their physicochemical properties. Toxicol Lett 2016;262:123-134. https://doi.org/10.1016/j.toxlet.2016.09.016 |
||||