×
![]()
Corresponding Author: Gary W. Lawrence
International Centre for Neurotherapeutics,
Dublin City University, Dublin 9 (Ireland)
Tel. +35317007689, E-Mail gary.lawrence@dcu.ie
Population Coding of Capsaicin Concentration by Sensory Neurons Revealed Using Ca2+ Imaging of Dorsal Root Ganglia Explants from Adult pirt-GCaMP3 Mouse
Gary W. Lawrencea Tomas H. Zurawskia Xinzhong Dongb J. Oliver Dollya
aInternational Centre for Neurotherapeutics, Dublin City University, Glasnevin, Dublin, Ireland, bHoward Hughes Medical Institute, Johns Hopkins University School of Medicine, Baltimore, MD, USA
Introduction
Pain poses a major challenge to modern medicine, with the prevalence of chronic pain (all forms) estimated to be near 50% of the population and up to 14% of sufferers being severely disabled [1]. It arises from activation of nociceptors, a subset of the peripheral afferent sensory neurons in dorsal root ganglia (DRG) and trigeminal ganglia, that sense potentially-damaging environmental conditions via membrane proteins capable of detecting noxious chemicals, heat or mechanical force (reviewed by [2, 3]). Current models posit that fibres projected from different sensory neurons (and ganglia) distribute into complex arrangements in overlapping receptive fields, such that peripheral tissues are supplied with fibres having various activation thresholds, some with a wide dynamic range of response intensity [4]. Innocuous stimuli excite only the most sensitive fibres, but increasingly noxious insults recruit more and more neurons with progressively intensifying signals [4, 5]. However, the molecular details of these processes remain unclear.
The best characterised nociceptive receptor is the transient receptor potential vanilloid type 1 (TRPV1), identified as a non-selective cation channel activated by capsaicin (CAPS; the active ingredient of chilli peppers), that acts as a polymodal integrator of noxious chemicals, protons and heat [6, 7]. Its excitation by CAPS in vivo elicits a burning pain sensation accompanied by local vasodilation and inflammation [8]; this is followed by hypersensitivity to heat and touch. Mice genetically modified to ‘knock-out’ expression of TRPV1 exhibit little of the pain behaviour evoked by CAPS in the wild-type, show depressed responses to noxious heat and a near-complete loss of inflammation-induced thermal hyperalgesia [9, 10]. TRPV1 is found predominantly on unmyelinated, slowly-conducting C-fibres that express calcitonin gene-related peptide (CGRP), substance P and neurokinin A [7]. CAPS and other particular noxious stimuli open the non-selective cation pore in TRPV1, allowing entry of Ca2+ and Na+. The resulting depolarisation is sensed and amplified by voltage-gated Na+ channels, thereby, initiating action potentials that propagate pain signals to the dorsal horn of the spinal cord (or brainstem in the case of craniofacial nerves); there, they are passed to ascending spinal/brainstem neurons that carry the information to the brain. The Ca2+ that enters through TRPV1 acts locally as a second messenger to stimulate various intra-neuronal signalling cascades via Ca2+-activated phospholipases, protein kinases and phosphatases [3, 11, 12]. It also triggers the fusion of neuropeptide-loaded large dense-core vesicles as well as the exocytosis of other excitatory mediators. For example, released CGRP and substance P act directly on endothelial and smooth muscle cells, causing the aforementioned vasodilation and neurogenic inflammation that results from exposure to CAPS. Mediators released from sensory neurons also attract and activate immune cells at sites of nerve insult or damage [13]. Injured tissues and immune cells release cytokines and other pro-inflammatory factors such as kinins, ATP and growth factors. They interact directly with receptors on sensory neurons resulting in the hyper-sensitisation of nociceptors to environmental cues. Such pro-inflammatory factors sensitise nociceptors by modifying the activity of plasmalemmal ion channels so that the fibres become more easily excited. Many of the signalling cascades they activate converge on nociceptive receptors such as TRPV1 and the structurally-related reactive chemical receptor and thermal sensor, transient receptor potential ankyrin 1 (TRPA1) [7, 12, 14, 15].
Due to the aforementioned huge numbers of pain sufferers, and present treatments being often ineffective, poorly tolerated or addictive, there is a pressing need for the development of new effective, non-addictive analgesics free from unpleasant side-effects. TRPV1 is considered a prime target for analgesic therapeutics because of being a multi-modal integrator of noxious insult, implicated in inflammatory and neuropathic pain. As assessment of TRPV1 antagonists by electrophysiological recordings or Ca2+ imaging has been hampered by its desensitisation and tachyphylaxis to agonists used such as CAPS [16-18], pirt-GCaMP3 mice and confocal imaging of intracellular Ca2+ concentration [Ca2+]i
were employed herein. These animals, which express the Ca2+ sensor in virtually all their primary sensory neurons but not other cells of DRG and trigeminal ganglia [19], facilitated measurements of changes in [Ca2+]i in large populations of DRGNs when subjected to pertinent protocols for stimulation by CAPS (e.g. longer and repeated exposure to various concentrations). Notably, topical application of CAPS has been proven beneficial for chronic neuropathic pain e.g. associated with post-herpetic neuralgia and diabetic neuropathy [20, 21]. This has been attributed to transient desensitisation of TRPV1 and much more persistent, but ultimately reversible, denervation of TRPV1-expressing fibres [20, 21]. However, many of the mechanistic details have been deciphered from experiments using rodent cultured sensory neurons and very short exposures to CAPS. Thus, it is necessary to ascertain if the details of nociceptor signalling and desensitisation observed in cultured cells faithfully represent processes occurring in tissues, and in response to mimics of pain-inducing mediators. Hence, L3/L4 DRG explants with preserved structural integrity and somatic organisation were utilised in this study. Using analytical tools to deconstruct the complex, heterogeneous Ca2+ signals observed during and following 5 or, in some cases, 20 min. exposure to CAPS, patterns have been deciphered in the responses from large cohorts of neurons present in the DRG, shedding light on how primary nociceptors encode noxious stimulus intensity. Hitherto unappreciated complexity was revealed, and mechanisms uncovered for maintaining strong responses to CAPS in the neuronal population, despite profound tachyphylaxis and desensitisation (reduced responses to repeated and prolonged, respectively, agonist stimulation) in individual cells. The experimental system developed offers the major advantage of providing robust internally-controlled assays for TRPV1 activity by repeated stimulation before and after experimental treatments.
Materials and Methods
Materials
The pirt-GCaMP3 mice were generated by Prof. X. Dong (Johns Hopkins University School of Medicine, Baltimore, MD, USA). CAPS was purchased from Alomone Labs. (Jerusalem, Israel), and Liberase™ from Roche Diagnostics (Mannheim, Germany). All other chemicals were obtained from Merck (Arklow, Ireland).
Confocal imaging of DRG explants
Heterozygous adult (6-8 weeks) male or female pirt-GCaMP3 mice were euthanised by cervical dislocation and L3 or L4 DRG dissected, with a few mm of the ventral and dorsal roots plus peripheral nerve trunk attached. Ganglia were collected in ice-cold dissection buffer (mM: CaCl2, 0.5; glucose, 11; KCl, 2.5; MgSO4, 10; NaHCO3, 26; NaH2PO4, 1.2; sucrose, 216) constantly gassed with a mixture of 95 % oxygen: 5 % carbon dioxide (O2/CO2). Within 10 min. of dissection, the DRG were rinsed with artificial cerebrospinal fluid (aCSF; mM: CaCl2, 2; glucose, 11; KCl, 3.6; MgSO4, 1.2; NaCl, 117; NaHCO3, 25; NaH2PO4, 1.2) pre-gassed as above. The ganglion sheath was gently removed mechanically and with 5 min. digestion at room temperature by Liberase™ (13 units/ml in aCSF lacking the MgSO4) before placing the DRG under a tissue holder in a heated recording chamber (RC26GLP in PM1; Warner Instruments, Holliston, MA, USA; bath volume ~ 1ml) connected to a digital DC power supply (72-13310, Tenma Corp., Tokyo, Japan); washing ensued by superfusing at 2 ml/min. with normal aCSF containing 10 μg/ml bovine serum albumin and continuously gassed with O2/CO2 (aCSF-BOC) at ambient temperature (~ 22°C). After 30 min. the aCSF-BOC was warmed to 32°C using a heated perfusion tube (HPT-2, ALA Scientific Instruments, Westbury, NY, USA) with feedback control via a thermal probe linked to a thermal controller (S-PS-8*00 and LinLab2 software, Scientifica Ltd., Uckfield, UK). Washing was continued for another 30 min. before starting the recordings. All subsequent experimental procedures and washes were performed at 32°C superfusing with aCSF-BOC continuously.
Confocal imaging was performed using a Zeiss Axio Examiner Z1 upright microscope with a 488 nm laser, controlled by Zen 2008 (Carl Zeiss, Oberkochen, Germany), using a 10 x magnification water immersion objective (NA 1.336). Z-stacks were configured to image the majority of the volume of each ganglion;
10-12 non-overlapping Z-planes of 25–30 μm thickness. Each confocal plane was scanned once every 10-12 seconds, depending on stack size.
Image analysis
To identify regions of interest (ROIs) where detectable changes in the intensity of fluorescence occurred, time-lapse Z-stacks were projected to a single plane using Fiji (sum slices option; imagej.net [22]) and converted to grayscale (Supplementary Movie 1); for simplicity and consistency, ROIs of a uniform area were applied (Supplementary Movie 2) (for all supplementary material see www.cellphysiolbiochem.com). Occasionally, large diameter cells were seen to fluoresce in a slow cyclical manner that was obviously unrelated to DRG treatment protocols and these were not included as ROIs. Average pixel intensity was measured in ROIs (using ImageJ) for each confocal plane of the original, non-projected time lapse movies (Supplementary Movie 3), in segments of 20 min. (except initial baseline [10 min.]). For each 20 min. segment, ROI positions were adjusted for minor shifts in tissue position and orientation. The results were exported to Microsoft Excel® (Office 365, Microsoft Corporation, St Redmond, WA, USA) for further processing. In segments including experimental treatments (i.e. exposure to CAPS) the measurements made during the initial 1.6 min. of each recording, representing a period just before CAPS washed-in, were averaged to obtain base fluorescence values (F0) and standard deviation (s.d.). The intensity of emitted fluorescence (F) was measured for each ROI in all subsequent movie frames for each confocal plane and the change in intensity relative to base values calculated for every time point using the formula (F – F0)/F0. ROIs were considered to contain positive-responders if the averaged pixel intensity change, (F – F0)/F0, was greater than the base, F0, plus 10 x s.d. Only positive responders to each treatment were included in calculations of mean (F – F0)/F0 or summed (Σ) (F – F0)/F0. Where signals were detected for a single ROI in more than one confocal plane, measurements were processed as follows: 1. signals in adjacent planes with similar time courses for changes in fluorescence were assumed to have arisen from a single neuron and measured values from each plane were averaged, 2. signals in non-adjacent confocal planes always showed distinct time courses and so these were measured as separate individual neurons, 3. rarely, signals were detected in adjacent planes but with obviously different time courses, so these were also measured as separate individual signals. To estimate the fraction of excitable cells activated by 10 μM CAPS, in another set of experiments DRGs were exposed sequentially to the vanilloid and to 60 mM KCl (in modified aCSF with NaCl reduced to 60.6 mM to maintain osmolarity). Due to 60 mM KCl inducing Ca2+ signals in a large number of cells with a high degree of synchronicity, it was not possible to reliably segregate cells that span multiple confocal layers by the method detailed above. Thus, for both 10 μM CAPS and 60 mM KCl, all above threshold signals in every confocal layer were counted as individual responses and these numbers used to calculate the percentage of excitable cells also activated by 10 μM CAPS. Notably, very similar values were obtained for the latter if only the signals in every second confocal slice were used for the calculation; thus, the possible ‘double-counting’ of cells in adjacent confocal layers does not seem to have skewed this measurement. In Fig. 1 H and I, the ROIs identified as positive responders to CAPS, in the absence of capsazepine but presence of Ca2+, were used for the repeat measurements in the presence of capsazepine (Fig. 1H) or ethylene glycol-bis(β-aminoethyl ether)-N,N,N′,N′-tetraacetic acid (EGTA) without Ca2+ (Fig. 1I), with all measurements performed on flattened confocal stacks.
Performing measurements using the analysis toolbox
To simplify analysis of complex and heterogeneous fluorescent signals from individual DRG neurons (DRGNs), a toolbox for analysis of measurements was used (see Supplementary Fig. 1). Firstly, data sets were purged of all data points below the positive response threshold; all excluded points were assigned a nominal value of zero (except where explicitly stated that sub-threshold values were included). The transformed data sets were then subjected to peak analysis using GraphPad Prism 9 (GraphPad Software, San Diego, CA, USA) to identify when signals start and finish and reach the maximum increase in intensity (Supplementary Fig. 1A). The results were exported back to Microsoft Excel® to extract the following measurements: (1) Number of responders, a count of all the ROIs that exhibited at least one signal of [Ca2+]i above the threshold; (2) Lag, the time between test samples reaching the DRG recording chamber and the first [Ca2+]i signal above threshold. Note that all recordings started when the delivery line inlet was placed in the sample reservoir and all lag measurements were adjusted for the time sample spent in the delivery line; (3) Max., the maximum increase in (F-F0)/F0; (4) Duration, the period each signal remained above threshold (Supplementary Fig. 1A), calculated by subtracting the time point for the first [Ca2+]i signal above threshold from that for the last [Ca2+]i signal above threshold; (5) Number of events, a count of the discrete peaks in cases where [Ca2+]i was observed to fluctuate above and below threshold multiple times (e.g. Supplementary Fig. 1B). In such instances, the duration and Max. intensity ratio of each individual peak was determined, and (6) Σ Duration, the sum of durations measured for each individual peak, added together in cases where more than one peak was observed (see Supplementary Fig. 1B). Mean ± s.e.m. values for each of these measurements, except the number of responders, were determined by averaging the values from all ROIs that reached the responder criterion. Note that for cells displaying multiple signals, only the largest Max. intensity ratios were included in the calculations, but for duration an average was determined for each individual cell and these were used to derive the mean for the population. Statistical tests were performed in Microsoft Excel®. All data were plotted using GraphPad Prism 9.
Results
CAPS induces concentration-dependent increases in fluorescence signals that require extracellular Ca2+ and are blocked by capsazepine
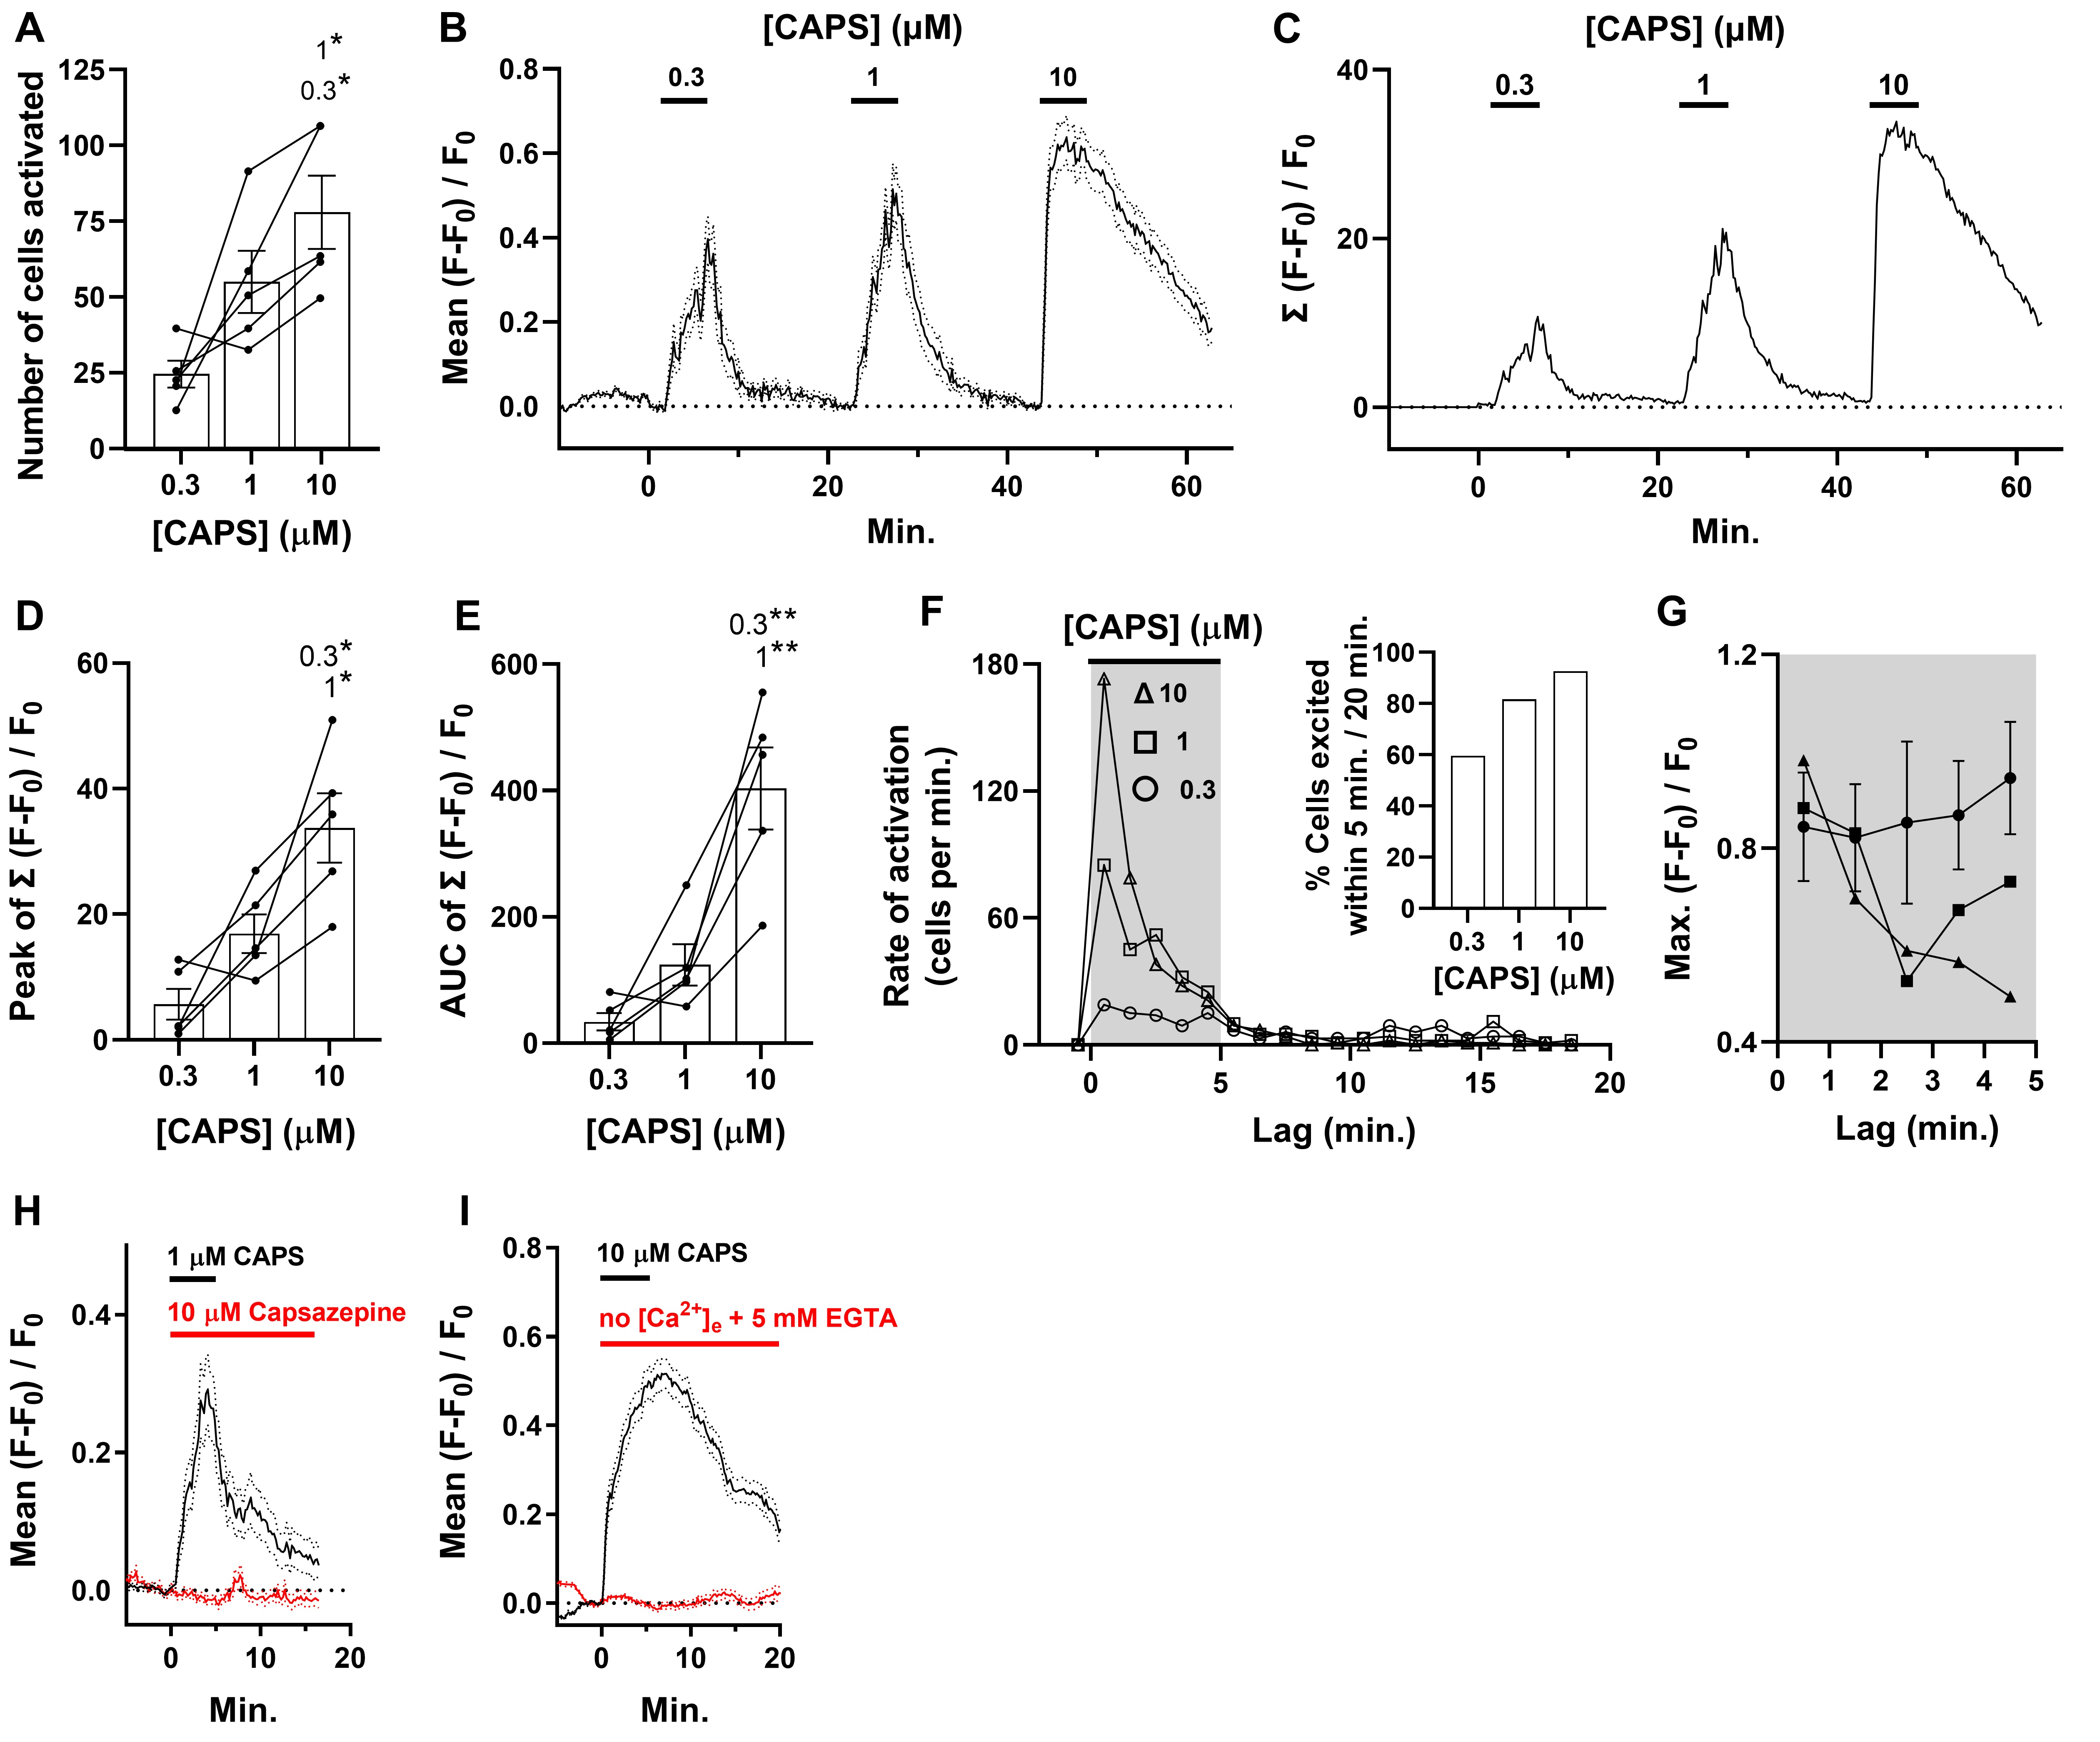
DRG explants were exposed sequentially to increasing CAPS concentration ([CAPS]) for 5 min. periods with 15 min. intervals of washing whilst monitoring fluorescence in neurons throughout (Supplementary Movie 1). Cells were scored as responders if the increased fluorescence (F) exceeded F0 plus 10 times the s.d. in signals, measured over 1.6 min. immediately prior to the stimulation. By this criterion, the lowest [CAPS] tested, 0.3 μM, excited a total of 123 neurons in 4 recordings, from a total of 5 individual DRG. A larger number (275) were stimulated by 1 μM and yet more (390) with 10 μM CAPS. The mean number of neurons excited per DRG by 1 μM CAPS was significantly larger than by 0.3 μM and the amount activated by 10 μM significantly greater again (Fig. 1A and Supplementary Movie 1). The mean fluorescence change, as a fraction of initial intensity (F – F0)/F0 plotted against time for a representative experiment in Fig. 1B, shows that [Ca2+]i increased in DRGNs within seconds of exposing DRGs to 0.3 μM CAPS and the average response continued to rise steadily during the indicated exposure period, only declining during washout. On the other hand, exposure to 1 μM yielded a higher peak, and an even greater level was achieved more rapidly with 10 μM CAPS. Although fluorescence declined for all [CAPS] when washout commenced, the times taken for mean intensity to drop were longer for 1 and, especially, 10 μM CAPS (Fig. 1B). As raising [CAPS] caused large increases in the number of DRGNs excited, a more meaningful representation of the Ca2+ signals over time is obtained by summing their intensities (Fig. 1C), rather than the mean values plotted in Fig. 1B, because this embodies the cumulative response of a cell population. Notably, augmenting [CAPS] resulted in progressive increases in the peak (Fig. 1D) and area under the curve (AUC) of Σ(F – F0)/F0 plotted against time (a measure of accumulated fluorescence intensity in the neuronal population, also referred to as signal density; Fig. 1C, E), illustrating how DRGNs may encode [CAPS] by the magnitude of cumulative signal across their population. In other experiments, DRGs were exposed sequentially to 10 μM CAPS for 5 min. and 60 mM KCl. It was determined that 24 ± 6 % of the viable excitable cells were activated by the vanilloid (n=3).
Raising [CAPS] accelerates signals with relatively high Max. and long duration
The rate of neuron excitation peaked within minutes of exposing DRG to CAPS, irrespective of the concentration, but 10 μM caused the fastest initial rate with a rapid decline even in the continued presence of the vanilloid (Fig. 1F). Cell excitation by 1 μM CAPS peaked at approximately half the initial rate of that triggered by 10 μM, whilst 0.3 μM evoked the slowest excitation. However, there was only a relatively minor decrease in excitation rate for 0.3 μM CAPS over the following minutes whereas an intermediate decline was observed for 1 μM (Fig. 1F). Indeed, after washout of 0.3 and 1 μM CAPS had commenced, DRGNs still continued to be excited for the first time for over 10 min. whereas the rate depreciated to a negligible level within 5 mins. after washout of 10 μM CAPS. Consequently, of all the DRGNs excited by 0.3 μM CAPS during the whole 20 min. recording period only just under 60 % began signalling during the 5 min. the vanilloid was present, rising to 82 % and 93 % for 1 and 10 μM, respectively (Fig. 1F, inset). Thus, increasing [CAPS] not only excited more cells but also accelerated their activation. Furthermore, it selectively hastened the recruitment of DRGNs that yielded relatively high fluorescence intensity (Fig. 1G), which underlies the rapid rise to a high peak of summed fluorescence noted above (Fig. 1C). Although the faster activation of DRGNs by 10 μM CAPS could reflect more rapid penetration of the vanilloid into the DRG at high concentration, the observation that excitation rates peaked well before washout commenced, even for 0.3 μM CAPS, suggests that it readily permeated the tissue. Furthermore, no association was found between the depth of neurons within the DRG and any parameter of the [Ca2+]i signals, in stark contrast to strong associations with [CAPS] (Supplementary Fig. 2). With regard to the specificity of the agonist, it is noteworthy that responses to 1 (Fig. 1H) and 10 μM CAPS (data not shown) were prevented by the inclusion of a 10-fold molar excess of the CAPS receptor antagonist, capsazepine, or by the omission of Ca2+ from the bathing solution with EGTA added to chelate any extracellular traces of the cation (Fig. 1I). The most parsimonious interpretation is that CAPS provokes the entry of extracellular Ca2+ into DRGNs that express TRPV1 on their surface membrane.
Characterisation of [Ca2+]i changes in individual DRGNs reveals strong [CAPS]-dependent associations with signal lag time and duration, but not Max. increases in fluorescence intensity
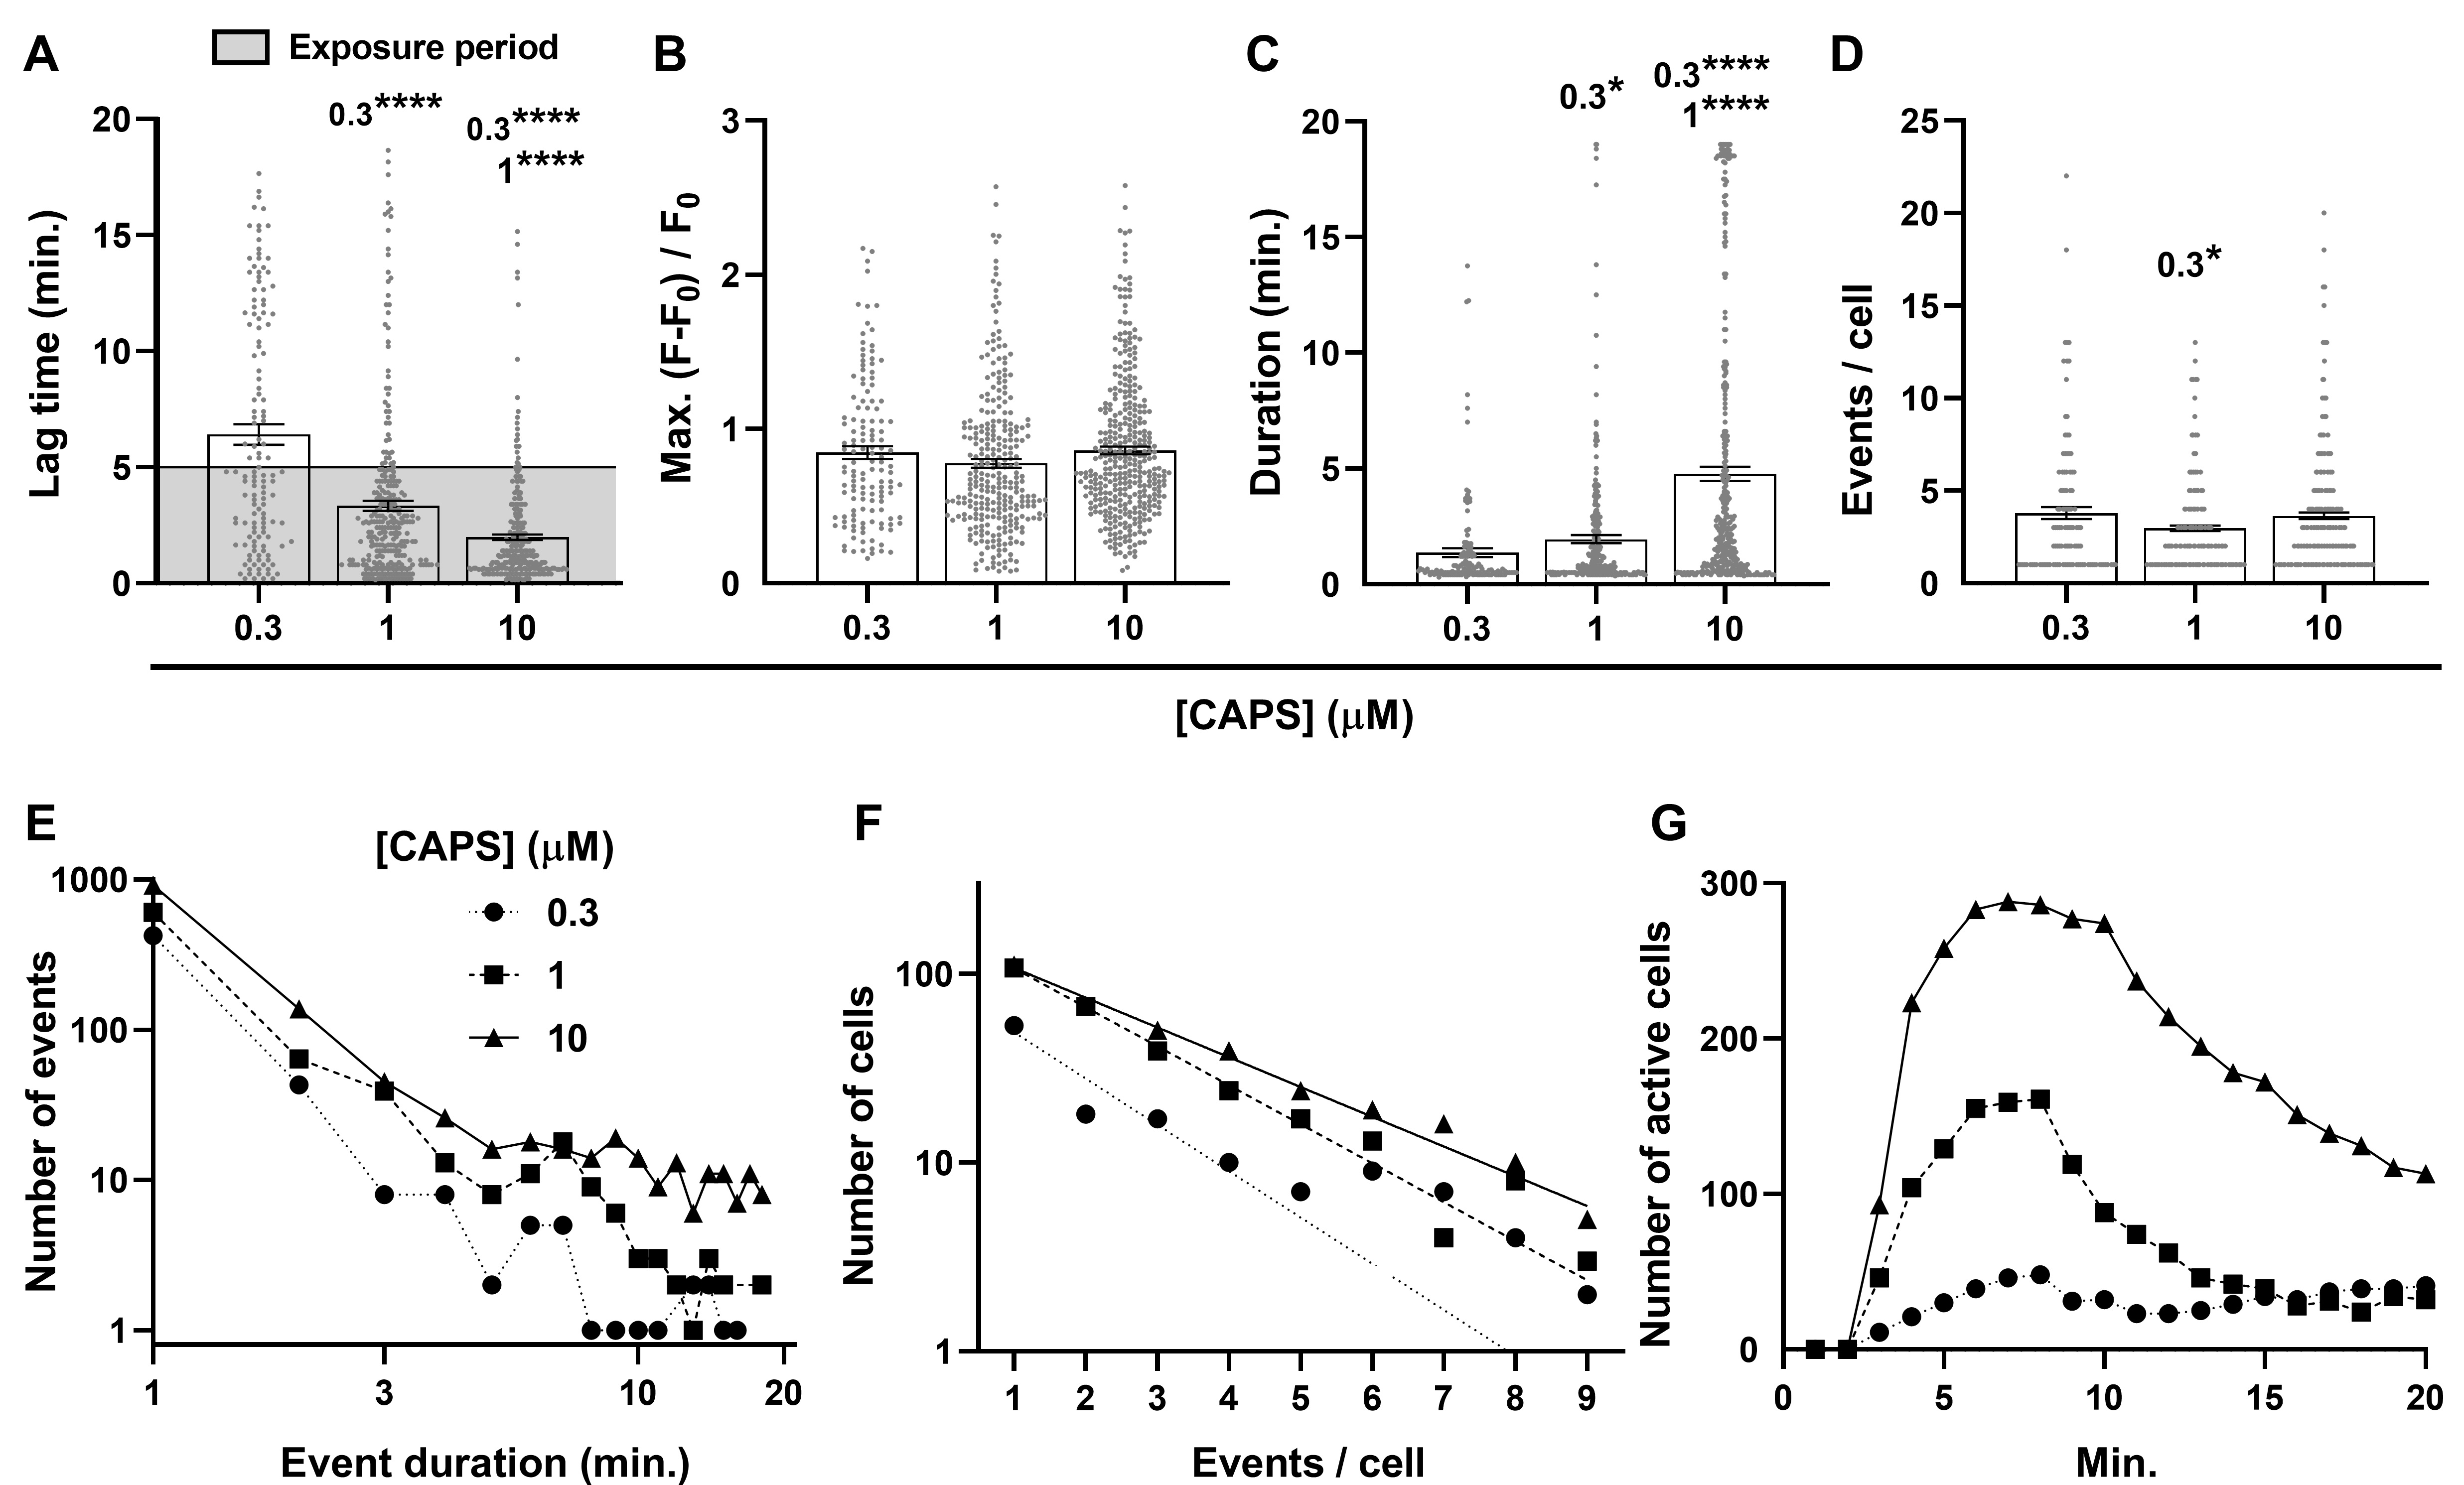
It was observed that averaging the fluorescence of responding cells conceals extensive heterogeneity between Ca2+ signals recorded from individual DRGNs. These brightened at different times, remained fluorescent for widely-varying periods and many flickered between high and low intensity states, as exemplified in the analysis of images from representative neurons (Supplementary Fig. 1). To simplify analysis, a created toolbox was utilised [23] comprising straightforward informative measurements (see Materials and Methods) that can be easily compared: 1. Number of responders, a count of all cells that produced a signal greater than F0 plus 10 x s.d.; 2. Lag, in minutes, a simple way of quantifying and comparing how quickly the DRGNs become excited; 3. Max., the largest increase in fluorescence ratio; 4. Duration of individual signals; 5. Number of discrete events, and 6. Summed (Σ) Duration, which indicates the cumulative amount of time individual cells exhibit signals. Deconstructing the cellular Ca2+ signals in this way highlighted several features that were strongly related to [CAPS] and others that were weakly or not associated. The lags were inversely associated with the agonist concentration; cellular responses to 1 μM CAPS appeared sooner than those elicited by 0.3 μM, whilst the delay with 10 μM was even shorter still (Fig. 2A). As noted above, irrespective of the concentration used, most of the fluorescent signals appeared within the 5 min. exposure to CAPS and raising [CAPS] selectively increased the proportion of neurons (note distribution of dots) displaying a short lag (Fig. 2A). By contrast, the Max. increase in fluorescence intensity (Fig. 2B) did not change significantly upon raising [CAPS]. This lack of change seems paradoxical given that raising [CAPS] elicited higher mean signals when plotted against time (Fig. 1B), but this latter average also depends on temporal properties of individual cell responses; these include time of activation (Fig. 2A) and signal duration (Fig. 2C) that proved more dependent on [CAPS]. Moreover, whilst raising [CAPS] skewed the temporal distribution of signals with high Max. (Fig. 1G), resulting in higher peaks earlier in the mean and summed fluorescence time courses (Fig. 1B, C), the data plotted in Fig. 2B are means of the Max. for all DRGNs excited over 20 min., including slow responders with relatively small changes in fluorescence intensity that reduce the average Max. (Fig. 1G).
Unlike Max., raising [CAPS] caused progressive and significant increases in the mean duration of signals (Fig. 2C). There was no significant [CAPS]-dependent increase in the mean number of signals evoked per cell (in fact, 1 μM CAPS elicited slightly less than 0.3; Fig. 2D), so raising [CAPS] likewise extended the total time cells exhibited fluorescence (a product of the duration of individual events x the number of events) above threshold. Such increases can be attributed specifically to higher numbers of signals with duration > 5 min. as these were very rarely induced by 0.3 μM CAPS, more often by 1 μM and frequently with 10 μM (Fig. 2E). By contrast, the frequency of shorter duration signals increased proportionally with [CAPS], as shown by parallel power relationships for signals up to 5 min. long (straight lines on log-log plots; Fig. 2E), which would not (by itself) alter mean signal duration. These parallel relationships reflect increases in the number of responding cells without changes in the frequency of occurrence for signals < 5 min. duration, whilst the deviations observed for those > 5 min. indicates a [CAPS]-dependent increase in the frequency of longer duration signals. On the other hand, the frequency distribution for cells with increasing numbers of signals, fit with single exponential regressions on a semi-log plot (Fig. 2F), revealed a slight tendency towards an increased number of events as [CAPS] was raised (manifested as slopes with decreasing gradients; -0.25, -0.21 and -0.16 for 0.3, 1 and 10 μM CAPS, respectively). The latter relationships were too weak to cause any significant change in the mean number of events per cell (Fig. 2D) because the majority of DRGNs produced 3 events or less per cell, where the relationships converged, but very few showed > 7 events where they diverged.
In summary, exposure to any [CAPS] elicited a mixture of responses similar to those shown in Supplementary Fig. 1, and raising its concentration increased the total number of cells that met the response criterion (Fig. 1A), accelerated responses (Fig. 1F, 2A), particularly those exhibiting high Max. intensity (Fig. 1G), and escalated the proportions of cells having either multiple discrete signals (Fig. 2F) or a few long events (Fig. 2C, E). The consequence of these changes in Ca2+ signals induced by increasing [CAPS] is that more neurons are activated with a faster onset and, due to a slower decline in signal intensity, they also remain active for longer (Fig. 2G). These features underlie the relatively steep initial slope, high peak and slow decline of cumulative fluorescence signal in the DRGN population induced by high
(10 μM) [CAPS] (Fig. 1C).
The intensity and duration of Ca2+ signals are inversely related to the number of events in individual cells but increase with successive events in a series
The analytical tools were next used to investigate whether the consecutive signalling events observed during continuous exposure to CAPS remained constant or changed systematically (Fig. 3). As the majority of DRGNs excited by CAPS began signalling within the 5 min. application period (Fig. 1F), and to exclude changes in signal properties that might be attributable to lowering [CAPS] during the subsequent washout (Supplementary Fig. 3), only signals that initiated within this 5 min. period were subjected to analysis. However, measurements were continued for a further 15 min. for these signals that had started before the 5 min. cut-off point. DRGNs were categorised according to [CAPS] and the number of events in each cell’s response. Max. intensity responses were compared between (1) neurons displaying different number of events and (2) individual peaks within trains of events (Fig. 3A-C). Remarkably, this unveiled that signals tended to be more intense (Fig. 3A-C) and longer-lasting (Fig. 3E-G) in cells with fewer discrete events. Moreover, these trends became stronger as [CAPS] was raised because this selectively promoted single events of extended duration. In response to 0.3 μM CAPS, there were no significant differences detected for Max. signal intensity or duration between DRGNs exhibiting one discrete signal and those that signalled twice. However, the Max. intensity was lower in cells showing three events and more significantly reduced in those with four (Fig. 3A; #p<0.05, ###p<0.001), although no significant reduction in duration was seen (Fig. 3E). These trends were strengthened upon stimulation with 1 μM CAPS; the Max. intensity (Fig. 3B) was lower in DRGNS that signalled twice compared to once (#p<0.05), and even more significantly decreased in cells that responded with a series of three or four events (####p<0.0001). Moreover, for 1 μM CAPS, an equivalent trend was also detected for durations (Fig. 3F). Increasing [CAPS] to 10 μM further strengthened these trends for both Max. intensity (Fig. 3C) and duration (Fig. 3G). In contrast, comparisons between events in the same series revealed that consecutive signals tended to increase in Max. intensity and duration. These trends were more significant for responses to 1 or 10 than 0.3 μM CAPS (*p<0.05, **p<0.01, ***p<0.001 and ****p<0.0001). Moreover, the facilitation of signals’ intensities and durations was strongest for the second of two events and progressively weakened for DRGNs showing series of three and four events, respectively.
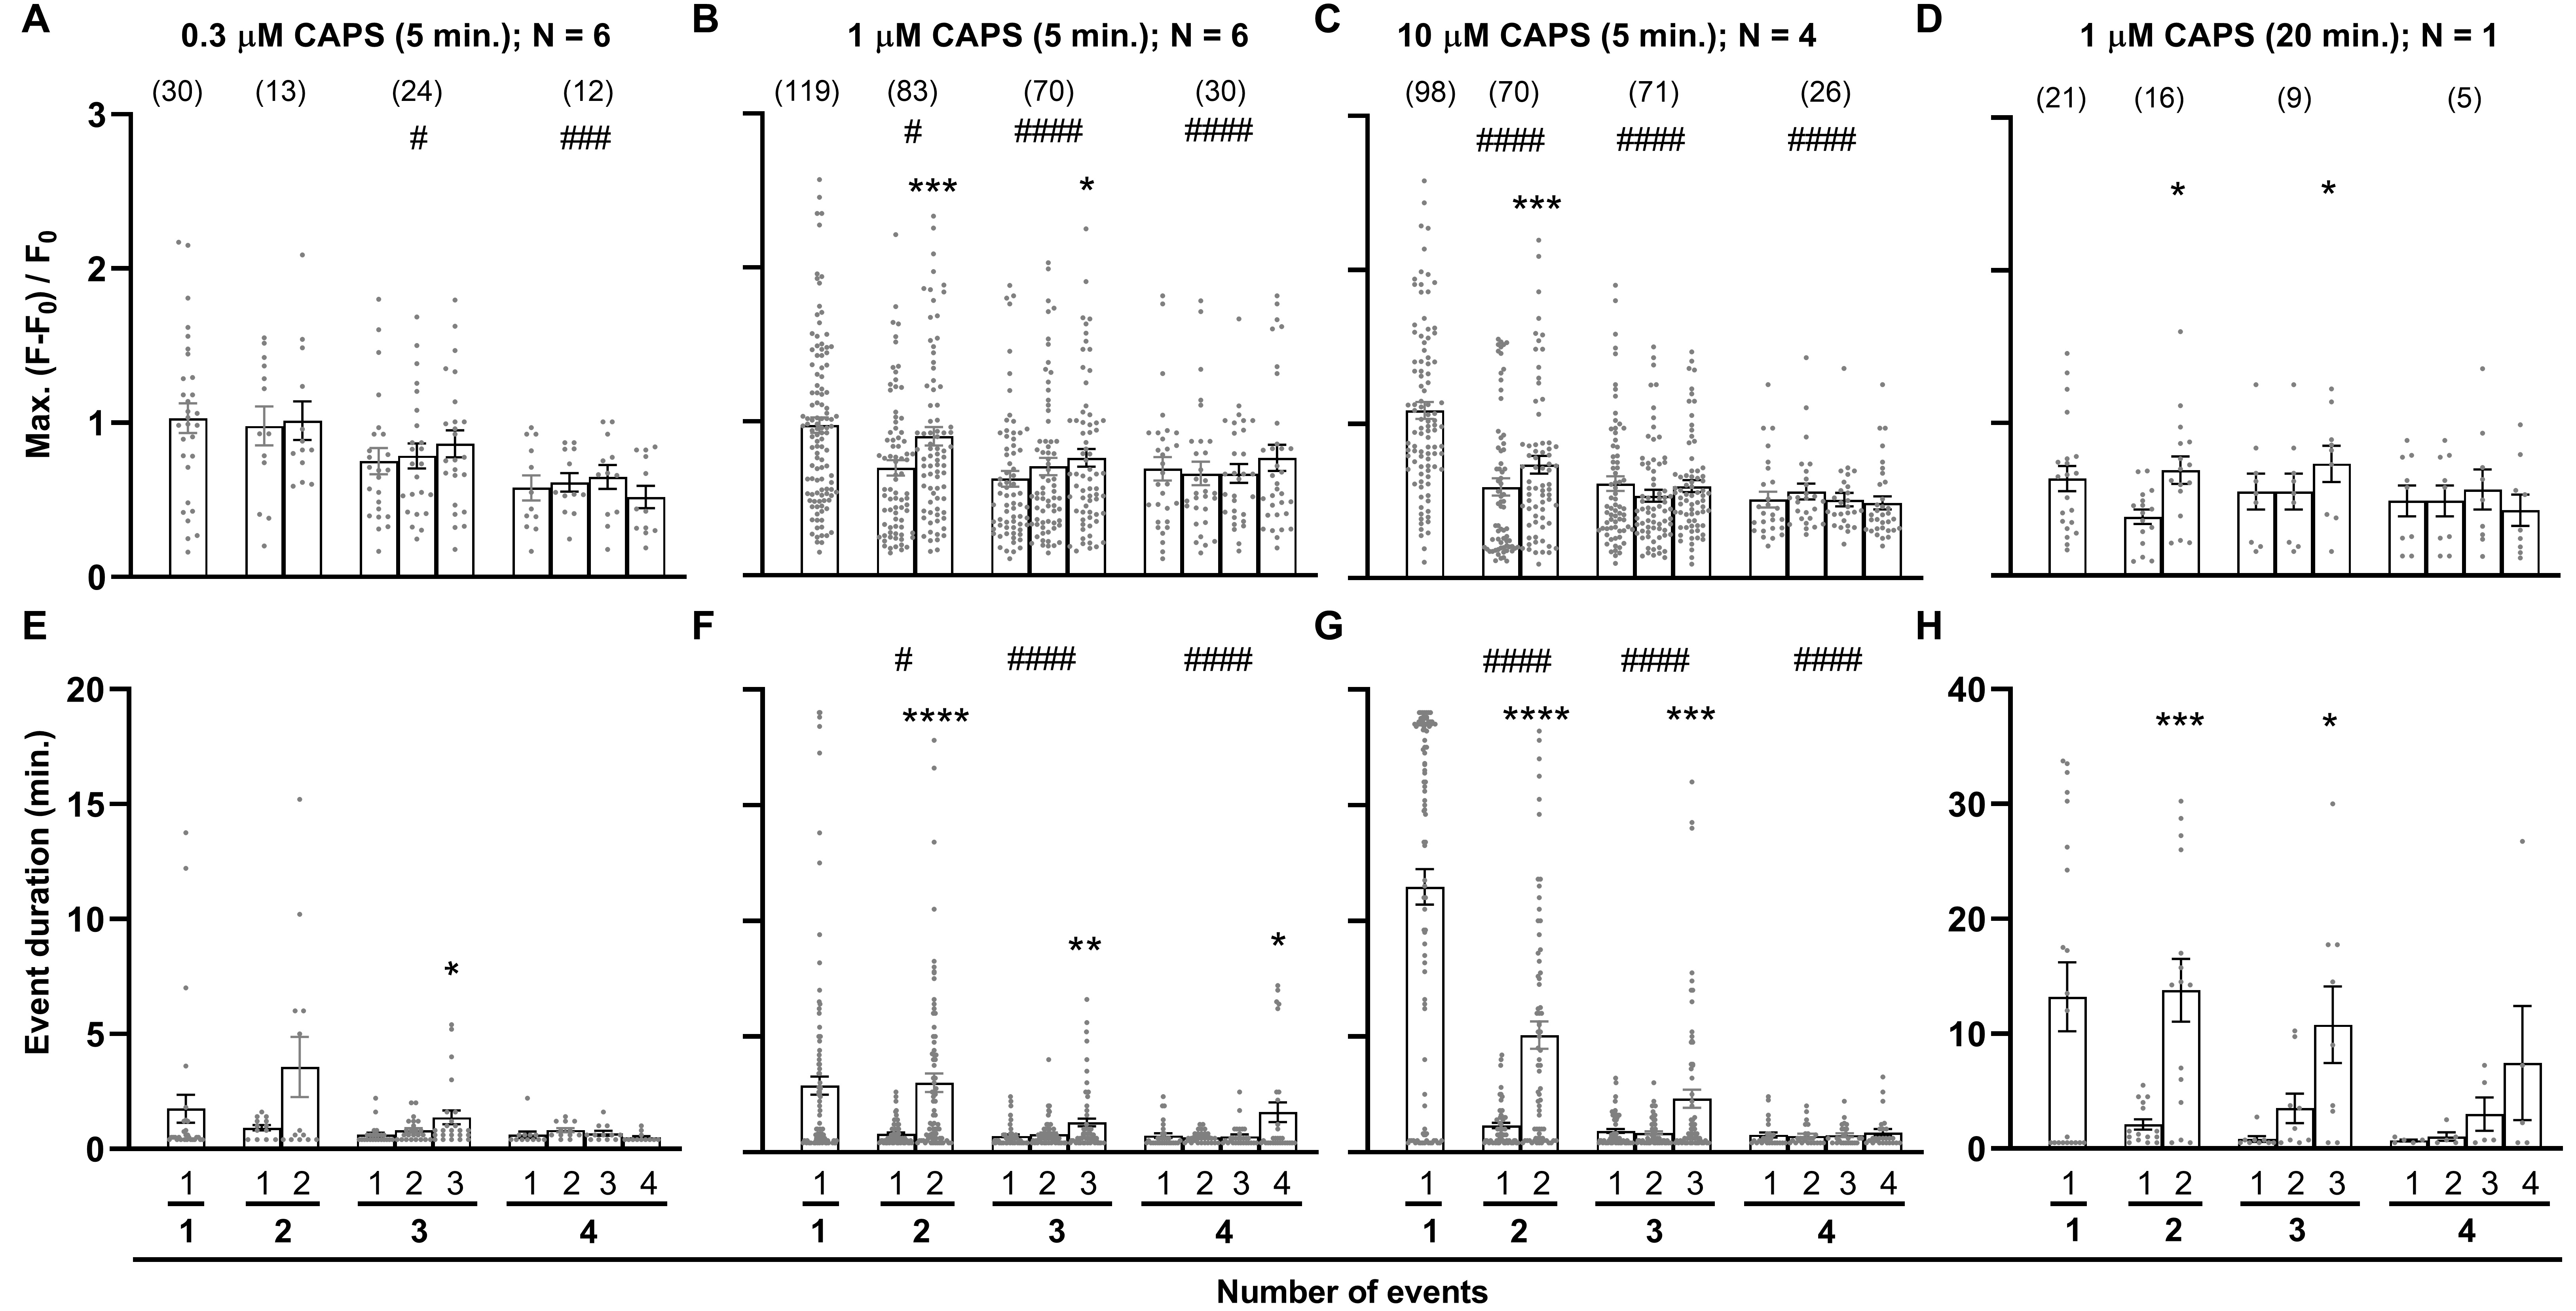
Extending the period of exposure to CAPS strengthens the facilitation of consecutive signals
The changes induced by prolonging exposure to CAPS were examined next. DRG were stimulated with 1 μM CAPS for 20 min. followed by 20 min. washout. Unlike increasing [CAPS], this did not accelerate cell activation and although a small increase in the number of neurons activated was observed these, unsurprisingly, were late responders. Consequently, prolonging 1 μM CAPS does not produce a big spike of summed fluorescence for the DRGN population like that evoked by 10 μM (Fig. 1C, Supplementary Fig. 4). but, rather, prolongs signalling in the smaller population of DRGNs that do respond to the lower concentration (Supplementary Fig. 4). All signals that started during this longer exposure to CAPS were analysed. The mean Max. was a little low (Fig. 3D c.f. B) because these DRG had been exposed previously to 1 μM CAPS for 5 min. (Supplementary Fig. 4), a phenomenon examined in more detail later. Otherwise, the Max. of responses to 20 min. CAPS was similar to that for 5 min., including the facilitation of signals in series of 2 or 3 events (Fig. 3D c.f. B). More obvious changes were observed for signal duration (Fig. 3H; note the altered scale). The mean duration in cells showing one event quadrupled, from 2.9 ± 0.4 (5 min. with 1 μM CAPS; Fig. 3F) to 13 ± 3 min. (20 min. with 1 μM CAPS Fig. 3H). Likewise, the duration of the second of two events extended from 3.0 ± 0.4 to 14 ± 3 min., and the third of three from 1.3 ± 0.2 to 11 ± 3 min., whereas much more modest changes were observed for the first of two (0.8 ± 0.1 to 2.1 ± 0.5 min.) or three events (0.7 ± 0.1 to 0.8 ± 0.2 min.). Thus, extending the period of exposure to 1 μM CAPS strongly enhanced the facilitation of consecutive signals in DRGNs that responded with a series of events, starting with short, relatively low intensity signals and progressing towards much longer duration fluorescence of higher intensity. The prolonged exposure to 1 μM CAPS also increased the proportion of neurons with 5 or more events (within 20 min.) from 14 % of responders to 5 min. CAPS / 15 min. washout to 35 % of the DRGNs excited during 20 min. with CAPS. Accordingly, unlike raising [CAPS], extending exposure time produced a significant increase in the mean number of events per cell in 20 min. (from 2.9 ± 0.2 to 3.6 ± 0.3; *p<0.05). As prolonged exposure to CAPS increased the mean number of [Ca2+]i fluctuations and enhanced signal facilitation (Fig. 3H), TRPV1 is required for the latter. By contrast, Ca2+ release from internal stores does not seem to be involved because thapsigargin, an inhibitor of the sarco/endoplasmic reticulum Ca2+-ATPase (SERCA), did not reduce fluctuations of [Ca2+]i induced by 10 μM CAPS (Supplementary Fig. 5A, B). On the contrary, it enhanced single signals and the first in a series of 2-4 events, suggesting that removal of Ca2+ from the cytoplasm by the SERCA might limit gains in cytoplasmic [Ca2+]i.
Repeated stimulation with 1 μM CAPS faithfully elicits [Ca2+]i signals with apparently weak tachyphylaxis
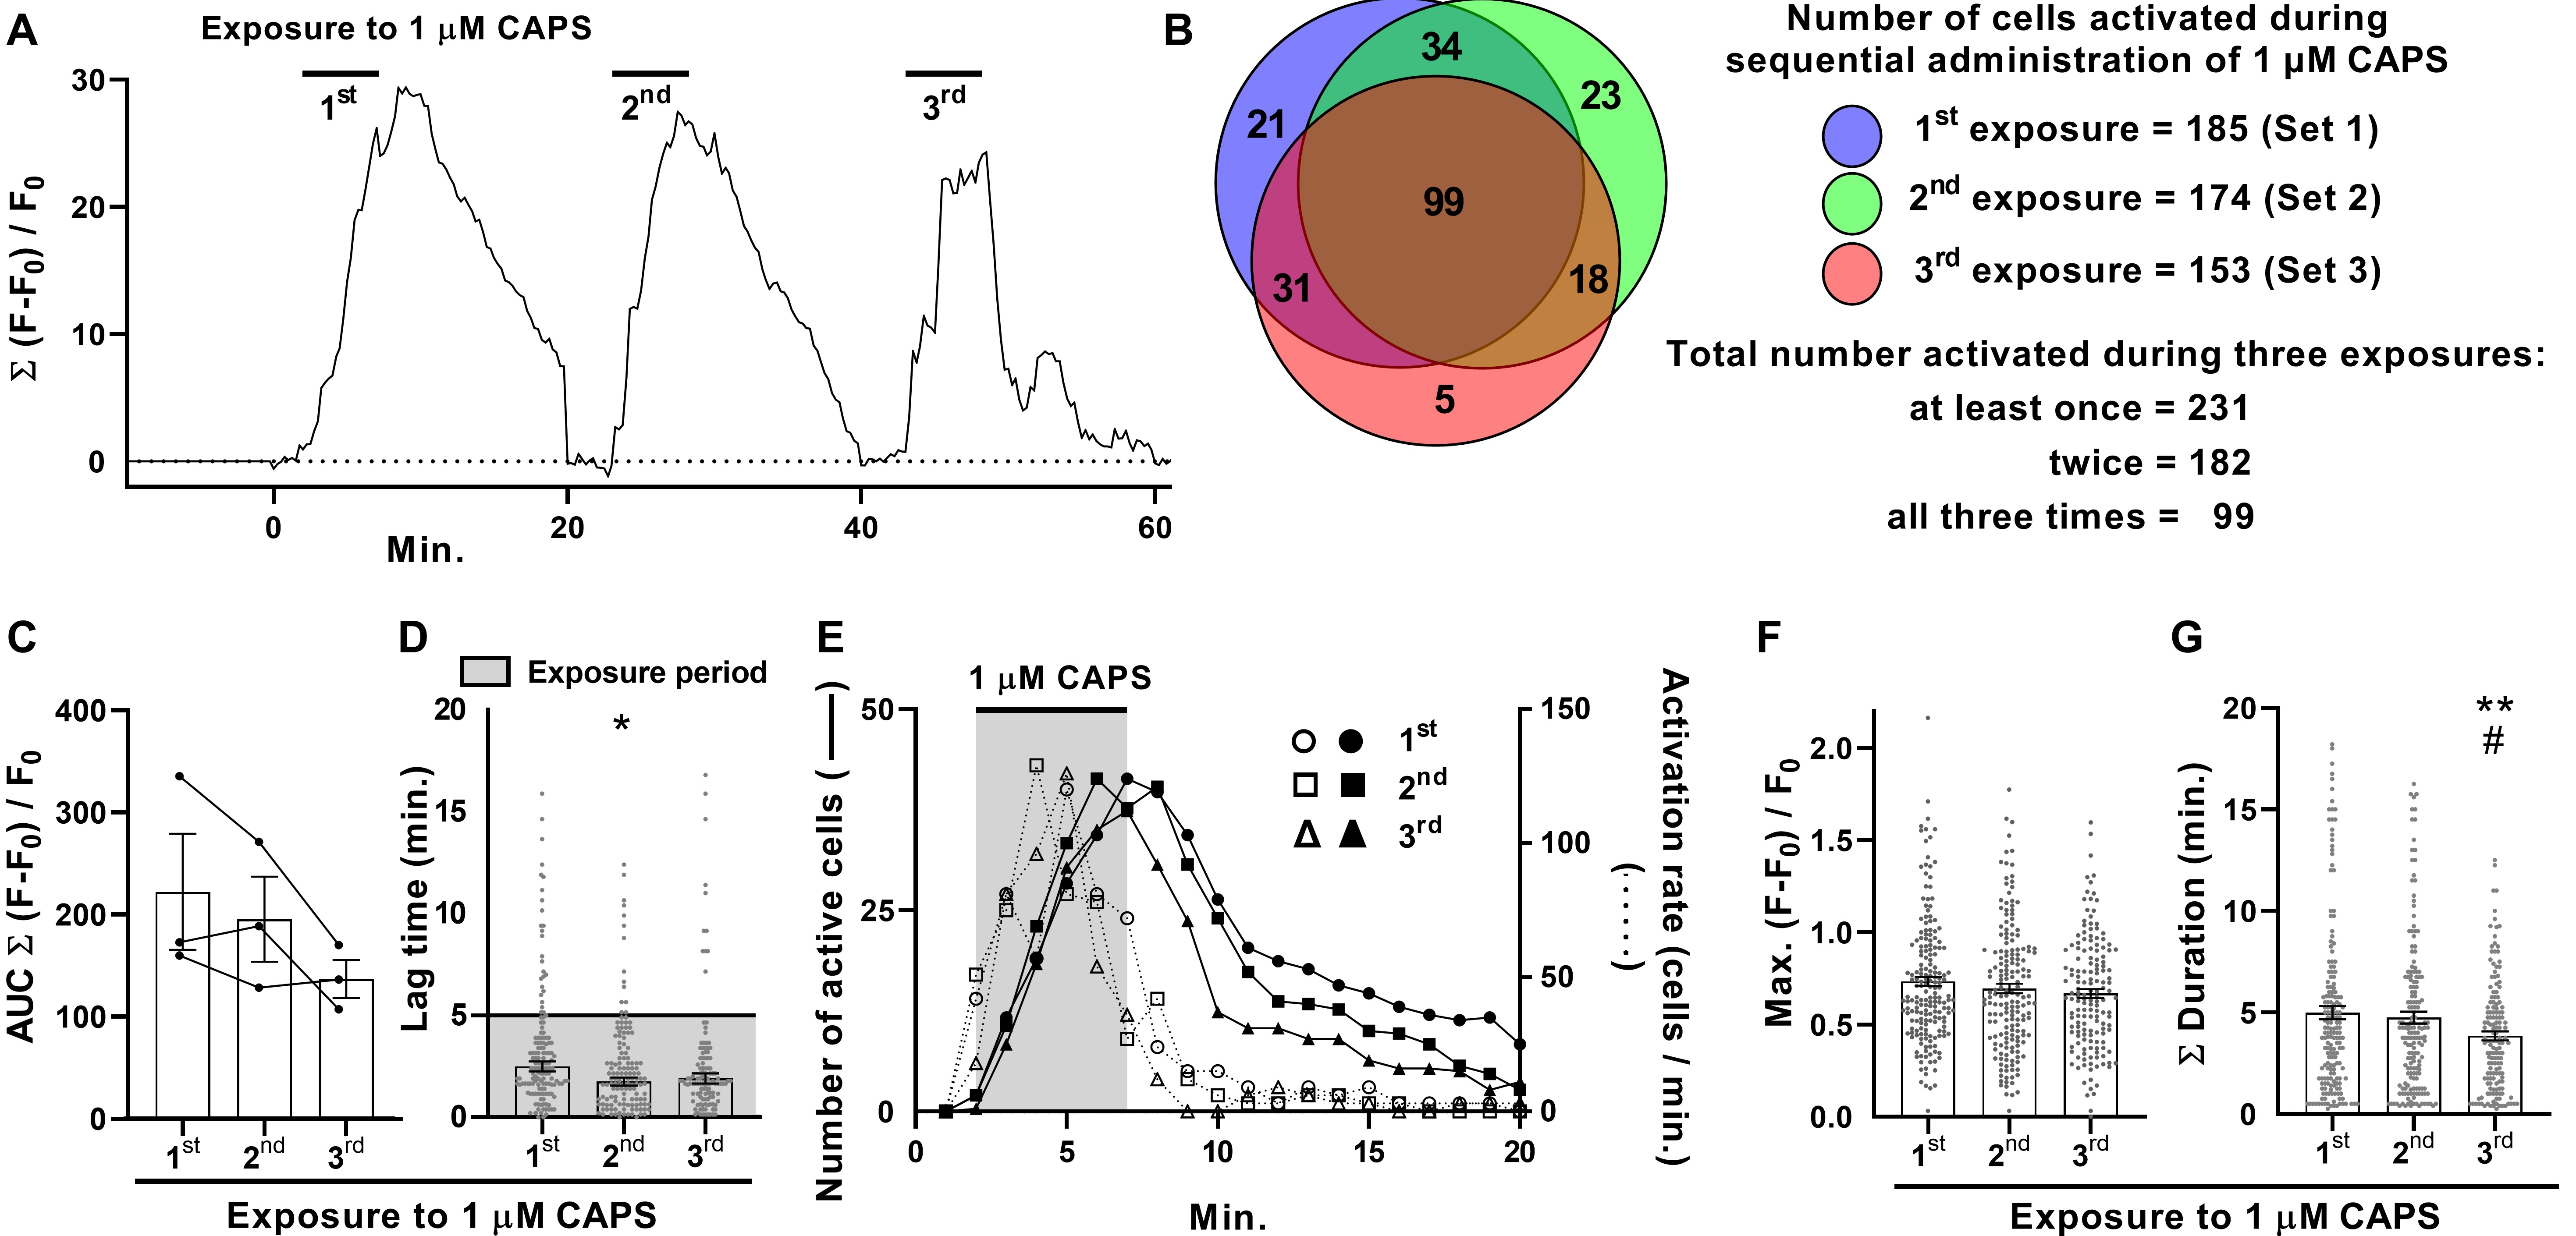
It is well established that nociceptors exhibit reduced responses upon repeated application of CAPS, a process termed tachyphylaxis (see Introduction). To investigate how this phenomenon impacts responses across DRGN populations, DRG were exposed thrice to 1 μM CAPS for 5 min. each time with 15 min. washouts in-between (Fig. 4A; one example of three recordings). Applying the threshold criterion used before, the number of DRGNs excited by each successive stimulus (in total from 3 DRG recordings; Fig. 4B) fell slightly, from 185 for the first (Set 1) to 174 the second (Set 2) and 153 the third time (Set 3). The Max. summed fluorescence showed no consistent change (data not shown) but the mean AUC progressively declined for each successive stimulation (Fig. 4C), so the analysis tools were employed to investigate a basis for this. Surprisingly, there was a slight reduction in lag time (Fig. 4D), indicating that cells seemed to respond faster, on average, the second and third time the DRG were exposed to CAPS. However, activation rates were similar all three times (Fig. 4E, dotted lines) and, hence, active DRGNs numbers accumulated at almost identical rates during exposure to CAPS (Fig. 4E, solid lines in the shaded area). Thus, the shorter average lag times for the second and third stimulations seems to be due, in part at least, to fewer cells with long lag periods. Notably, the Max. fluorescence ratio did not change significantly for successive stimulations (Fig. 4F). By contrast, there was a progressive reduction in individual signal duration (not shown) and Σ duration (Fig. 4G), which reached significance for the third stimulation. The consequence of reduced durations is a more rapid decline in the number of active cells after the removal of CAPS for the second and, faster again, third stimulations (Fig. 4E). Moreover, because Max. did not change significantly, the progressive reduction in signal density in the DRGN population (AUC, Fig. 4C) can be attributed to the reduced cumulative time DRGNs were active during the recording period (Fig. 4G).
In subsets of CAPS-excited DRGNs reductions in signal intensity, indicative of tachyphylaxis, were observed to variable extents
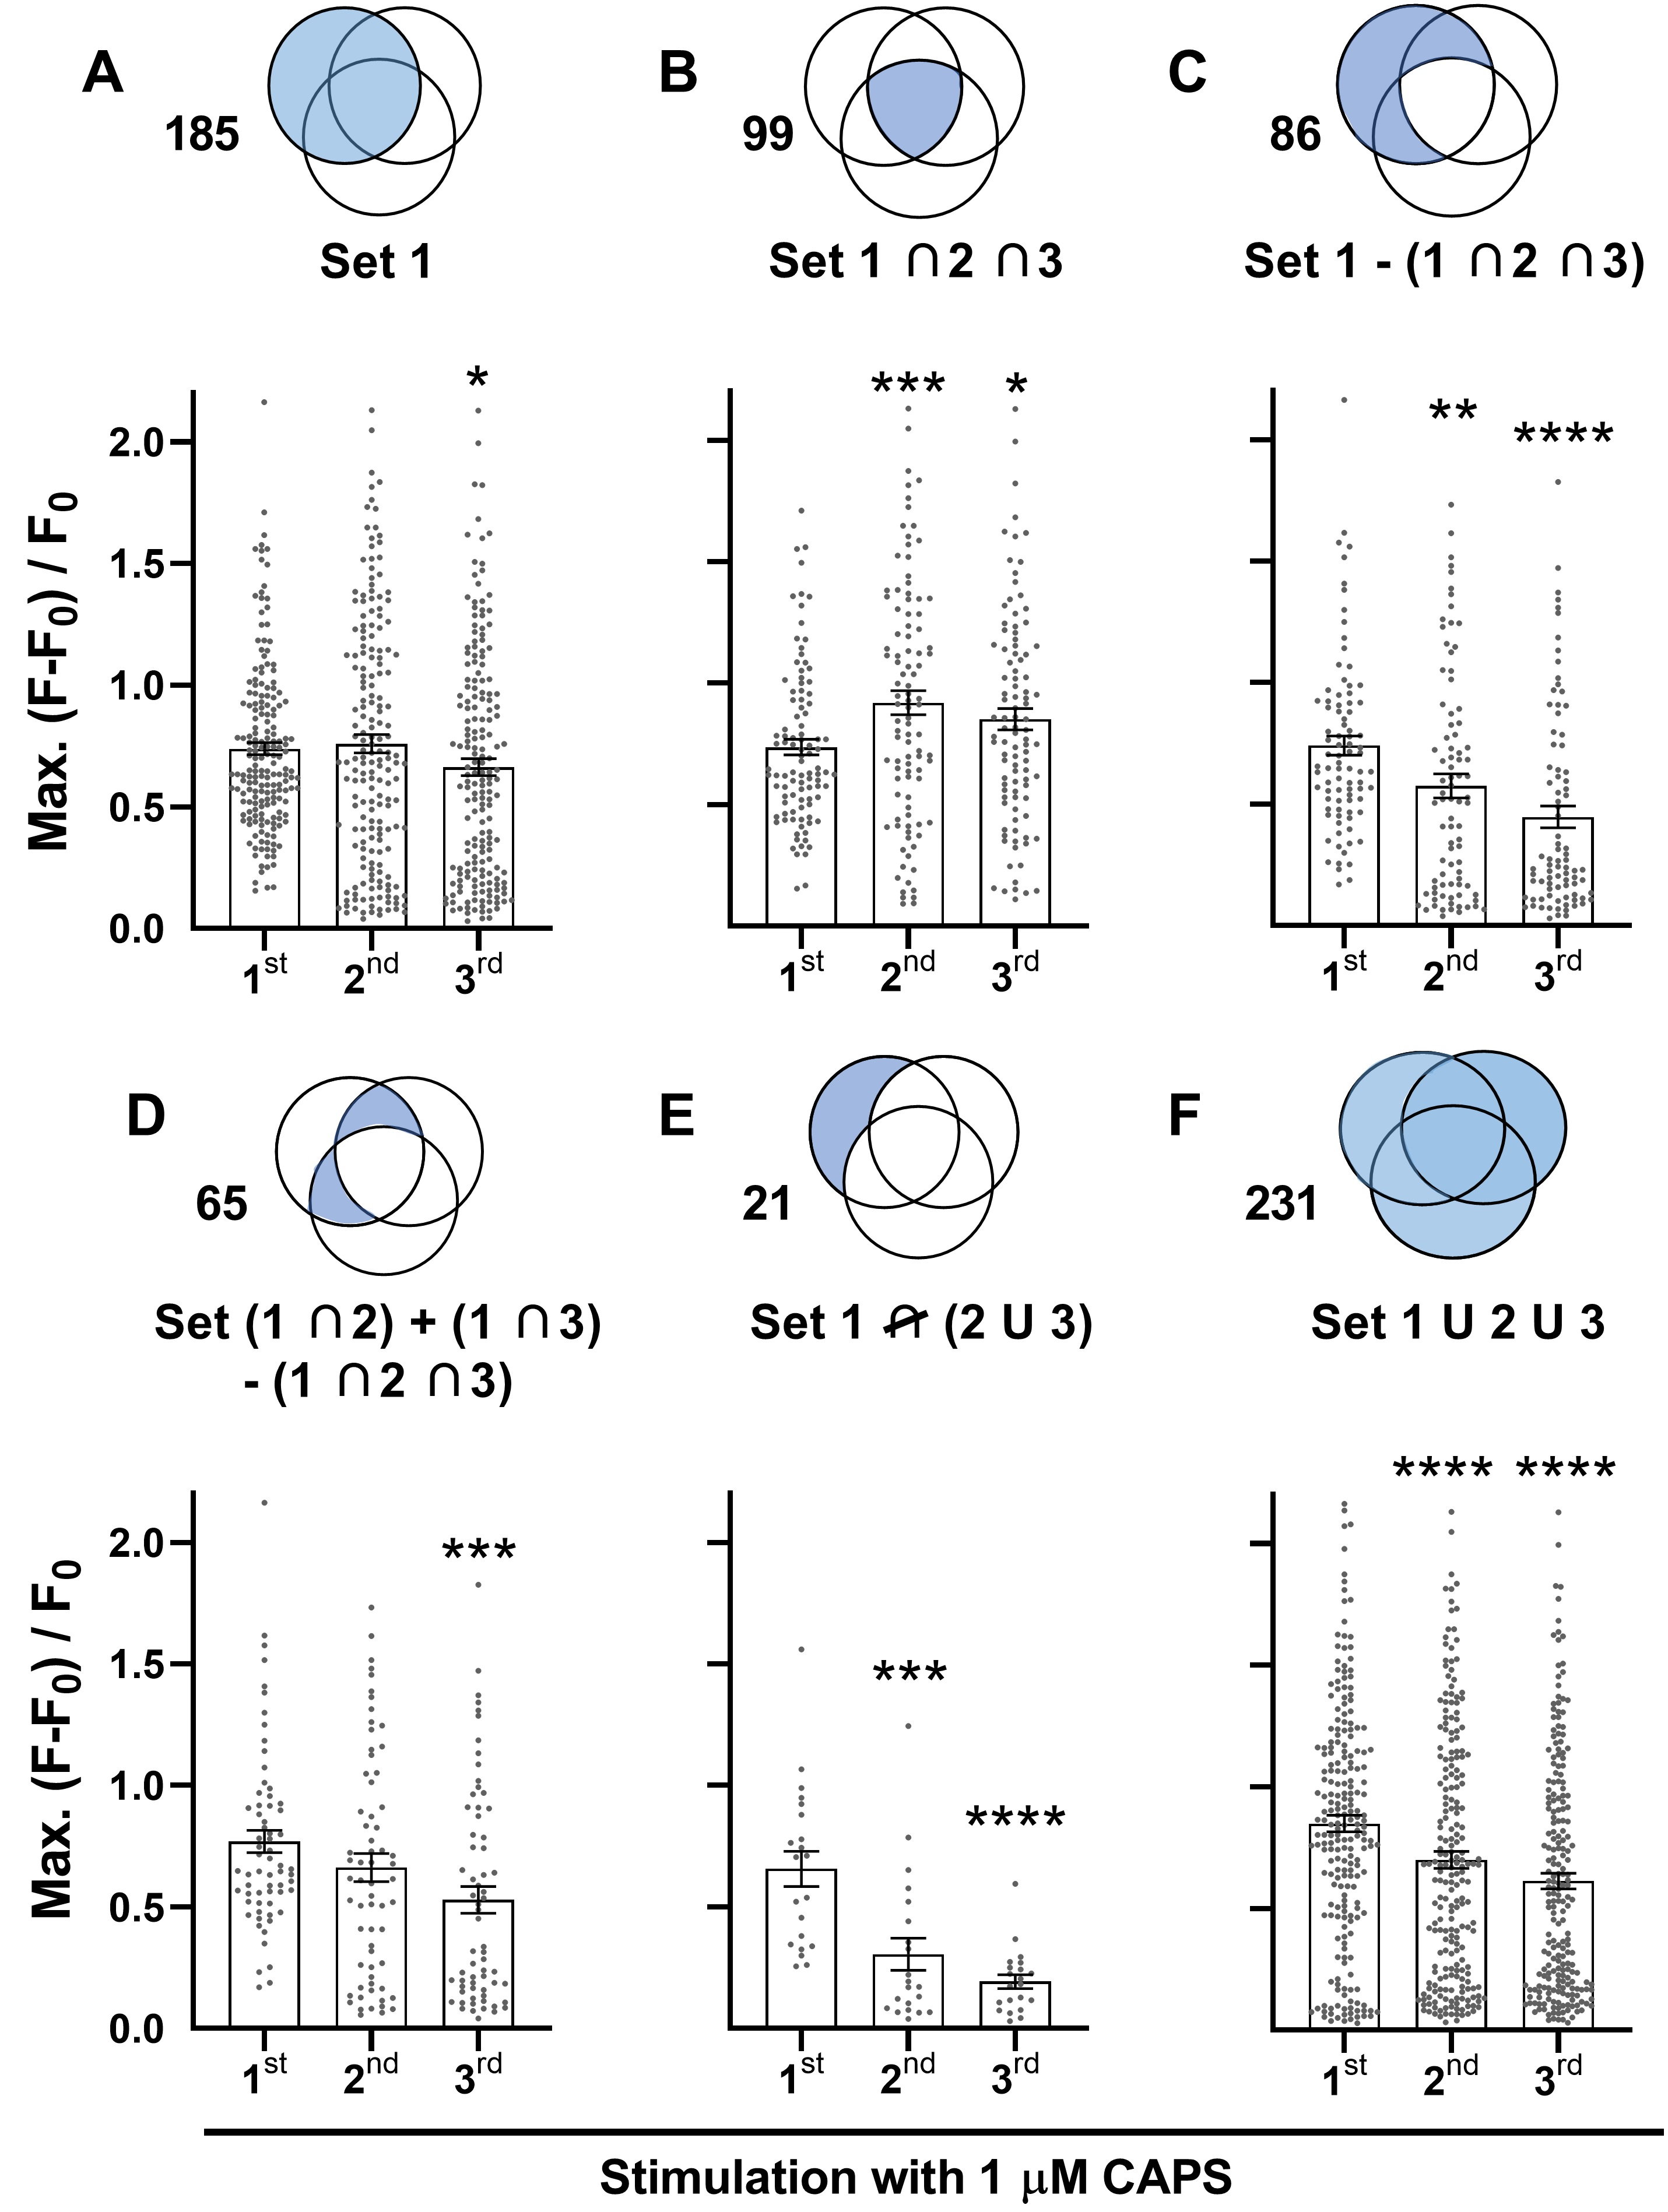
The ability of CAPS to repeatedly induce [Ca2+]i of similar mean Max. was unexpected, as reductions in current amplitude are a defining characteristic of CAPS tachyphylaxis [11, 18, 24] and, as demonstrated above (Fig. 1H, I) and in previous reports, CAPS-induced [Ca2+]i signals are completely dependent on the entry of extracellular Ca2+ [17] through TRPV1 channels [25]. This apparent discrepancy warranted further investigation. Prior studies [11, 18, 26] into tachyphylaxis have typically used the first exposure to CAPS as a screening step to identify neurons that are excited by this algogen. Only those that satisfied a defined response criterion were used for comparison of signals evoked by repeated stimulations; thus, such a protocol was replicated here. DRG were consecutively stimulated with 1 μM CAPS and each time distinct, but overlapping, sets of neurons, defined herein as Sets 1, 2 and 3 (represented in a Venn diagram in Fig. 4B by blue, green and pink circles, respectively) were activated. DRGNs that met the response criterion (>F0 + 10 x s.d.) upon the first stimulation were assigned to Set 1 (Fig. 5A). The Max. amplitude of neurons in Set 1 was measured for the first, second and third stimulation; each value is represented by a dot in the scatter plot (Fig. 5A). Note that not all the DRGNs in Set 1 met the response criterion for the second and third stimulation (Fig. 4B); e.g. 21 neurons (11 % of 185) failed to respond to either of the latter, 34 (18 %) were excited the second time but not the third, 31 (17 %) the third time but not the second and 99 (54 %) DRGNs were excited all three times. As reductions in Max. are indicative of tachyphylaxis, sub-threshold Max. values were included in this analysis for stimulations two and three (Fig. 5A; note the accumulation of low values for the second and third rounds, whereas small values are sparse for the first stimulation due to the threshold criterion). Notably, applying this refined analysis revealed significant tachyphylaxis of Max. amplitude in the DRGNs of Set 1 by the third stimulation (Fig. 5A). However, the 99 DRGNs of Set 1 that responded to CAPS all three times (the intersect of Sets 1, 2 and 3; Set 1∩2∩3) actually increased average Max. for the second stimulation and remained elevated for the third (Fig. 5B). By contrast, the other 86 DRGNs of Set 1 [Set 1 - (1∩2∩3)] displayed extensive reductions in Max. for consecutive stimulations (Fig. 5C). Thus, the DRGN population consists of neurons displaying distinct responses to repeated chemical stimulation; facilitation (Fig. 5B) and tachyphylaxis (Fig. 5C). Moreover, the latter group can be further sub-divided into neurons that responded twice to CAPS (Fig. 5D) and those that were excited only once (Fig. 5E). One-time responders displayed particularly extensive tachyphylaxis whereas smaller, though still highly significant, reductions in Max. occurred in two-time responders. Thus, tachyphylaxis was observed in GCaMP3 DRGNs exposed repeatedly to CAPS but varied in extent from near complete (Fig. 5E) to none / facilitation (Fig. 5B). Moreover, the high content screening facilitated by Ca2+ imaging of whole DRG revealed that suppression of cell signalling due to tachyphylaxis was extensively compensated in consecutive stimulations by the recruitment of new cohorts of CAPS-excitable neurons, which would not have been detected by electrophysiological recordings of one cell at a time. Nevertheless, analysis of all responders (i.e. every DRGN that was excited at least once upon any of three consecutive stimulations, Set 1U2U3; Fig. 5F) revealed a slight, but highly significant, tachyphylaxis of consecutive responses integrated for the ‘whole’ 1 μM CAPS-excitable population.
Repeated stimulation with CAPS selectively depressed high-intensity, long duration signals
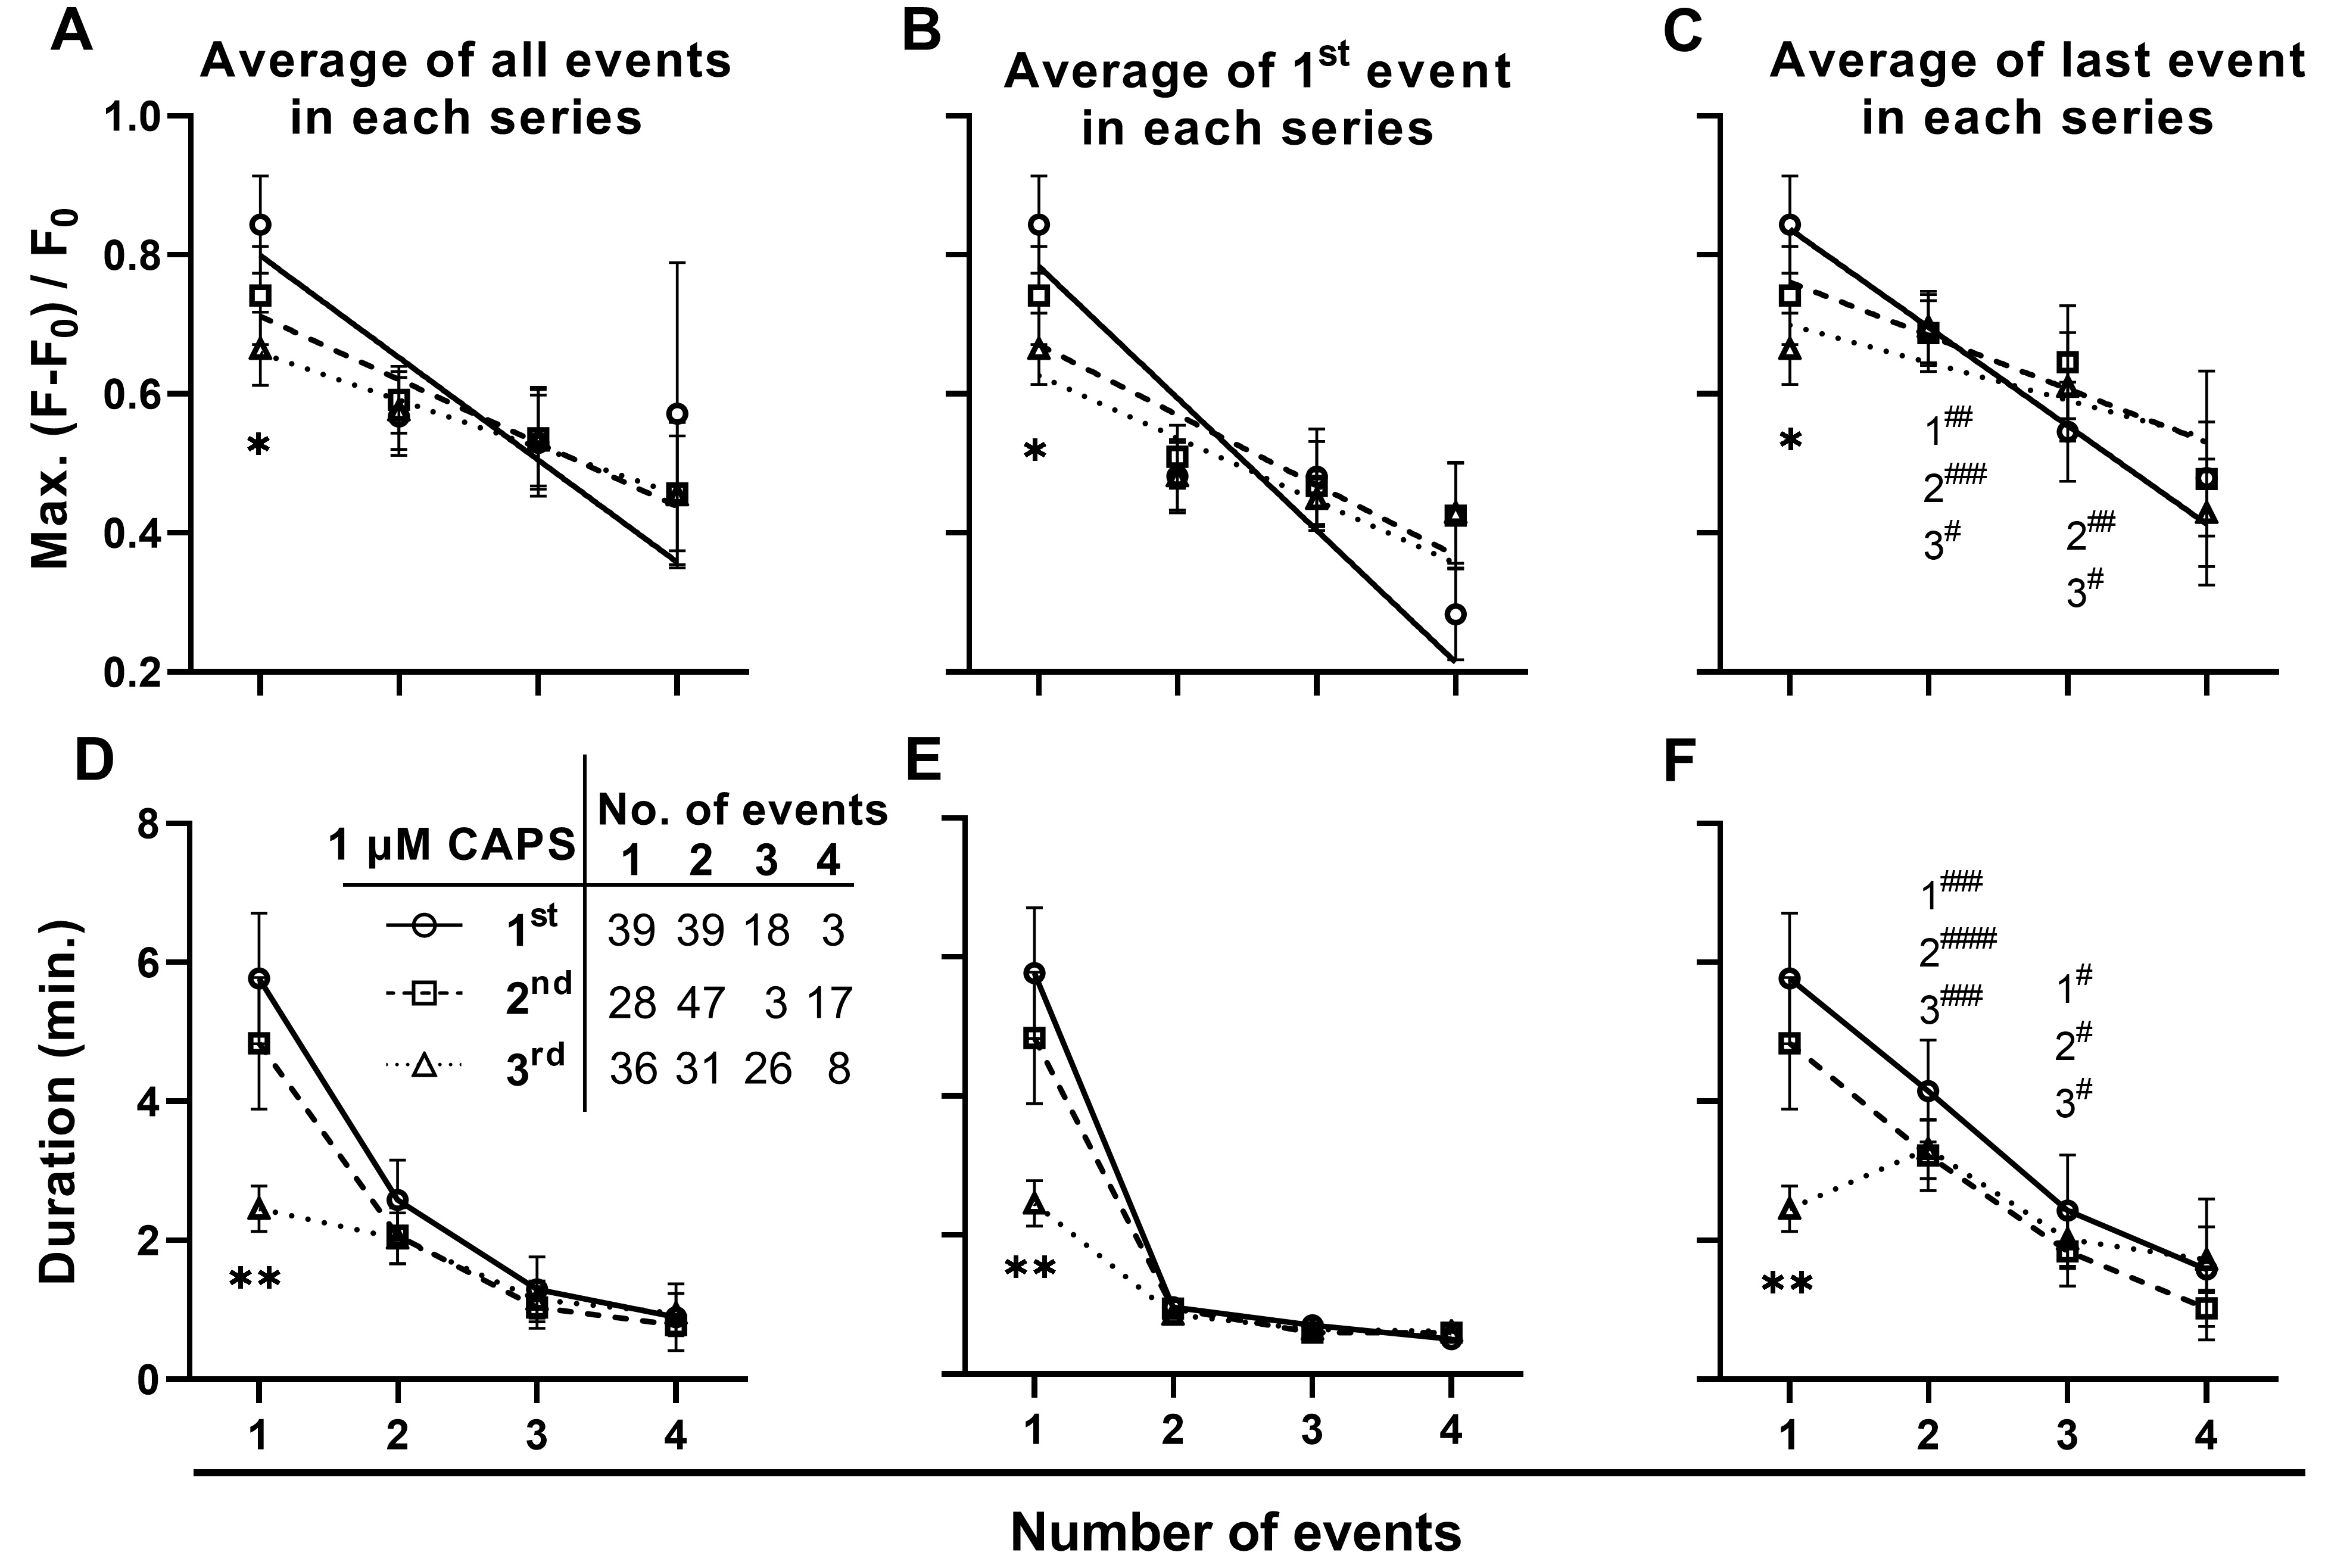
To further elucidate the changes underlying tachyphylaxis, the effect of repeated stimulation on the relationships between Max., or duration, and event sequence were investigated for signals that were initiated within the 5 min. of exposure to CAPS before washout. This revealed that repeated stimulation resulted in a selective reduction in Max. and duration in DRGNs exhibiting only one signal (Fig. 6A, D). By contrast, in DRGNs that responded with 2 or more events, no significant changes were observed in the average Max. (Fig. 6A) and duration (Fig. 6D), or the first event Max. (Fig. 6B) and duration (Fig. 6E). As noted earlier (Fig. 3), the Max. and duration tended to facilitate for consecutive signals in neurons that responded with a series of 2 – 4 events. Accordingly, the Max. and duration of the last event in each of series was consistently greater than the first event (Fig. 6C [c.f. B] and Fig. 6F [c.f. E]; hash tags indicate the significance of enhancements between the first and last signal for series evoked during the 1st, 2nd and 3rd stimulations). Notably, repeated stimulation had no impact on the facilitation of signals (Fig. 6E, F; the extents of enhancement were similar for the first, second and third stimulation). This means that tachyphylaxis occurred predominantly in DRGNs exhibiting one strong event (higher Max. and longer duration than average), whilst there was no evidence of tachyphylaxis in neurons that initially displayed weak signals (relatively low Max. and short duration) but facilitated in the continued presence of CAPS. Thus, recruitment and facilitation of initially weak responders mitigates signal depression due to tachyphylaxis, so this sustains communal responses in DRGN populations. These results provide a possible explanation for clinical experience that CAPS nociception is sustained far beyond the timescale of acute desensitisation and tachyphylaxis observed in vitro.
We thank Drs. Caren Antoniazzi and Seshu Kaza for breeding, genotyping and taking care of the pirt-GCaMP3 mice. Dr. Sergei Baryshnikov is thanked for initially setting up the microscope system for Ca2+ imaging.
Author Contributions
GL, THZ and JOD conceived and designed the project. The experiments were carried out by GL, assisted by THZ; data analysis was performed by GL who drafted the manuscript. JOD launched the research programme, provided the facilities, and finalised writing of the paper.
Funding
This work was supported by an Investigators Programme (IvP) award (15/1A/3026) to JOD from Science Foundation Ireland.
Statement of Ethics
The animal husbandry and experimental procedures were approved by the Research Ethics Committee of Dublin City University and the Health Products Regulatory Authority of Ireland (Project Authorisation no. AE19115/P020).
The authors have no conflicts of interest to declare.
| 1 Fayaz A, Croft P, Langford RM, Donaldson LJ, Jones GT: Prevalence of chronic pain in the UK: a systematic review and meta-analysis of population studies. BMJ Open 2016;6:e010364. https://doi.org/10.1136/bmjopen-2015-010364 |
||||
| 2 Barker PA, Mantyh P, Arendt-Nielsen L, Viktrup L, Tive L: Nerve growth factor signaling and its contribution to pain. J Pain Res 2020;13:1223-1241. https://doi.org/10.2147/JPR.S247472 |
||||
| 3 Nilius B, Owsianik G: The transient receptor potential family of ion channels. Genome Biol 2011;12:218. https://doi.org/10.1186/gb-2011-12-3-218 |
||||
| 4 Coghill RC: The distributed nociceptive system: A framework for understanding pain. Trends Neurosci 2020;43:780-794. https://doi.org/10.1016/j.tins.2020.07.004 |
||||
| 5 Wang F, Belanger E, Cote SL, Desrosiers P, Prescott SA, Cote DC, De Koninck Y: Sensory afferents use different coding strategies for heat and cold. Cell Rep 2018;23:2001-2013. https://doi.org/10.1016/j.celrep.2018.04.065 |
||||
| 6 Caterina MJ, Schumacher MA, Tominaga M, Rosen TA, Levine JD, Julius D: The capsaicin receptor: a heat-activated ion channel in the pain pathway. Nature 1997;389:816-824. https://doi.org/10.1038/39807 |
||||
| 7 Julius D: TRP channels and pain. Annu Rev Cell Dev Biol 2013;29:355-384. https://doi.org/10.1146/annurev-cellbio-101011-155833 |
||||
| 8 Jancso N, Jancso-Gabor A, Szolcsanyi J: Direct evidence for neurogenic inflammation and its prevention by denervation and by pretreatment with capsaicin. Br J Pharmacol Chemother 1967;31:138-151. https://doi.org/10.1111/j.1476-5381.1967.tb01984.x |
||||
| 9 Caterina MJ, Leffler A, Malmberg AB, Martin WJ, Trafton J, Petersen-Zeitz KR, Koltzenburg M, Basbaum AI, Julius D: Impaired nociception and pain sensation in mice lacking the capsaicin receptor. Science 2000;288:306-313. https://doi.org/10.1126/science.288.5464.306 |
||||
| 10 Davis JB, Gray J, Gunthorpe MJ, Hatcher JP, Davey PT, Overend P, Harries MH, Latcham J, Clapham C, Atkinson K, Hughes SA, Rance K, Grau E, Harper AJ, Pugh PL, Rogers DC, Bingham S, Randall A, Sheardown SA: Vanilloid receptor-1 is essential for inflammatory thermal hyperalgesia. Nature 2000;405:183-187. https://doi.org/10.1038/35012076 |
||||
| 11 Docherty RJ, Yeats JC, Bevan S, Boddeke HW: Inhibition of calcineurin inhibits the desensitization of capsaicin-evoked currents in cultured dorsal root ganglion neurones from adult rats. Pflugers Arch 1996;431:828-837. https://doi.org/10.1007/s004240050074 |
||||
| 12 Huang J, Zhang X, McNaughton PA: Modulation of temperature-sensitive TRP channels. Semin Cell Dev Biol 2006;17:638-645. https://doi.org/10.1016/j.semcdb.2006.11.002 |
||||
| 13 Chiu IM, von Hehn CA, Woolf CJ: Neurogenic inflammation and the peripheral nervous system in host defense and immunopathology. Nat Neurosci 2012;15:1063-1067. https://doi.org/10.1038/nn.3144 |
||||
| 14 Basso L, Altier C: Transient receptor potential channels in neuropathic pain. Curr Opin Pharmacol 2017;32:9-15. https://doi.org/10.1016/j.coph.2016.10.002 |
||||
| 15 Vandewauw I, De Clercq K, Mulier M, Held K, Pinto S, Van Ranst N, Segal A, Voet T, Vennekens R, Zimmermann K, Vriens J, Voets T: A TRP channel trio mediates acute noxious heat sensing. Nature 2018;555:662-666. https://doi.org/10.1038/nature26137 |
||||
| 16 Bonnington JK, McNaughton PA: Signalling pathways involved in the sensitisation of mouse nociceptive neurones by nerve growth factor. J Physiol 2003;551:433-446. https://doi.org/10.1113/jphysiol.2003.039990 |
||||
| 17 Cholewinski A, Burgess GM, Bevan S: The role of calcium in capsaicin-induced desensitization in rat cultured dorsal root ganglion neurons. Neuroscience 1993;55:1015-1023. https://doi.org/10.1016/0306-4522(93)90315-7 |
||||
| 18 Koplas PA, Rosenberg RL, Oxford GS: The role of calcium in the desensitization of capsaicin responses in rat dorsal root ganglion neurons. J Neurosci 1997;17:3525-3537. https://doi.org/10.1523/JNEUROSCI.17-10-03525.1997 |
||||
| 19 Kim YS, Chu Y, Han L, Li M, Li Z, LaVinka PC, Sun S, Tang Z, Park K, Caterina MJ, Ren K, Dubner R, Wei F, Dong X: Central terminal sensitization of TRPV1 by descending serotonergic facilitation modulates chronic pain. Neuron 2014;81:873-887.
20 Arora V, Campbell JN, Chung MK: Fight fire with fire: Neurobiology of capsaicin-induced analgesia for chronic pain. Pharmacol Ther 2021;220:107743. https://doi.org/10.1016/j.pharmthera.2020.107743 |
||||
| 21 Uceyler N, Sommer C: High-dose capsaicin for the treatment of neuropathic pain: what we know and what we need to know. Pain Ther 2014;3:73-84. https://doi.org/10.1007/s40122-014-0027-1 |
||||
| 22 Schindelin J, Arganda-Carreras I, Frise E, Kaynig V, Longair M, Pietzsch T, Preibisch S, Rueden C, Saalfeld S, Schmid B, Tinevez JY, White DJ, Hartenstein V, Eliceiri K, Tomancak P, Cardona A: Fiji: an open-source platform for biological-image analysis. Nat Methods 2012;9:676-682. https://doi.org/10.1038/nmeth.2019 |
||||
| 23 Lawrence GW, Zurawski TH, Dolly JO: Ca2+ signalling induced by NGF identifies a subset of capsaicin-excitable neurons displaying enhanced chemo-nociception in dorsal root ganglion explants from adult pirt-GCaMP3 mouse. Int J Mol Sci 2021;22:2589. https://doi.org/10.3390/ijms22052589 |
||||
| 24 Tian Q, Hu J, Xie C, Mei K, Pham C, Mo X, Hepp R, Soares S, Nothias F, Wang Y, Liu Q, Cai F, Zhong B, Li D, Yao J: Recovery from tachyphylaxis of TRPV1 coincides with recycling to the surface membrane. Proc Natl Acad Sci U S A 2019;116:5170-5175. https://doi.org/10.1073/pnas.1819635116 |
||||
| 25 Kim YS, Anderson M, Park K, Zheng Q, Agarwal A, Gong C, Saijilafu, Young L, He S, LaVinka PC, Zhou F, Bergles D, Hanani M, Guan Y, Spray DC, Dong X: Coupled activation of primary sensory neurons contributes to chronic pain. Neuron 2016;91:1085-1096. https://doi.org/10.1016/j.neuron.2016.07.044 |
||||
| 26 Shu X, Mendell LM: Acute sensitization by NGF of the response of small-diameter sensory neurons to capsaicin. J Neurophysiol 2001;86:2931-2938. https://doi.org/10.1152/jn.2001.86.6.2931 |
||||
| 27 Blair NT, Bean BP: Role of tetrodotoxin-resistant Na+ current slow inactivation in adaptation of action potential firing in small-diameter dorsal root ganglion neurons. J Neurosci 2003;23:10338-10350. https://doi.org/10.1523/JNEUROSCI.23-32-10338.2003 |
||||
| 28 Camprubi-Robles M, Planells-Cases R, Ferrer-Montiel A: Differential contribution of SNARE-dependent exocytosis to inflammatory potentiation of TRPV1 in nociceptors. FASEB J 2009;23:3722-3733. https://doi.org/10.1096/fj.09-134346 |
||||
| 29 Zhang X, Huang J, McNaughton PA: NGF rapidly increases membrane expression of TRPV1 heat-gated ion channels. EMBO J 2005;24:4211-4223. https://doi.org/10.1038/sj.emboj.7600893 |
||||
| 30 Chung MK, Guler AD, Caterina MJ: TRPV1 shows dynamic ionic selectivity during agonist stimulation. Nat Neurosci 2008;11:555-564. https://doi.org/10.1038/nn.2102 |
||||
| 31 Kobayashi K, Fukuoka T, Obata K, Yamanaka H, Dai Y, Tokunaga A, Noguchi K: Distinct expression of TRPM8, TRPA1, and TRPV1 mRNAs in rat primary afferent neurons with adelta/c-fibers and colocalization with trk receptors. J Comp Neurol 2005;493:596-606. https://doi.org/10.1002/cne.20794 |
||||
| 32 Masuoka T, Kudo M, Yamashita Y, Yoshida J, Imaizumi N, Muramatsu I, Nishio M, Ishibashi T: TRPA1 channels modify TRPV1-mediated current responses in dorsal root ganglion neurons. Front Physiol 2017;8:272. https://doi.org/10.3389/fphys.2017.00272 |
||||
| 33 Rose T, Goltstein PM, Portugues R, Griesbeck O: Putting a finishing touch on GECIs. Front Mol Neurosci 2014;7:88. https://doi.org/10.3389/fnmol.2014.00088 |
||||
| 34 Emery EC, Luiz AP, Sikandar S, Magnusdottir R, Dong X, Wood JN: In vivo characterization of distinct modality-specific subsets of somatosensory neurons using GCaMP. Sci Adv 2016;2:e1600990. https://doi.org/10.1126/sciadv.1600990 |
||||
| 35 Fattori V, Hohmann MS, Rossaneis AC, Pinho-Ribeiro FA, Verri WA: Capsaicin: Current understanding of its mechanisms and therapy of pain and other pre-clinical and clinical uses. Molecules 2016;21:844. https://doi.org/10.3390/molecules21070844 |
||||
| 36 Jancso G, Kiraly E, Jancso-Gabor A: Pharmacologically induced selective degeneration of chemosensitive primary sensory neurones. Nature 1977;270:741-743. https://doi.org/10.1038/270741a0 |
||||
| 37 Gavva NR: Body-temperature maintenance as the predominant function of the vanilloid receptor TRPV1. Trends Pharmacol Sci 2008;29:550-557. https://doi.org/10.1016/j.tips.2008.08.003 |
||||
| 38 Yarmolinsky DA, Peng Y, Pogorzala LA, Rutlin M, Hoon MA, Zuker CS: Coding and plasticity in the mammalian thermosensory system. Neuron 2016;92:1079-1092. https://doi.org/10.1016/j.neuron.2016.10.021 |
||||
| 39 Khairatkar-Joshi N, Szallasi A: TRPV1 antagonists: the challenges for therapeutic targeting. Trends Mol Med 2009;15:14-22. https://doi.org/10.1016/j.molmed.2008.11.004 |
||||
| 40 Dawes JM, Andersson DA, Bennett DLH, Bevan S, McMahon SB (eds): Inflammatory mediators and modulators of pain, ed 6. Philadelphia, USA, Elsevier Saunders, 2013, pp 48-67. | ||||