×
![]()
Corresponding Author: Daisuke Kobayashi and Akihiro Hazama
Department of Cellular and Integrative Physiology, School of Medicine,
Fukushima Medical University, 1-Hikarigaoka, Fukushima, Fukushima 960-1295 (Japan)
Tel. +81-24-547-1128, Fax +81-24-547-1128, E-Mail coba@fmu.ac.jp
Tel. +81-24-547-1132, Fax +81-24-547-1132, E-Mail hazama@fmu.ac.jp
Cesium Treatment Depresses Glycolysis Pathway in HeLa Cell
Daisuke Kobayashi Natsumi Nishimura Akihiro Hazama
Department of Cellular and Integrative Physiology, School of Medicine, Fukushima Medical University, Fukushima, Japan
Introduction
Like potassium (K) and sodium (Na), cesium (Cs) is an alkali metal element. The bare ion radius of alkali metal elements increases in a molecular weight-dependent manner (e.g., 0.169 nm for Cs+ and 0.133 nm for K+); however, the hydrated radius of Cs+ has been determined to be the same as that of K+ (0.33 nm) [1]. Therefore, it was assumed that Cs+ was transported via K+ transporters. Human intake of Cs is usually via food crops grown on arable land. Cs levels in rice, wheat, and soybeans were reported to be 0.0003–0.065 mg/kg-dry weight [2, 3], approximately 0.1 mg/kg-dry weight [4], and 0.016–0.325 mg/kg-dry weight [5], respectively. It has been hypothesized that ingested Cs is distributed around the whole body. Upon administration to humans, Cs is distributed to the brain, liver, kidney, and blood [6–14]. The half-life of Cs in a human adult male is 50–150 days [15–18].
Cs has no known beneficial function in human that is verified by clinical research; furthermore, it causes toxicity in high doses [6–11]. Cesium chloride (CsCl) and cesium carbonate (Cs2CO3) have been used in clinical settings as alternative cancer therapy [10, 12–14], but their safety is yet to be assessed, and the efficacy of Cs in cancer therapy has never been demonstrated in controlled trials; however, relief of cancer-associated pain and rapid shrinkage of tumor masses have been reported [12, 13]. The Food and Drug Administration has added warnings to the labeling of CsCl [19]. The side effects of Cs include QT prolongation, hypokalemia, seizures, cardiac arrhythmia (Torsades de pointes), fainting, and cardiac
arrest [20]. However, it has been reported that some patients on Cs supplementation of different doses stay alive for 10–150 days [11, 14], and some others for up to 1 year [18]. High-dose Cs oral intake or injection seems to be associated with adverse effects [11]. Therefore, to use Cs as treatment in clinical settings, it is important that we clearly determine the biological effects of Cs on cells.
In general, mammalian cells take up sugar to produce energy via the glycolysis pathway. The expression pattern of several glycolytic enzymes has been determined to be vary between the normal and tumor cells. In mammals, hexokinase (HK) has been shown to exist in the following four isozymes: type I, type II, type III, and type IV [21, 22]. It has been shown that the brain and kidney mainly express type I HK, while the skeletal muscles express type II HK. Type II HK is often expressed in poorly differentiated and rapidly growing tumors, thus playing a pivotal role in facilitating the cell proliferation and survival of highly malignant tumor cells [23, 24]. In mammals, pyruvate kinase (PK) is expressed in four isoforms, namely, PKL, PKR, PKM1, and PKM2. PKL and PKR are expressed in the liver and red blood cells. PKM1 is expressed in most adult tissues, and PKM2 is a splice variant of the PKM gene and is expressed in tumor tissues and carcinoma cell lines. The PKM2 isoform is important for cancer metabolism and tumor growth [25, 26]. Lactate dehydrogenase (LDH) is a heterotetrameric enzyme consisting of two subunits, namely, subunit A and subunit B.
It is expressed in five different isoforms in mammals. Isoform LDH1 (rich in subunit B) is predominantly expressed in tissues that undergo aerobic metabolism, whereas isoform LDH5 (rich in subunit A) is predominantly expressed in tissues that undergo anaerobic metabolism. In aerobic environments (Air:CO2 = 95:5), isoform LDH3 and LDH4 are predominantly expressed even though all LDH isoforms are expressed in human cervical cancer HeLa cells [27]. When cell environments change from aerobic to anaerobic, isoform LDH1 expression and total LDH activity have been observed to decrease. Thus, glycolytic enzymes are highly involved in tumor cell proliferation and survival.
With regard to the effect of Cs on cultured cells, we previously reported that CsCl suppresses the proliferation of HeLa cells, murine embryonic fibroblast NIH/3T3 cells [28, 29]. When CsCl added to the extracellular space enters the intracellular space, intracellular Cs+ concentration will then increase and K+ concentration decrease. PK, which is one of the glycolytic enzymes, catalyzes the transfer of a phosphate group from phosphoenolpyruvate (PEP) to adenosine diphosphate (ADP), which in turn yields pyruvate and adenosine triphosphate (ATP) with K+ as a co-factor. Cs+ size is considered to comparable that of K+; therefore, increase in intracellular Cs+ level inhibits PK activity. We assume that by decreasing PK activity using Cs+ treatment, it will lead to the suppression of cell proliferation; however, whether Cs+ inhibits glycolysis pathway is yet to be established.
In this study, we examined the effect of Cs on glycolysis pathway through glycolytic enzyme expression and activity and glycolytic metabolite concentration. We then determined the step of the glycolysis affected by Cs.
Materials and Methods
Chemicals and enzymes
General chemical reagents were purchased from FUJIFILM Wako Pure Chemical Corporation (Osaka, Japan) and Sigma-Aldrich Japan K.K. (Tokyo, Japan). To measure the glycolytic enzyme activity, ATP, ADP, nicotinamide adenine dinucleotide reduced form (NADH), nicotinamide adenine dinucleotide phosphate (oxidized form, NADP+), hexokinase (HK), glucose-6-phosphate dehydrogenase (G6PDH), PK, and alcohol dehydrogenase (ADH) were obtained from Oriental Yeast. Co. Ltd. (Tokyo, Japan); lactose dehydrogenase (LDH) was purchased from Sigma; and PEP, D-3-phosphoglycerate (3-PGA), and 3-phosphoglycerate phosphokinase (PGK) were also obtained from Sigma. We then purchased 2-(4-Iodophenyl)-3-(4-nitrophenyl)-5-(2,4-disulfophenyl)-2H-tetrazolium, monosodium salt (WST-1), 1-methoxy-5-methylphenazinium methyl sulfate (1-Met-PMS), and N-ethyl-N-(2-hydroxy-3-sulfopropyl)-3-methylaniline sodium salt from Dojindo Laboratories (Kumamoto, Japan). Pyruvate oxidase (PYO) and peroxidase (POD) were obtained from Toyobo Co. Ltd. (Osaka, Japan).
Cell culture
HeLa cells were routinely cultured in Dulbecco’s modified Eagle medium (DMEM #044-29765; FUJIFILM Wako) supplemented with 10% fetal bovine serum (FBS) at 37 °C in a 5% CO2 humidified incubator. For all experiments, HeLa cells were plated in DMEM, incubated overnight, and incubated in DMEM supplemented with a specific concentration of CsCl. Cs treatment was performed 3 days incubation in all experiments.
Quantitative PCR
To compare the relative amounts of mRNA for glycolysis-related genes in HeLa cells treated with 10 mM CsCl, we performed semi-quantitative real-time polymerase chain reaction (qPCR). Total RNA was extracted from enzymatically detached HeLa cells using an RNeasy Plus Mini Kit (QIAGEN K. K., Tokyo, Japan), according to the manufacturer’s instructions. Reverse transcription (RT) was performed on 2 µg of total RNA, calculated from absorbance measured at 260 nm, using a ReverTra Ace qPCR RT Master Mix with gDNA Remover kit (Toyobo), according to the manufacturer’s instructions. Primer sequence was obtained from OriGene Technologies, Inc. (Rockville, USA), which was then synthesized at FASMAC Co. Ltd. (Kanagawa, Japan). qPCR using the ABI7300 real-time PCR system was performed according to the manufacturer’s instructions. RT samples (2–10 ng of total RNA) were amplified using a THUNDERBIRD SYBR qPCR Mix (Toyobo) to a final volume of 20 µL. The 28S ribosomal RNA (28S-RNA) was used as an internal control. The reaction conditions were as follows: 95 °C for 1 minute, followed by 40 cycles of 95 °C for 15 seconds and 60 °C for 1 minute. Relative amounts of each of mRNA levels were determined by normalization with the 28S-RNA expression level. The following primers were unique for the indicated gene: 28S-RNA ([U13369]) [30, 31] forward 5’-GTT CAC CCA CTA ATA GGG AAC GTG A-3’, reverse 5’-GAT TCT GAC TTA GAG GGT TCA GT-3’; hHK2 (referred to OriGene Technologies, Inc., Rockville, USA, HP200174) forward 5’-GAG TTT GAC CTG GAT GTG GTT GC-3’, reverse 5’-CCT CCA TGT AGC AGG CAT TGC T-3’; hGAPDH [32, 33] forward 5’-TCT CTG CTC CTC CTG TTC GAC-3’, reverse 5’-CAA ATG AGC CCC AGC CTT CTC-3’; hLDHA (OriGene, HP208683) forward 5’-GGA TCT CCA ACA TGG CAG CCT T-3’, reverse 5’-AGA CGG CTT TCT CCC TCT TGC T-3’; hLDHB (OriGene, HP206024) forward 5’-GGA CAA GTT GGT ATG GCG TGT G-3’, reverse 5’-AAG CTC CCA TGC TGC AGA TCC A-3’; hPKM2 (OriGene, HP206306) forward 5’-ATG GCT GAC ACA TTC CTG GAG C-3’, reverse 5’-CCT TCA ACG TCT CCA CTG ATC G-3’.
Preparation of crude extract and determination of protein concentration
Cultured HeLa cells were washed twice using phosphate-buffered saline without Ca2+ (PBS), detached from the cultivation dish using a scraper, and suspended in PBS. The cells were centrifuged at 160 × g for 5 minutes. The collected cells were suspended in PBS with protease inhibitor cocktail (Sigma; P8340); thereafter, the cells were disrupted using an ultrasonic processor (Vibra-CellTM VCX130; Sonics & Materials, Inc., Newtown, USA). The disruption step was performed at 4 °C, 10-second sonication and 50-second cooling intervals, and 60-second sonication in total. The disrupted cells suspension was then centrifuged at 15,000 × g for 20 minutes at 4 °C and the supernatant obtained was used as a crude extract in an enzyme assay. Protein concentration measurement in the crude extract was performed using Quick StartTM Bradford Dye Reagent (Bio-Rad Laboratories Inc., CA, USA), according to the manufacturer’s instruction. Bovine serum albumin (BSA) was then used as standard protein (Sigma).
Western blotting
Cultured HeLa cells were washed twice with PBS, detached from the cultivation dish using a scraper, and suspended in cell lysis buffer (9 M urea, 2 % Triton X-100, 1 % dithiothreitol, and 2 % sodium dodecyl sulfate [SDS]). The disruption step was performed at 4 °C, 10-second sonication and 50-second cooling intervals, finally 60-second sonication in total. The disrupted cells suspension was centrifuged at 15,000 × g for 10 minutes at 4 °C and the supernatant obtained was utilized as a total protein extract. Equal amounts (10 µg) of total protein per lane were separated using 10 % SDS-polyacrylamide gel electrophoresis and were later transferred to a polyvinylidene difluoride membrane. After blocking in PBS containing 3 % BSA, blots were incubated overnight with primary antibodies at a dilution of 1:1000 in the blocking solution. The primary antibodies were obtained from R&D Systems (Minneapolis, USA), whereas HK (MAB8179), PKM2 (MAB72441), LDHA (MAB9158), LDHB (MAB9205), and GAPDH (ab9485) were obtained from Abcam (Tokyo, Japan). After incubation with primary antibody solution, the membrane was washed in PBS, and incubation with anti-rabbit (#7074) and anti-mouse (#7076) horseradish peroxidase-linked secondary antibody (Cell Signaling Technology Japan, K.K., Tokyo, Japan) at a dilution of 1:2000 in blocking solution was performed for 1 hour. After washing the membrane in PBS, detection was performed using Pierce ECL Western Blotting Substrate (Thermo Fisher Scientific K.K., Kanagawa, Japan). Densitometric quantification was performed using Image LabTM (Bio-Rad Laboratories, Hercules, California, USA).
Glycolytic enzyme assay
The activity of each glycolytic enzyme in a crude extract of HeLa cells was measured using spectrophotometric assay. Hexokinase (HK) activity was measured based on NADPH production from glucose coupling with G6PDH at 25 °C. The standard assay cuvette contained 100 mM potassium phosphate (pH 7.4), 10 mM MgCl2, 20 mM D-glucose, 1 mM ATP, 0.2 mM NADP+, G6PDH (6 units), and HK from a crude extract of HeLa cells in a final volume of 1 mL. The reaction was initiated by adding D-glucose, and NADPH production was monitored at 340 nm. Meanwhile, glyceraldehyde-3-phosphate dehydrogenase (GAPDH) activity was measured based on a decrease in NADH production from 3-PGA coupling with PGK at 25 °C. The standard assay cuvette contained 100 mM potassium phosphate (pH 7.4), 10 mM MgCl2, 5 mM ATP, 0.2 mM NADH, 1 mM dithiothreitol, 3 mM 3-PGA, PGK (5 units), and GAPDH from a crude extract of HeLa cells in a final volume of 1 mL. The reaction was initiated by adding 3-PGA, and decrease in NADH was monitored at 340 nm. LDH activity was measured based on decrease in NADH at 25 °C. The standard assay cuvette has been determined to contain 100 mM potassium phosphate (pH 7.4), 20 mM pyruvate, 0.2 mM NADH, and LDH from a crude extract of HeLa cells in a final volume of 1 mL. The reaction was initiated by adding pyruvate, and NADH decrease was monitored at 340 nm. PK activity was measured based on decrease in NADH coupling with LDH at 25 °C [28]. The standard assay cuvette contained 100 mM potassium phosphate (pH 7.4), 10 mM MgCl2, 2 mM ADP, 2 mM PEP, 0.2 mM NADH, LDH (5 units), and PK from a crude extract of HeLa cells in a final volume of 1 mL. The reaction was initiated by adding ADP, and NADH decrease was monitored at 340 nm. For all enzymes, 1 unit of activity was represented as an absorbance change of 6.22 mM−1 cm−1 per minute at 340 nm.
Determination of intracellular metabolites
Pyruvate determination was performed by POD/PYO coupling assay using 96-well plates. The standard assay well contained 80 mM potassium phosphate buffer (pH 5.8), 0.5 mM 4-aminoantipyrine, 0.01 mM flavin adenine dinucleotide, 0.2 mM thiamine pyrophosphate, 0.6 mM N-ethyl-N-(2-hydroxy-3-sulfopropyl)-3-methylaniline, 2 mM ethylenediamine tetraacetic acid disodium salt, 10 mM MgSO4, 5-unit POD, 2.4-unit PYO, and pyruvate from a crude extract of HeLa cells in a final volume of 0.3 mL. The reaction mixture was then incubated at 25 °C for 30–60 minutes and pyruvate-dependent coloring was monitored at 550 nm. Lactate determination was performed using LDH coupling method with 96-well plate. The standard assay well contained 10 mM N-2-hydroxyethylpiperazine-N-2 ethane sulfonic acid (HEPES) buffer (pH 8.0), 0.4 mM NAD+, 22-unit LDH, chromogenic substrate (WST-1/1-Met-PMS), and lactate from a crude extract of HeLa cells in a final volume of 0.15 mL. The reaction mixture was incubated at 25 °C for 30–60 minutes, and lactate-dependent coloring was monitored at 450 nm. NAD+ and NADH determination was performed using ADH coupling method with 96-well plates. To determine NAD+ and NADH, cultured cells were suspended into PBS, equal amounts of extraction solution (100 mM Na carbonate, 20 mM Na bicarbonate, 0.05% Triton X-100) were added, and the obtained crude extract was centrifugated at 5,000 × g using Centricut W-10 (Kurabo Industries Ltd., Osaka, Japan). The flow-through fraction was used as the total NAD+/NADH fraction. An adequate amount of the fraction was heated at 60 °C for 30 minutes in order to decompose NAD+, and the NADH fraction was then obtained. The standard assay well contained each fraction (total NAD+/NADH and NADH fractions) and equal amounts of the assay solution (0.2 M Tris [pH 8.0], 2 M ethanol, 3-unit ADH, and chromogenic substrate) in a final volume of 0.1 mL. The reaction mixture was incubated at 25 °C for 30–60 minutes, and NADH-dependent coloring was monitored at 450 nm. The amount of NAD+ was calculated from the amounts of total NAD+/NADH fraction and NADH fraction using the following equation: NAD+ = total NAD+/NADH – NADH.
Results
Transcriptional levels of glycolysis-related genes
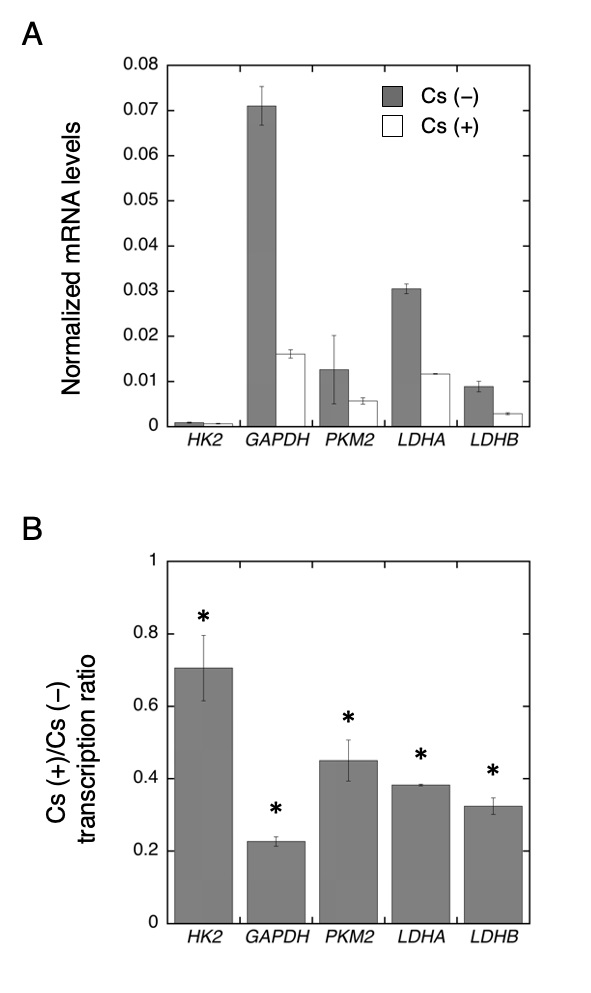
In our previous study [28], Cs has been found to suppress HeLa cell proliferation in a dose-dependent manner and Cs inhibited PK activity in crude extracts. Based on these findings, we hypothesized that Cs treatment may affect glycolysis pathway in HeLa cells. To test this assumption, we performed an analysis of the transcriptional levels of glycolysis-related genes, such as HK2, GAPDH, PKM2, LDHA, and LDHB. The transcriptional levels of these genes were then compared between Cs-treated cells and control cells, wherein transcriptional levels were found to be significantly lower in Cs-treated cells than that in the control cells (Fig. 1). The relative transcriptional levels of HK2, GAPDH, PKM2, LDHA, and LDHB in the Cs-treated cells were 70.6 ± 9.0 %, 22.7 ± 1.3 %, 45.0 ± 5.7 %, 38.3 ± 0.2 %, and 32.4 ± 2.3 %, respectively (n = 4). LDH as a heterotetramer is composed of four subunits. It was previously reported that LDH3 (A2B2) and LDH4 (A3B1) are the major LDH isoforms in HeLa cells and that culturing condition can affect the LDH composition [27]. As has been shown in Fig. 1, the transcriptional level of LDHA was higher than that of LDHB, and this is consistent with the results of the previous study [27]. However, the transcription levels of LDHA and LDHB in the Cs-treated cells were found to decrease; hence, Cs treatment did not affect LDH composition but decreased LDH transcription.
Expression levels and activities of glycolytic enzymes
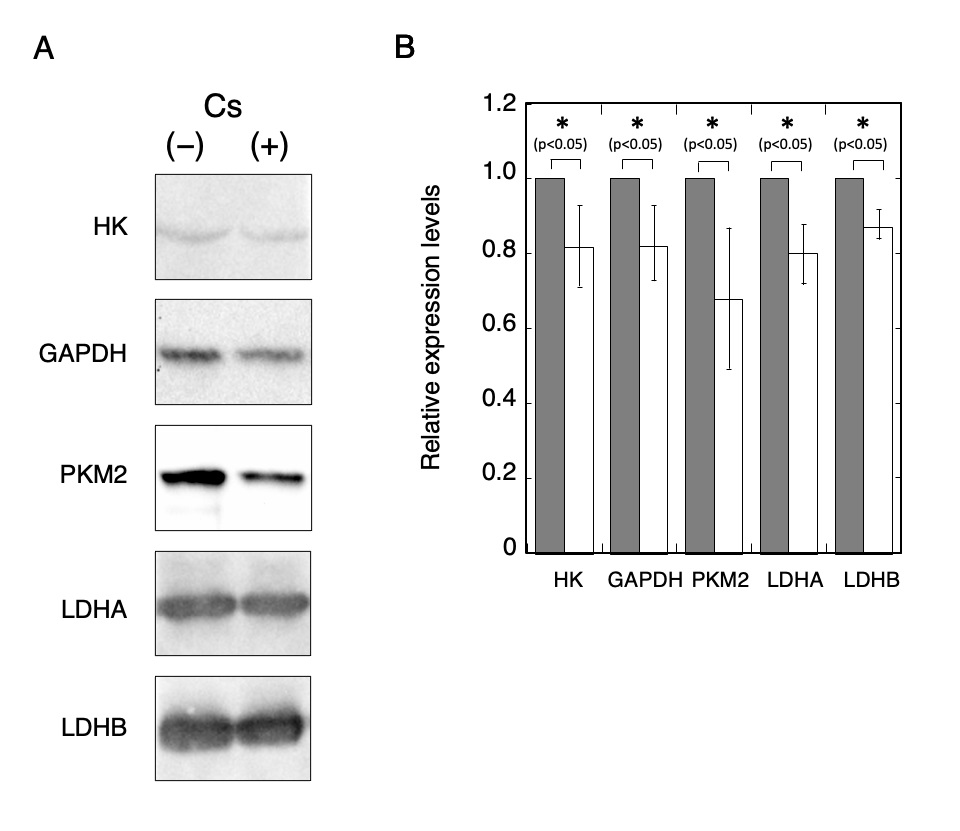
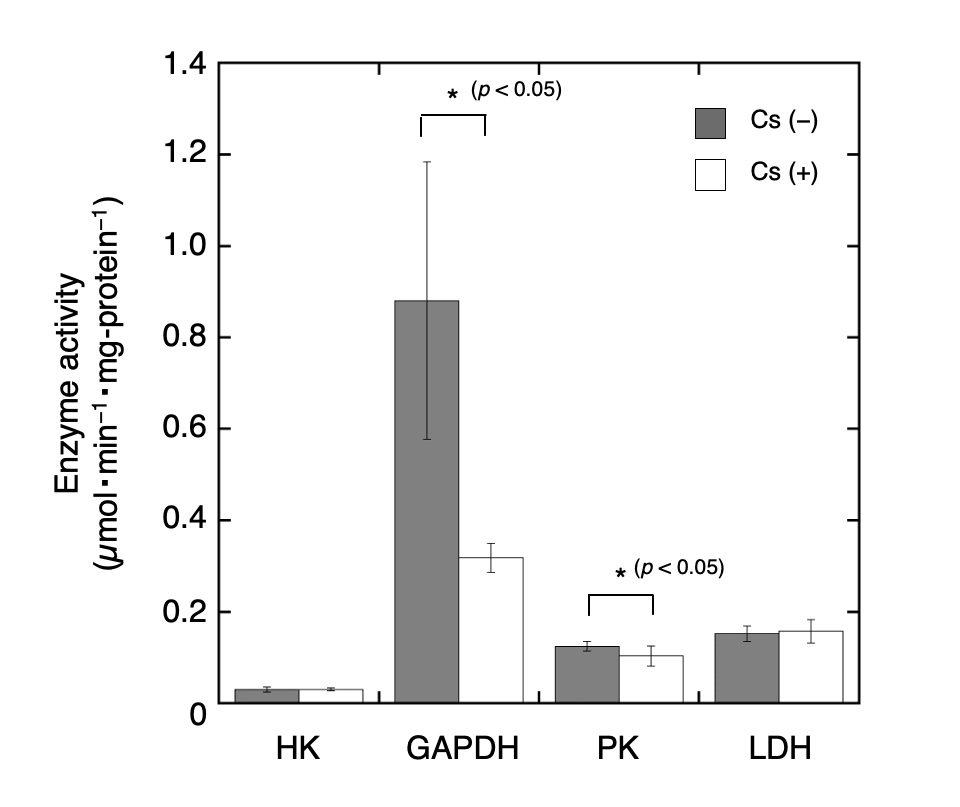
The expression levels of glycolysis-related proteins including HK, GAPDH, PKM2, LDHA, and LDHB were evaluated using Western blot analysis (Fig. 2). The relative expression levels of HK, GADH, PKM2, LDHA, and LDHB in Cs-treated cells were 0.82 ± 0.11, 0.83 ± 0.10, 0.68 ± 0.19, 0.80 ± 0.08, and 0.88 ± 0.04, respectively (n = 3). Compared to the control cells, all the protein expression levels in the Cs-treated cells have been observed to decrease significantly (t-test, p < 0.05). Although the transcriptional level of LDHA was higher than that of LDHB as shown in Fig. 1, the detected signal intensities of LDHB appeared to be stronger than that of LDHA as shown in Fig. 2A. This disparity may be attributed to the antibody reactivity against each target protein. Enzyme activities in crude extracts of cells with and without Cs treatment were then measured (Fig. 3). HK activity in the Cs-treated cells and control cells was 0.03 ± 0.01 µmol NADPH/min/mg-protein and 0.03 ± 0.003 µmol NADPH/min/mg-protein, respectively (n = 4). Similarly, GAPDH activity in the Cs-treated cells and the control cells was 0.88 ± 0.30 µmol NADH/min/mg-protein and 0.32 ± 0.05 µmol NADH/min/mg-protein, respectively (n = 4); PK activity in the Cs-treated cells and control cells was 0.12 ± 0.01 µmol NADH/min/mg-protein and 0.10 ± 0.02 µmol NADH/min/mg-protein, respectively (n = 4); and LDH activity in the Cs-treated cells and control cells was 0.15 ± 0.02 µmol NADH/min/mg-protein and 0.16 ± 0.02 µmol NADH/min/mg-protein, respectively (n = 4). The relative activities of HK, GAPDH, PK, and LDH in the Cs-treated cells were 1.02 times, 0.36 times, 0.83 times, and 1.03 times the corresponding values in the control cells, respectively. GAPDH and PK activities in the Cs-treated cells decreased significantly compared to that in the control cells (t-test, p < 0.05), and the activities of the other enzymes in the Cs-treated cells were not significantly different from those in the control cells.
Glycolytic metabolites
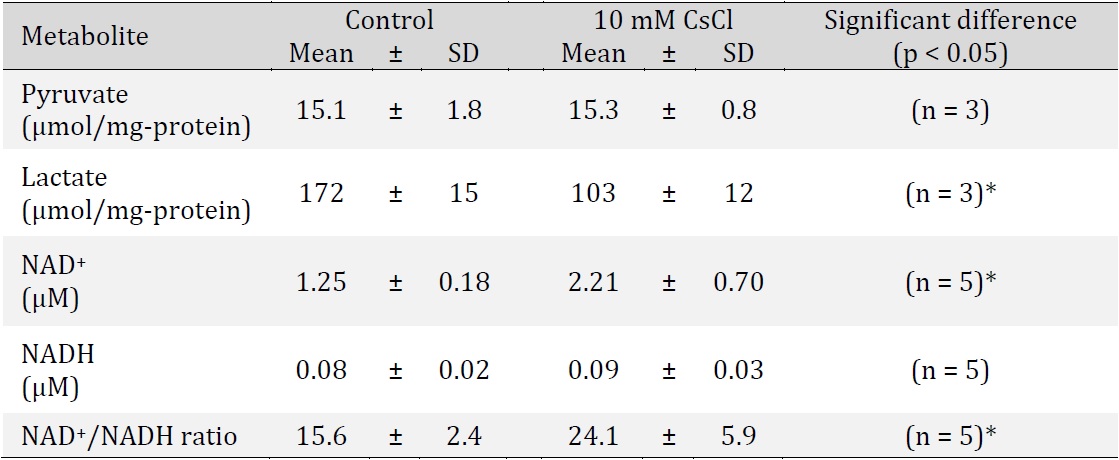
In the aerobic glycolysis pathway in tumor cells, PK produces pyruvate and ATP from PEP and ADP; subsequently, the pyruvate and NADH generated by GAPDH reaction are utilized in order to produce lactate and NAD+ by LDH reaction. Moreover, in tumor cells, the concentrations of pyruvate, lactate, NADH, and NAD+ and the ratio of lactate to pyruvate ([lactate]/[pyruvate]) and the ratio of NAD+ to NADH ([NAD+]/[NADH]) have been identified to play a role in cell proliferation. PK activity was found to decrease in Cs-treated cells (Fig. 3); therefore, we assumed that pyruvate concentration decreased in the Cs-treated cells. To confirm the concentration of intracellular metabolites in Cs-treated and control cells, pyruvate, lactate, NAD+, and NADH levels were measured (Table 1). Metabolite concentrations were compared between Cs-treated cells and control cells. No statistically significant difference was determined in pyruvate levels between Cs-treated cells and control cells, but lactate level in Cs-treated cells decreased significantly (0.6 times that in control cells). Similarly, there were no statistically significant differences in NADH levels between Cs-treated cells and control cells, but NAD+ level in Cs-treated cells increased significantly (1.8 times that in control cells). Further, the [lactate]/[pyruvate] ratio of the Cs-treated cells and control cells was 6.7 and 11.4, respectively; then, the [NAD+]/[NADH] ratio of each was 24.1 and 15.6, respectively (Table 1). The [NAD+]/[NADH] ratio of Cs-treated cells was found to be 1.5 times higher than that of control cells.
Supplement test for cell growth
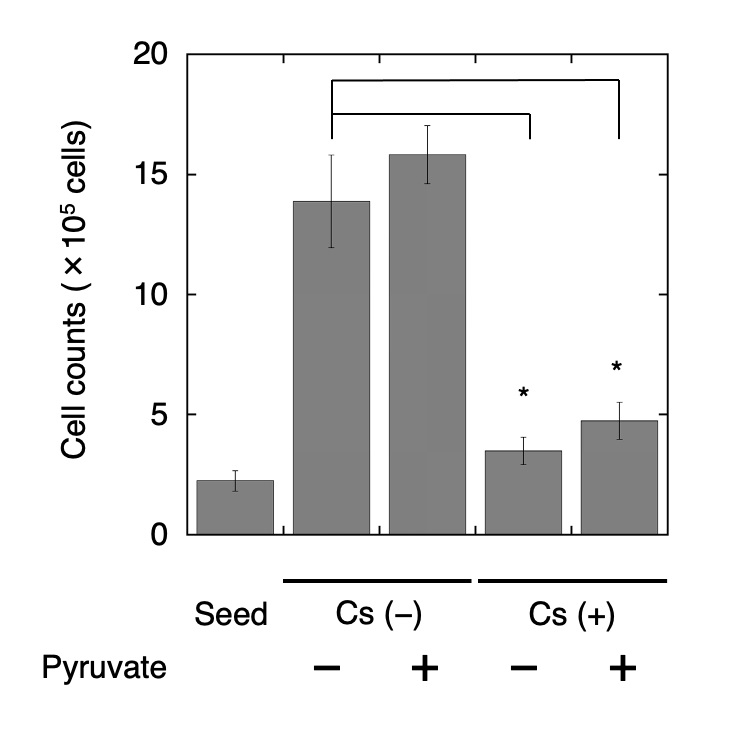
Pyruvate has been identified as an intermediate metabolite of the glycolysis pathway; thus, its addition to culture medium provides energy and a carbon source for anabolic processes, which may recover HeLa cell growth that was suppressed by Cs treatment. Therefore, we assessed cell growth by cell counting following the addition of Cs and pyruvate. Pyruvate had a slightly positive effect on cell growth, and there were no statistically significant differences in cell growth between Cs-treated cells and control cells (Fig. 4). It was found that supplementary pyruvate did not recover HeLa cell growth that was suppressed by Cs treatment.
The authors would like to thank Enago (www.enago.jp) for the English language review.
Author Contributions
DK and AH conceived and designed the study, interpreted the results of the experiments, edited and revised the manuscript, and approved the final version of the manuscript. DK and NN performed the experiments and analyzed the data. DK prepared the figures and drafted the manuscript.
Funding
This work was supported by JSPS KAKENHI Grant Number 26460299.
Statement of Ethics
The authors have no ethical conflicts to disclose.
The authors have no conflicts of interest to declare.
| 1 Israelachvili JN: Interactions involving polar molecules, in Israelachvili JN (ed): Intermolecular and surface forces. Revised 3rd edition. Academic Press, Elsevier Inc, 2011, pp 71-90. https://doi.org/10.1016/B978-0-12-391927-4.10004-0 |
||||
| 2 Tsukada H, Hasegawa H, Hisamatsu S, Yamasaki S: Transfer of 137Cs and stable Cs from paddy soil to polished rice in Aomori, Japan. J Environ Radioactiv 2002;59:351-363. https://doi.org/10.1016/S0265-931X(01)00083-2 |
||||
| 3 Ohmori Y, Inui Y, Kajikawa M, Nakata A, Sotta N, Kasai K, Uraguchi S, Tanaka N, Nishida S, Hasegawa T, Sakamoto T, Kawara Y, Aizawa K, Fujita H, Li K, Sawaki N, Oda K, Futagoishi R, Tsusaka T, Takahashi S, et al.: Difference in cesium accumulation among rice cultivars grown in the paddy field in Fukushima Prefecture in 2011 and 2012. J Plant Res 2014;127:57-66. https://doi.org/10.1007/s10265-013-0616-9 |
||||
| 4 Kubo K, Kobayashi H, Nitta M, Takenaka S, Nasuda S, Fujimura S, Takagi K, Nagata O, Ota T, Shinano T: Variations in radioactive cesium accumulation in wheat germplasm from fields affected by the 2011 Fukushima nuclear power plant accident. Sci Rep 2020;10:3744. https://doi.org/10.1038/s41598-020-60716-w |
||||
| 5 Takagi K, Kaga A, Ishimoto M, Hajika M, Matsunaga T: Diversity of seed cesium accumulation in soybean mini-core collections. Breed Sci 2015;65:372-380. https://doi.org/10.1270/jsbbs.65.372 |
||||
| 6 Khangure SR, Williams ES, Welman CJ: CT brain findings in a patient with elevated brain cesium levels. Neuroradiol J 2013;26:607-609. https://doi.org/10.1177/197140091302600602 |
||||
| 7 Neulieb R: Effect of oral intake of cesium chloride: a single case report. Pharmacol Biochem Behav 1984;21:15-16. https://doi.org/10.1016/0091-3057(84)90155-2 |
||||
| 8 Saliba W, Erdogan O, Niebauer M: Polymorphic ventricular tachycardia in a woman taking cesium chloride. Pacing Clin Electrophysiol 2001;24:515-517. https://doi.org/10.1046/j.1460-9592.2001.00515.x |
||||
| 9 Vyas H, Johnson K, Houlihan R, Bauer BA, Ackerman MJ: Acquired long QT syndrome secondary to cesium chloride supplement. J Althrn Complement Med 2006;12:1011-1014. https://doi.org/10.1089/acm.2006.12.1011 |
||||
| 10 Melnikov P, Zanoni LZ: Clinical effects of cesium intake. Biol Trace Elem Res 2010;135:1-9. https://doi.org/10.1007/s12011-009-8486-7 |
||||
| 11 Sessions D, Heard K, Kosnett M: Fatal cesium chloride toxicity after alternative cancer treatment. J Altern Complement Med 2013;19:973-975. https://doi.org/10.1089/acm.2012.0745 |
||||
| 12 Brewer AK: The high pH therapy for cancer tests on mice and humans. Pharmacol Biochem Behav 1984;21:1-5. https://doi.org/10.1016/0091-3057(84)90152-7 |
||||
| 13 Sartori HE: Cesium therapy in cancer patients. Pharmacol Biochem Behav 1984;21:11-13. https://doi.org/10.1016/0091-3057(84)90154-0 |
||||
| 14 Young F, Bolt J: Torsades de pointes - a report of a case induced by caesium taken as a complementary medicine, and the literature review. J Clin Pharm Ther 2013;38:254-257. https://doi.org/10.1111/jcpt.12053 |
||||
| 15 ICRP: Age-dependent doses to members of the public from intake of radionuclides. Ann ICRP 1989;20:53-58. https://doi.org/10.1016/0146-6453(89)90015-8 |
||||
| 16 Rundo J, Newton D: Some recent measurement of caesium-137 and zirconium-95 in human beings. Nature 1962;195:851-854. https://doi.org/10.1038/195851a0 |
||||
| 17 Rundo J, Mason JI, Nweton D, Taylor BT: Biological half-life of caesium in man in acute and chronic exposure. Nature 1963;200:188-189. https://doi.org/10.1038/200188a0 |
||||
| 18 Mathew W, Wendy G, Daisy B, Mattman A, Mock T, Brown R: Cesium chloride-induced torsades de pointes. Can J Cardiol 2009;25:e329-e331. https://doi.org/10.1016/S0828-282X(09)70147-3 |
||||
| 19 U.S. Food and Drug Administration [Internet]: FDA alerts health care professionals of significant safety risks associated with cesium chloride [cited 2018 Jul 23]. URL: https://www.fda.gov/Drugs/GuidanceComplianceRegulatoryInformation/PharmacyCompounding/ucm614211.htm | ||||
| 20 Aschenbrenner DS: Cesium chloride, used as alternative cancer therapy, poses risk. Am J Nurs 2018;118:20. https://doi.org/10.1097/01.NAJ.0000547658.63306.d8 |
||||
| 21 Middleton RJ: Hexokinases and glucokinases. Biochem Soc Trans 1990;18:180-183. https://doi.org/10.1042/bst0180180 |
||||
| 22 Wilson JE: Hexokinase. Rev Physiol Biochem Pharmacol 1995;126:65-198. | ||||
| 23 Pedersen PL, Mathupala S, Rempel A, Geschwind JF, Ko YH: Mitochondrial bound type II hexokinase: a key player in the growth and survival of many cancers and an ideal prospect for therapeutic intervention. Biochem Biophys Acta 2002;1555:14-20. https://doi.org/10.1016/S0005-2728(02)00248-7 |
||||
| 24 Pastrino JG, Hoek JB: Hexokinase II: The integration of energy metabolism and control of apoptosis. Curr Med Chem 2003;10:1535-1551. https://doi.org/10.2174/0929867033457269 |
||||
| 25 Christofk HR, Vander Heiden MG, Harris MH, Ramanathan A, Gerszten RE, Wei R, Fleming MD, Schreiber SL, Cantley LC: The M2 splice isoform of pyruvate kinase is important for cancer metabolism and tumor growth. Nature 2008;452:230-233. https://doi.org/10.1038/nature06734 |
||||
| 26 Christofk HR, Vander Heiden MG, Wu N, Asara JM, Cantley LC: Pyruvate kinase M2 is a phosphotyrosine-binding protein. Nature 2008;452:181-186. https://doi.org/10.1038/nature06667 |
||||
| 27 Cribbs RM, Kline ES: The effect of environment on lactate dehydrogenase isozymes of cultured somatic cells. J Cell Physiol 1971;78:59-64. https://doi.org/10.1002/jcp.1040780109 |
||||
| 28 Kobayashi D, Kakinouchi K, Nagae T, Nagai T, Shimura K, Hazama A: Cesium reversibly suppressed HeLa cell proliferation by inhibiting cellular metabolism. FEBS Lett 2017;591:718-727. https://doi.org/10.1002/1873-3468.12579 |
||||
| 29 Ziasmin K, Nishimura N, Kobayashi D, Hazama A: Cesium suppresses fibroblast proliferation and migration. Fukushima J Med Sci 2020;66:97-102. https://doi.org/10.5387/fms.2020-08 |
||||
| 30 Gilles C, Polette M, Coraux C, Tournier JM, Meneguzzi G, Munaut C, Volders L, Rousselle P, Birembaut P, Foidart JM: Contribution of MT1-MMP and of human laminin-5 γ2 chain degradation to mammary epithelial cell migration. J Cell Sci 2001;114:2967-2976. https://doi.org/10.1242/jcs.114.16.2967 |
||||
| 31 Piette C, Deprez M, Roger T, Noël A, Foidart JM, Munaut C: The dexamethasone-induced inhibition of proliferation, migration, and invasion in glioma cell lines is antagonized by macrophage migration inhibitory factor (MIF) and can be enhanced by specific MIF inhibitors. J Biol Chem 2009;284:32483-32492. https://doi.org/10.1074/jbc.M109.014589 |
||||
| 32 Espada-Murao LA, Morita K: Delayed cytosolic exposure of Japanese encephalitis virus double-stranded RNA impedes interferon activation and enhances viral dissemination in porcine cells. J Virol 2011;85:6736-6749. https://doi.org/10.1128/JVI.00233-11 |
||||
| 33 Duan YL, Ye HQ, Zavala AG, Yang CQ, Miao LF, Fu BS, Seo KS, Davrinche C, Luo MH, Fortunato EA: Maintenance of Large Numbers of Virus Genomes in Human Cytomegalovirus-Infected T98G Glioblastoma Cells. J Virol 2014;88:3861-3873. https://doi.org/10.1128/JVI.01166-13 |
||||
| 34 Shiratori R, Furuichi K, Yamaguchi M, Miyazaki N, Aoki H, Chibana H, Ito K, Aoki S: Glycolytic suppression dramatically changes the intracellular metabolic profile of multiple cancer cell lines in a mitochondrial metabolism-dependent manner. Sci Rep 2019;9:18699. https://doi.org/10.1038/s41598-019-55296-3 |
||||
| 35 Pajak B, Siwiak E, Soltyka M, Priebe A, Zielinsk R, Fokt I, Ziemniak M, Jaśkiewicz A, Borowski R, Domoradzki T, Priebe W: 2-Deoxy-D-glucose and its analogs: From diagnostic to therapeutic agents. Int J Mol Sci 2019;21:234. https://doi.org/10.3390/ijms21010234 |
||||
| 36 Christensen CE, Karlsson M, Winther JR, Jensen PR, Lerche MH: Non-invasive in-cell determination of free cytosolic [NAD+]/[NADH] ratios using hyperpolarized glucose show large variations in metabolic phenotypes. J Biol Chem 2014;289:2344-2352. https://doi.org/10.1074/jbc.M113.498626 |
||||
| 37 Fantin CR, St-Pierre J, Leder P: Attenuation of LDH-A expression uncovers a link between glycolysis, mitochondrial physiology, and tumor maintenance. Cancer Cell 2006;9:425-434. https://doi.org/10.1016/j.ccr.2006.04.023 |
||||
| 38 Le A, Cooper CR, Gouw M, Dinavahi R Maitra A, Deck LM: Inhibition of lactate dehydrogenase A induces oxidative stress and inhibits tumor progression. Pro Natl Sci Acad USA 2010;107:2037-2042. https://doi.org/10.1073/pnas.0914433107 |
||||