Corresponding Author: Leyi Gu

Department of Nephrology, Renji Hospital, School of Medicine, Shanghai Jiao Tong University, 160 Pujian Road, Shanghai (China)
E-Mail guleyi@aliyun.com


Erratum

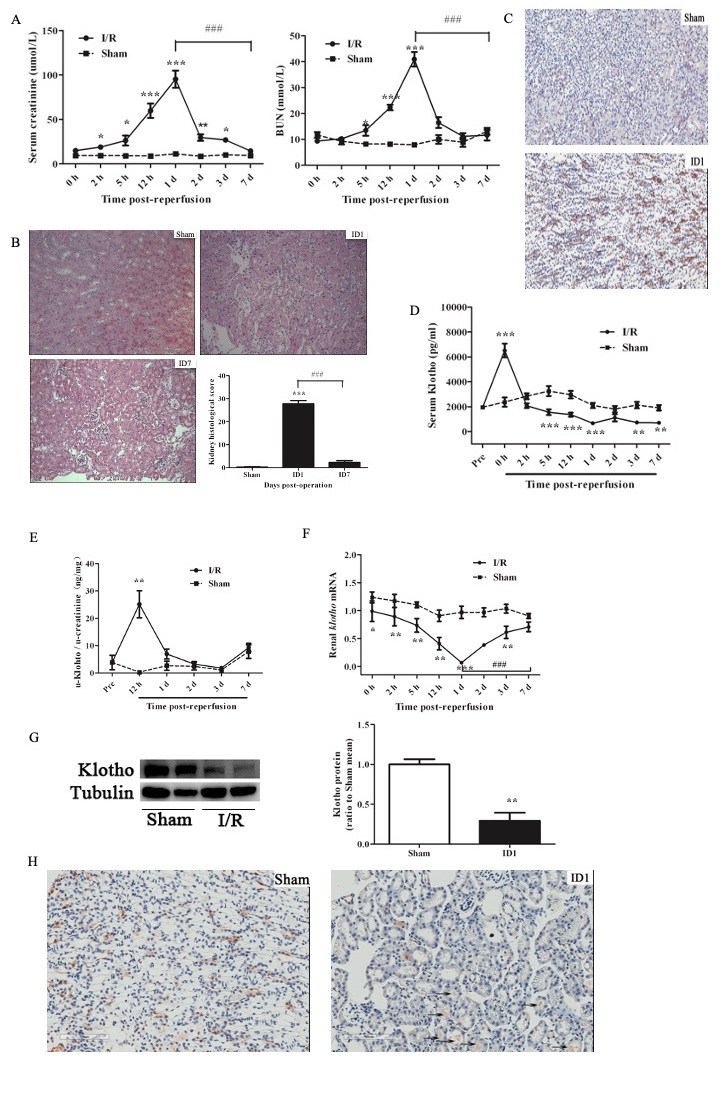
In the article by Qian, et al., entitled “Klotho Reduces Necroptosis by Targeting Oxidative Stress Involved in Renal Ischemic-Reperfusion Injury” [Cell Physiol Biochem 2018;45(6):2268-2282, DOI: 10.1159/000488172], following publication the authors have found that due to carelessness for ID7 in Fig. 1B a picture has been used, which has already been published in another paper by 
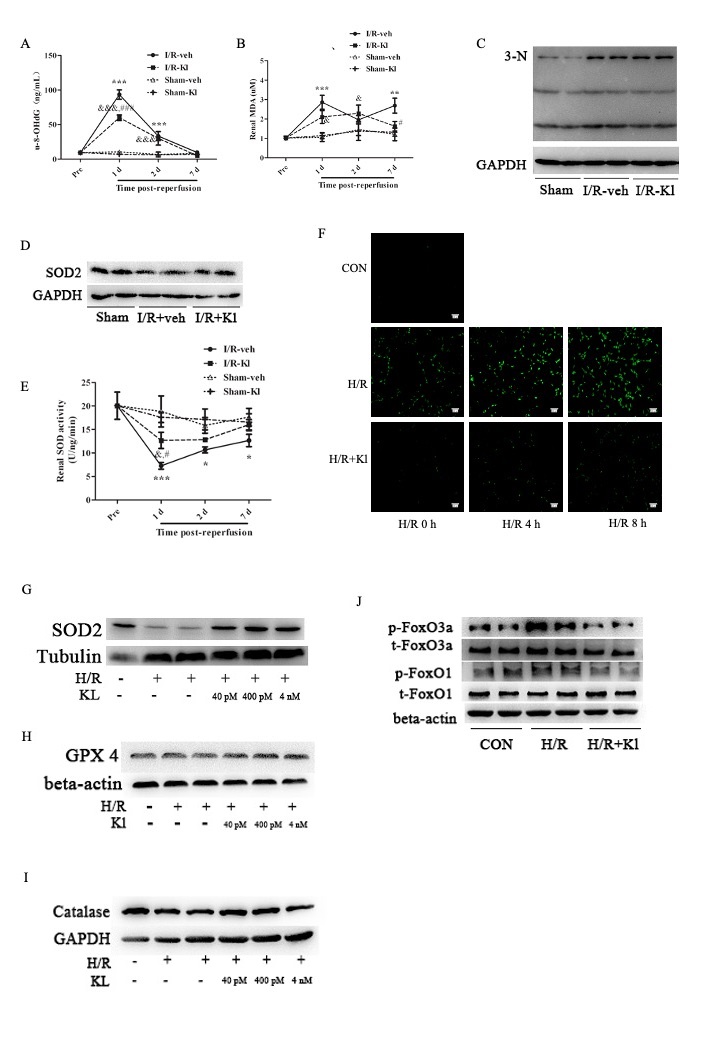
the same research team, and that the image for t-FoxO3a in Fig. 6J had been horizontally flipped. The corrected Fig. 1 and Fig. 6 are displayed below. Additionally, the authors would like to correct the legend for Fig. 1: “(n = 5)” should be corrected as “(n = 4)”. The following Fig. 1 is therefore displayed with the corrected figure legend.

Fig. 1. Klotho levels are decreased in the serum and kidney but increased in the urine after IRI. Mice were divided into IRI and sham groups and sacrificed at 0 h to 7 days post-reperfusion. (A) Scr and BUN concentrations. (B) Representative kidney sections stained with HE (×200) and its semiquantification to represent renal tubular damage on day 1 and day 7 post-reperfusion. (C) Representative immunohistochemistry (×200) for Kim-1 protein in the kidneys on day 1 postreperfusion. (D) Serum Klotho concentrations at pre-surgery and 0 h to 7 days after reperfusion. (E) Urinary Klotho concentrations at pre-surgery and 12 h to 7 days after reperfusion. Data are corrected by urinary creatinine. (F) Klotho transcripts in the kidneys. Representative (G) immunoblot and (H) immunohistochemistry (×200) for Klotho protein in the kidneys on day 1 post-reperfusion and summary of the western blot data (n = 4). Bars represent the mean ± SEM (n = 4 per group). *p<0.05, **p<0.01, and ***p<0.001 vs. sham group. ###p<0.001 between AKI mice on day 1 and day 7 post-IRI. Arrows indicate labeled Klotho protein in the tubular lumen.

Fig. 6. Klotho inhibits the oxidative stress implicated in renal IRI. AKI and sham mice with or without Klotho treatment were sacrificed pre-operatively and 1, 2, and 7 days after reperfusion. (A) Urinary 8-OHdG concentrations. (B) Renal MDA levels. Representative immunoblot for (C) 3-nitrotyrosine and (D) SOD2 proteins in the kidneys on day 1. (E) Total SOD activity in the kidneys. (F) TCMK-1 cells were exposed to 24 h hypoxia followed by reoxygenation for 0, 4, and 8 h in the presence or absence of Klotho protein at 4 nM. ROS formation (×400) was detected by DCFH-DA staining. (G and H) TCMK-1 cells were subjected to 24 h hypoxia/8 h reoxygenation. Representative immunoblot for (G) SOD2, (H) GPX4, (I) catalase, and (J) FoxO-1 and FoxO3a protein. Bars represent the mean ± SEM (n = 5 per group). *p<0.05, **p<0.01, and ***p<0.001 vs. sham-veh group; &p<0.05 and &&&p<0.001 vs. sham-Kl group; #p<0.05 and ###p<0.001 vs. IRI-veh mice.