Corresponding Author: Zhenhua Dai

Section of Immunology, Guangdong Provincial Academy of Chinese Medical Sciences 55 Nei Huan Xi Lu Guangzhou, Guangdong 510006 (China)
E-Mail daizhenhua@gzucm.edu.cn


Erratum

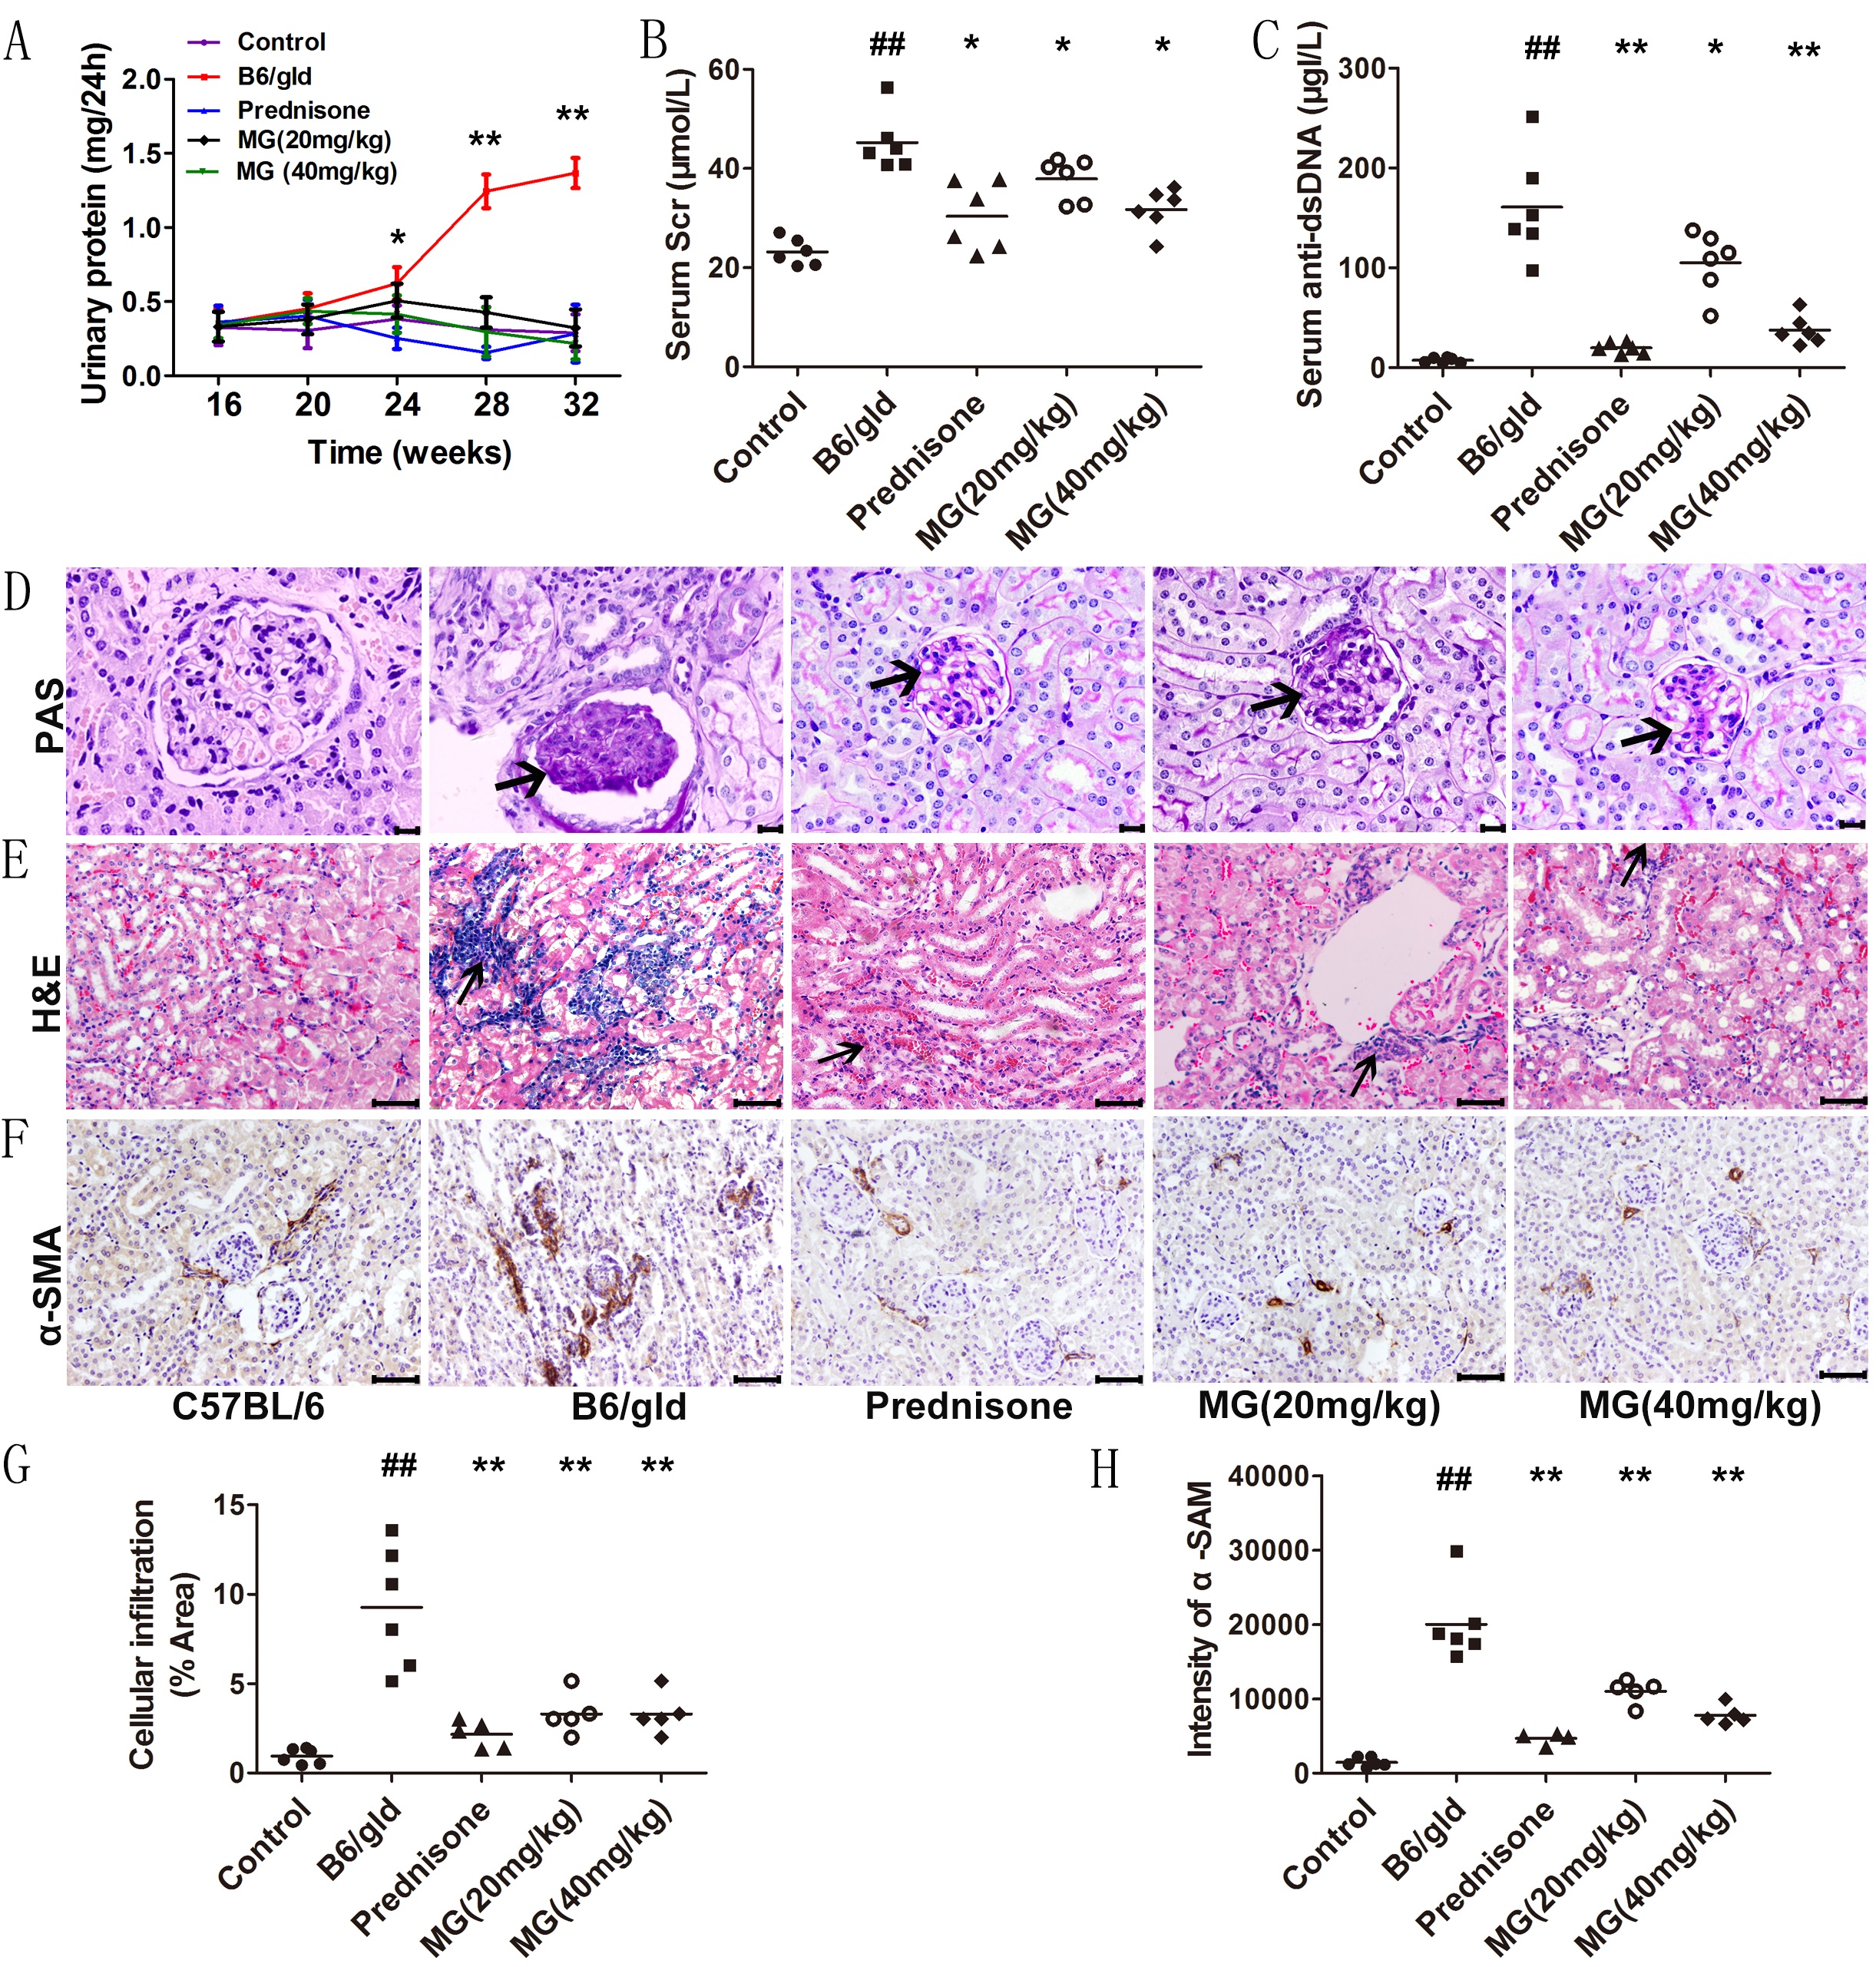
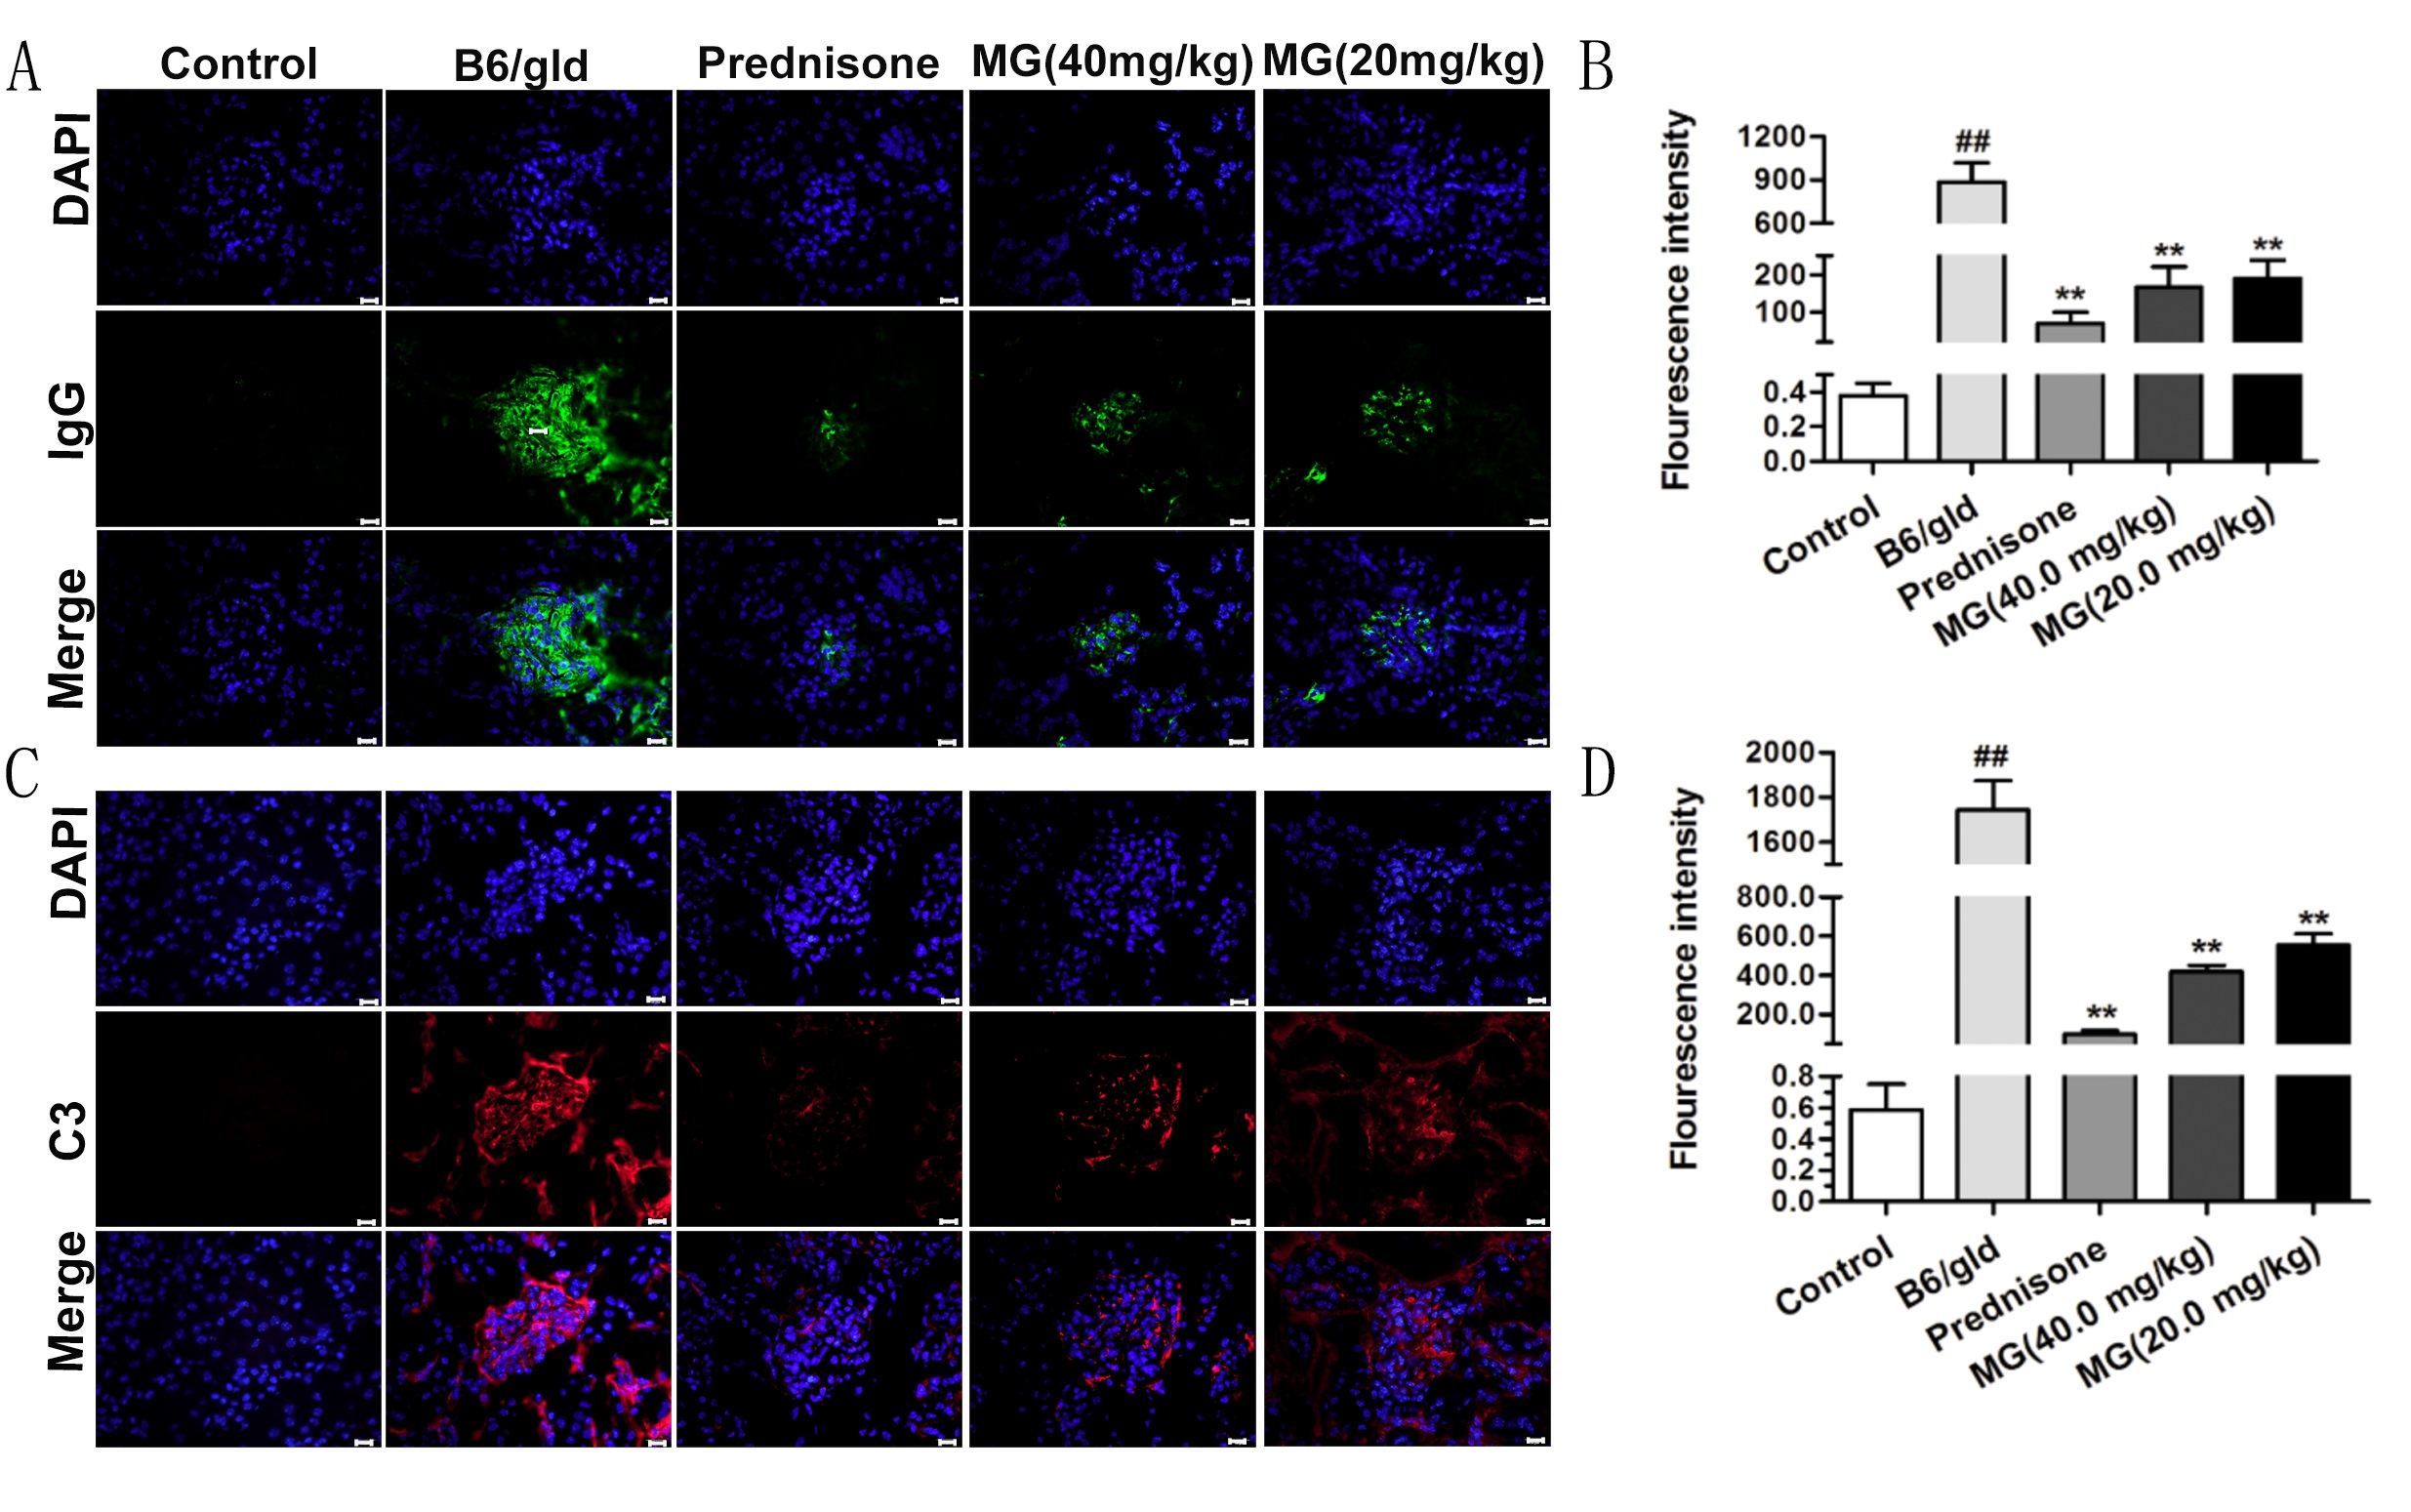
In the article “Mangiferin Attenuates Murine Lupus Nephritis by Inducing CD4+Foxp3+ Regulatory T Cells via Suppression of mTOR Signaling” [Cell Physiol Biochem 2018;50:1560- 1573; DOI: 10.1159/000494654] by Liang et al., the authors themselves discovered that the incorrect representative images for Figure 1E: Prednisone group and Figure 2C: C3-MG20mg/kg & DAPI-MG40mg/kg+20mg/kg were included. The errors were introduced inadvertently during assembling the multi-panel figures. The authors have verified the original data and confirm the accuracy of the findings. They sincerely apologize for this mistake.

The correct Figure 1 and Figure 2 are shown below.

Fig. 1. Mangiferin (MG) treatment improves renal function and immunopathology and reduces serum autoantibody level in B6/gld mice. 24h-urine samples were collected every four weeks from B6/gld mice starting at the age of 16 weeks and the effects of MG on kinetics of 24h-urinary protein were observed (A). At the 32th week, all animals were sacrificed to measure serum creatinine (Scr) (B) and serum antidsDNA levels (C) in B6/gld mice. Data are presented as individual points with Means (n=6 mice/group). (D) PAS staining of the kidneys demonstrated the cystic glomeruli (arrowhead) with marked dilatation of Bowman’s capsule and abnormal thickening of the glomerular basement membrane (arrows) in B6/gld mice (magnification: 400X). (E&G) H&E staining of the kidneys in B6/gld mice (n=5-6 mice/group) (magnification: 200X) and the percentage of the area with cellular infiltration. The percentage of the area with cellular infiltrates was measured using 20-24 Image J software. (F&H) IHC staining of α-SMA in the kidney and its intensity (n=5- 6 mice/group, magnification: 200X). Shown above is one representative of three separate experiments (##p<0.01 compared with control, and *p<0.05 or **p<0.01 for all treated groups vs. B6/gld).

Fig. 2. MG treatment reduces the deposition of IgG and C3 in B6/gld mice. Immunofluorescence staining for total IgG (A) and complement C3 (C) in the glomeruli of B6/gld mice at age of 32 weeks were performed (n=4 mice/group). The immunological staining in C57/B6 mice is normal. In B6/gld mice, obvious granular deposition of IgG and C3 in glomerular capillary loops was observed under high magnifications. But MG or prednisone treatment significantly reduced IgG and C3 depositions. Quantitative analyses of IgG (B) or C3 (D) deposition were performed using 20-24 Image J, collected from four mice per group, Data are presented as Mean ± SD (##p<0.01 compared with control and **p<0.01 compared with B6/gld).