×
![]()
Corresponding Author: Ruan Pimenta
Medical Investigation Laboratory (LIM55), Urology Department, University of São Paulo Medical School (FMUSP),
Av. Dr. Arnaldo 455, 2° floor, room 2145 - Cerqueira César, São Paulo 01246-903, SP (Brazil)
Tel. +55 11 30617183, E-Mail ruanpimenta22@gmail.com
Cholesterol Triggers Nuclear Co-Association of Androgen Receptor, p160 Steroid Coactivators, and p300/CBP-Associated Factor Leading to Androgenic Axis Transactivation in Castration-Resistant Prostate Cancer
Ruan Pimentaa,b
Juliana A. Camargoa
Patrícia Candidoa
Vitória Ghazariana
Guilherme L. Gonçalvesc
Vanessa R. Guimarãesa
Poliana Romãoa
Caroline Chiovattoa,d
Carolina M. Mioshia,e
Gabriel A. dos Santosa,b
Iran A. Silvaa
Alexander Birbrairf,g,h
Miguel Srougia,b
William C. Nahasi
Kátia R. Leitea
Nayara I. Vianaa,j
Sabrina T. Reisa
aLaboratorio de Investigação Médica 55 (LIM55), Hospital das Clinicas HCFMUSP, Faculdade de Medicina, Universidade de São Paulo, São Paulo, Brazil, bInstituto D’OR de Pesquisa e Ensino, São Paulo, Brazil, cLaboratory of Renal Physiology, Department of Physiology and Biophysics, Institute of Biomedical Sciences, University of São Paulo, São Paulo, Brazil, dCentro Universitário São Camilo, São Paulo, Brazil, eUniversidade Federal do ABC, Santo André, Brazil, fDepartment of Pathology, Federal University of Minas Gerais, Belo Horizonte, Brazil, gDepartment of Dermatology, University of Wisconsin-Madison, Madison, WI, USA, hDepartment of Radiology, Columbia University Medical Center, New York, NY, USA, iUro-Oncology Group, Urology Department, University of São Paulo Medical School and Institute of Cancer Estate of São Paulo (ICESP), São Paulo, Brazil, jUniversidade do Estado de Minas Gerais - UEMG, Passos, Brazil
Introduction
Castration-resistant prostate cancer (CRPC) is the most lethal form of Prostate Cancer (PCa) and is characterized by patients who are resistant to androgen-blocking therapies [1]. In these cases, the resistant cells acquire the potential to synthesize testosterone from cholesterol molecules, stimulating cell proliferation and survival [2]. The escape mechanisms behind CRPC have been attributed to the positive regulation of a complex heterogeneous network of anti-apoptotic and survival genes [3] and growth factors [1, 4]. Indeed, two hypotheses have been proposed to explain these observations. The first involves aberrant Androgen Receptor (AR) activation through common downstream pathways or the positive regulation of AR coactivators in the absence of androgens [5]. The second relies on androgen-regulated pathways in PCa cells by alternative sources of steroidal androgens [6].
Given the fact that AR plays a fundamental role in PCa [7] and that steroid receptor activity is potentiated by a wide range of coactivators [8], it has been proposed that these molecules may also play a role in PCa [9]. The coactivators of the p160 family include SRC-1, SRC-2, and SRC-3 [10], and previous work has shown that these proteins mediate transcriptional functions between nuclear receptors and other transcription factors [11]. Moreover, the overexpression of p160 in PCa has been correlated with increased cell proliferation [12], migration [13], metastatic potential, decreased apoptosis rates and up-regulation of de novo lipogenesis [14].
The p300/CBP (PCAF) exhibits histone acetyltransferase activity and is considered an AR coactivator. The expression of this gene has been correlated with an unfavorable PCa prognosis [15-17]. Additionally, PCAF acetylates AR, leading to DHT-induced transcription. Notably, it has been proposed that increasing AR coactivator gene and/or protein expression could result in promiscuous AR activation even by low-affinity AR ligands [18, 19].
Interestingly, compelling evidence has shown that several cancers, including PCa, overexpress lipogenic enzymes [20]. This observation is particularly relevant to cancer progression since prostatic lipogenesis has been observed in both the early neoplastic and invasive stages [21]. AR dysregulation, resulting from mutations and cross-interactions with active signaling pathways in malignant cells, influences CRPC progression. The biological underpinnings behind the upregulation of lipogenic proteins in PCa and the related mechanisms of how AR coactivators and co-repressors are involved in the onset and progression of this neoplasm are still poorly understood. Therefore, the present study aimed to demonstrate that cholesterol modulates the expression of genes that participate in AR co-activation in cellular and animal CRPC models.
Materials and Methods
Supplementation of PC-3 cells with cholesterol
The PC-3 cell was seeded in 12-well culture plates at 2×10⁵ cells/well and grown in MEM medium (Invitrogen, Grand Island, NY, USA) using standard culture methods. The cell line was authenticated by Short Tandem Repeat (STR) (Supplementary Fig. 1 – for all supplementary material see www.cellphysiolbiochem.com). The cells were supplemented with 2 μg/mL (5µM) cholesterol (C4951-30MG, Sigma Aldrich, St. Louis, MO, USA) for eight hours, according to Moon et al. [22], with modifications. Untreated cells served as the control group.
RNA extraction and quantitative real-time polymerase chain reaction
According to the manufacturer’s instructions, cellular RNAs were extracted using the mirVana kit (Ambion, Austin, TX, USA). The total RNA was then synthesized using the High-Capacity cDNA Reverse Transcription Kit for complementary DNA (cDNA) synthesis (Applied Biosystems, CA, USA). The target gene sequences were amplified in a 10 µL reaction mixture containing 5 µL of TaqMan Universal PCR Master Mix and 0.5 µL of TaqMan gene expression (Supplementary Table 1). Data were analyzed using the DataAssist Software (Applied Biosystems, USA). All qPCR reactions were performed in duplicate. GAPDH was used as the endogenous control in the gene expression analysis.
Viability, apoptosis, and cell cycle analyses by flow cytometry
Flow cytometry experiments were performed on a Muse Cell Analyzer (Merck Millipore, Burlington, MA, USA). The assays were performed by supplementing PC-3 cells with cholesterol for 24 hours. After 24 hours, the cells were labeled with the Muse Count & Viability (MCH100102), Muse Annexin V & Cell Death (MCH100105), and Muse Cellular Cycle (MCH100105) kits according to the manufacturer’s recommendations.
Cell migration assay
PC-3 cells were transferred to 24-well plates with 5×10⁴ cells/well; after reaching confluence, a wound was made (risk). The cells were washed, and MEM medium without FBS was added to each well. The plates were photographed at 0, 8, 24, 48 and 72h. Images were analyzed with the NIS Elements D 3.1 software (Nikon). Percent wound closure was calculated based on the risk area at 0, 8, 24, 48 and 72h.
Immunofluorescence in vitro
Cells were cultured on glass coverslips and supplemented with cholesterol (2 µg for 8 hours) to evaluate co-activating and co-repressor protein expression. The cells were then fixed with 4% paraformaldehyde in 1X PBS for 10 minutes and permeabilized with 0.1% Triton X-100 in 1X PBS for five more minutes. Coverslips were incubated with the primary antibodies of the proteins SRC-1, SRC-2, SRC-3, PCAF and AR (Supplementary Table 2) diluted 1:100 in normal horse serum (2.5%) for 12h, followed by the secondary antibody diluted for one hour (VectaFluor™ Duet Immunofluorescence Double Labeling Kit, DyLight® 488 Anti-Rabbit (green), DyLight® 594 Anti-Mouse (red)). Coverslips were washed three times in 1X PBS after each antibody incubation. Where indicated, coverslips were counterstained with DAPI (Cell Signaling), washed three times with 1X PBS, and mounted using ProLong Diamond (Invitrogen). Cells were photographed using a fluorescence microscope (Eclipse 80i, Nikon, Tokyo, Japan) attached to a photographic camera. ImageJ software quantified the fluorescence signal and reported it as fluorescence intensity (arbitrary units).
In vivo study
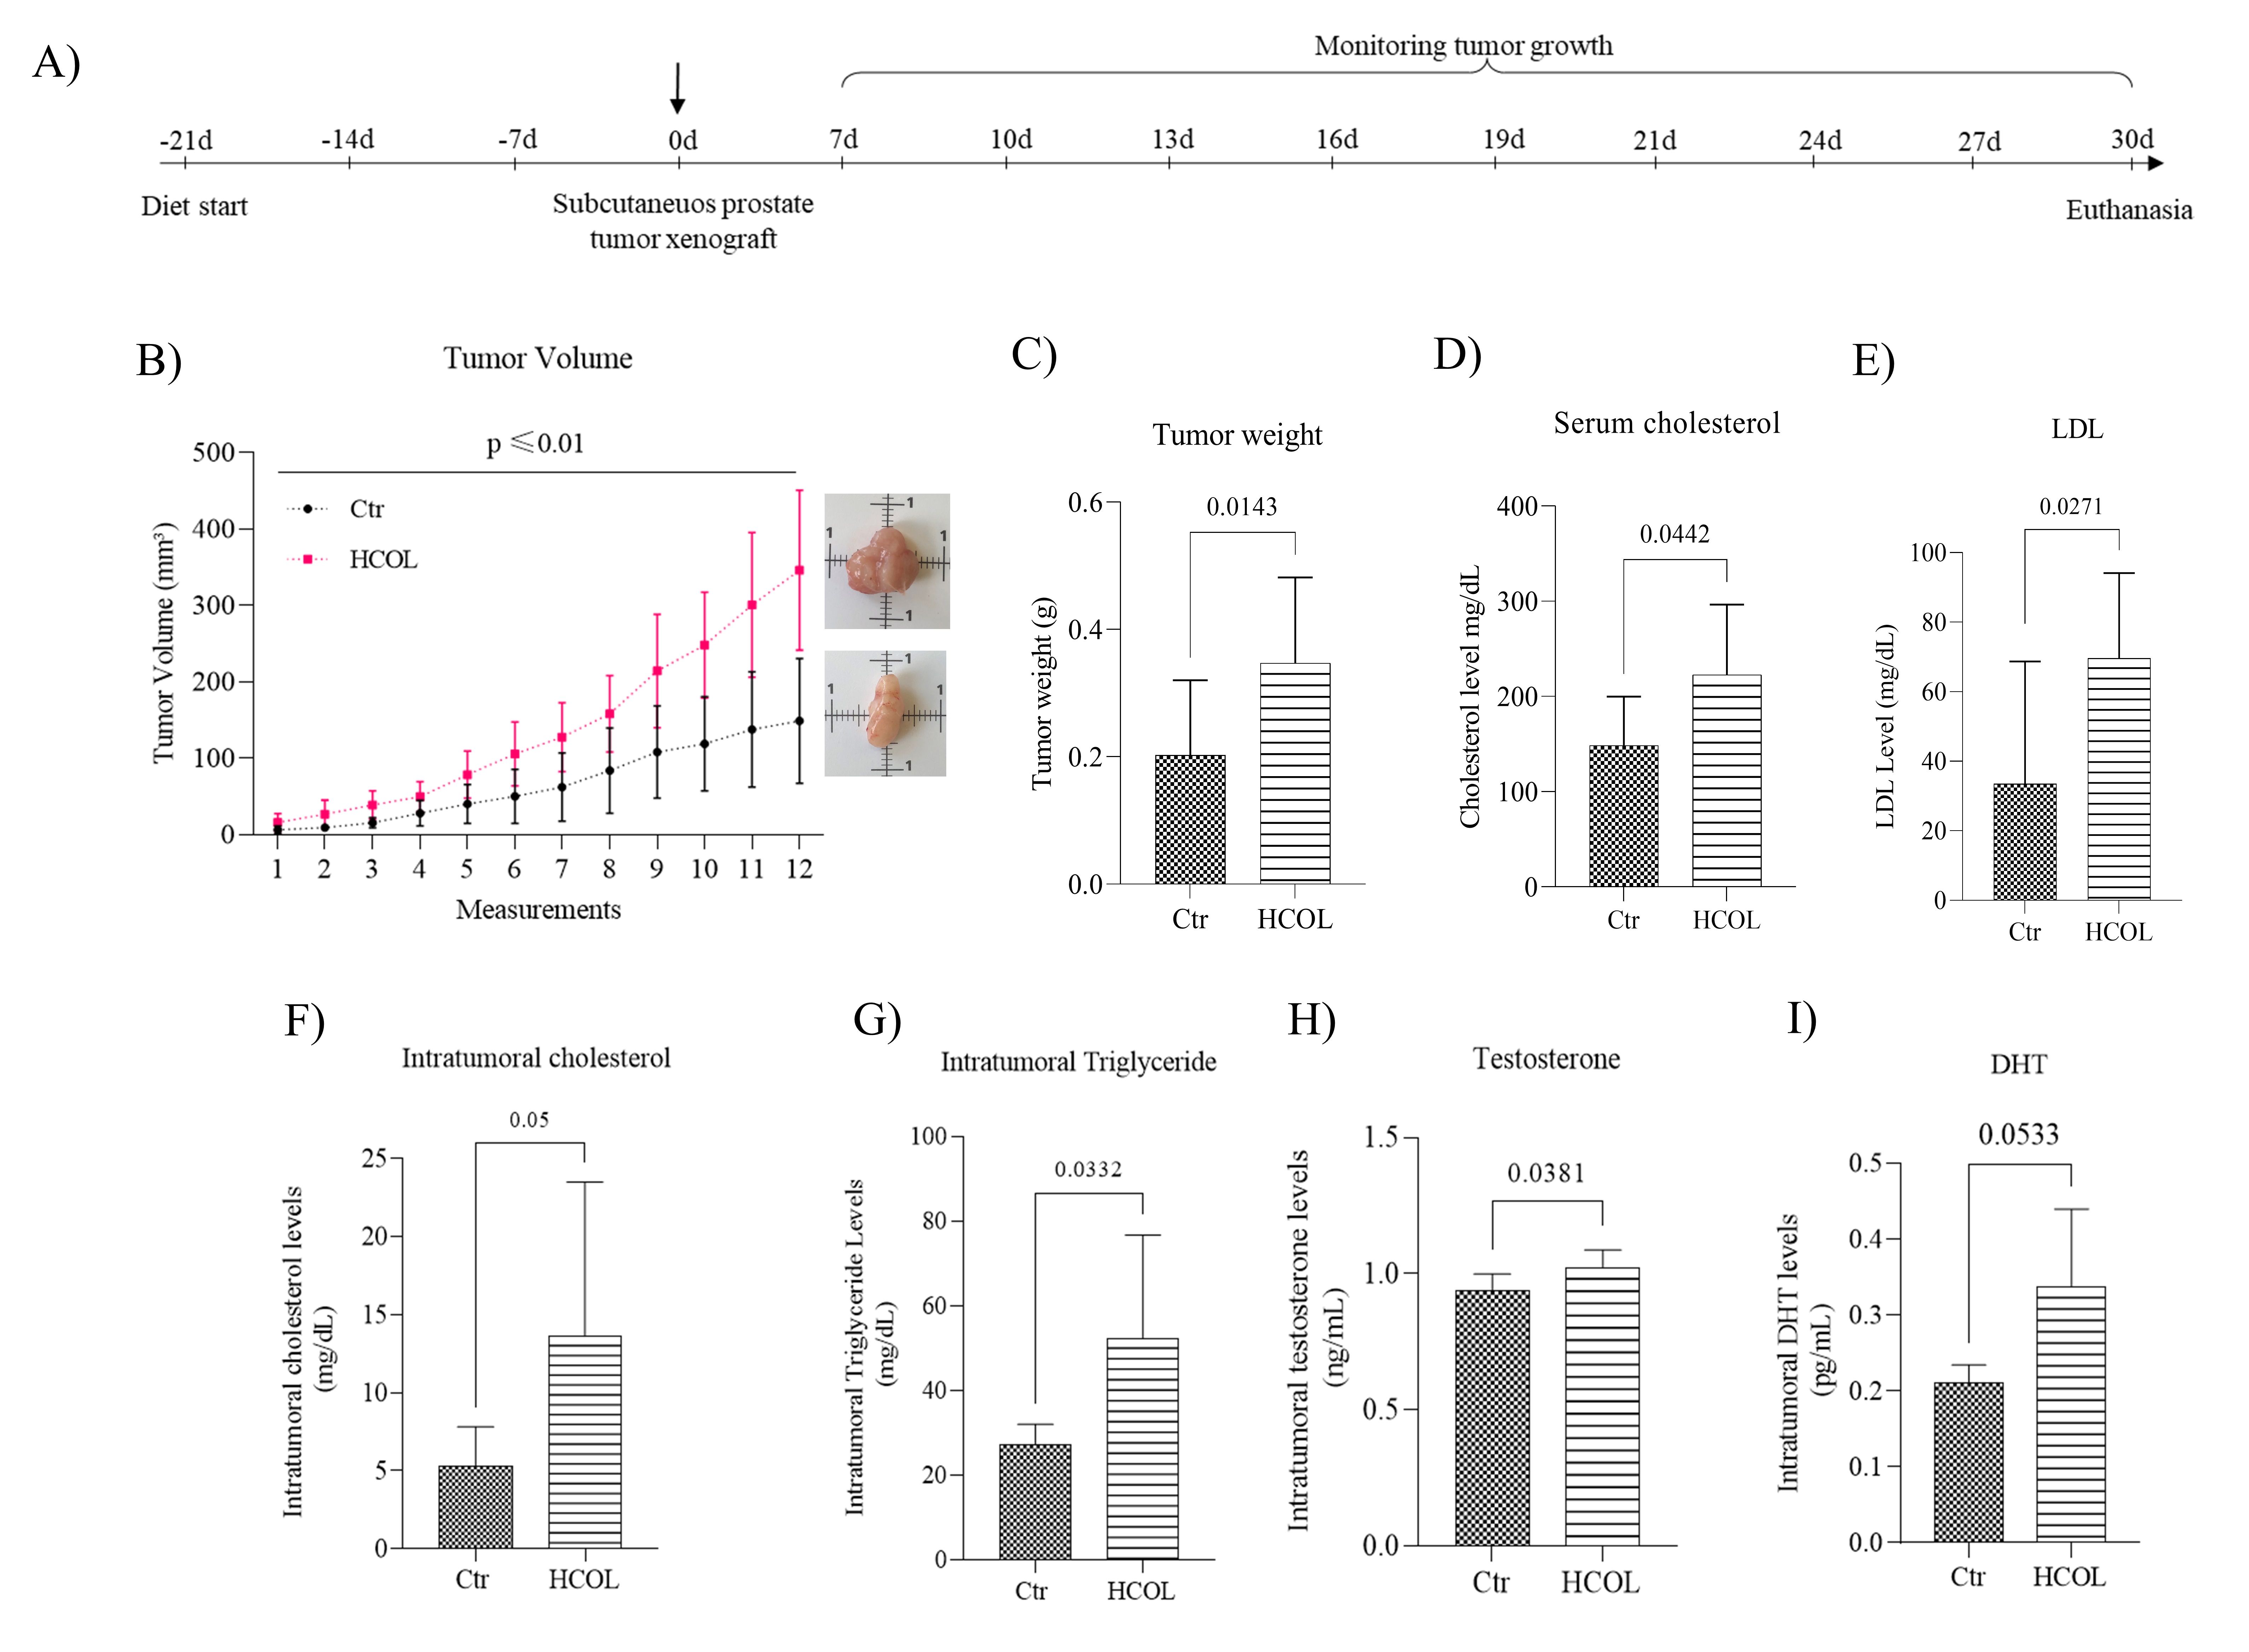
The in vivo portion of this study was approved by our institution’s Ethics and Animal Research Committee (Protocol #1119/2018). The Bioterio Central - FMUSP (São Paulo, SP, Brazil) provided 22 NOD/SCID mice. At the age of four to five weeks, male mice were relocated and maintained in laminar flow cabinets under specific pathogen-free conditions, at 20–21°C and 50–60% humidity and a 12h light and 12h dark cycle. The animals’ food and water were sterilized before being consumed. Cages were entirely changed once or twice a week. All animal manipulations were performed under sterile conditions. The animals were divided into hypercholesterolemic (HCOL) and control (Ctr). The HCOL group was fed a high-calorie diet (RH19539E) (1.5% cholesterol) (N = 11), and the control group was fed a standard diet (RH19522) (N = 11). Twenty-one days after starting the diet, mice were placed under isoflurane anesthesia, and 1.5×10⁶ PC-3 cells (in a final volume of 100 µL of medium) were injected into the subcutaneous tissue. The mice continued to consume their respective diets until the time of euthanasia, 24 days after injecting the cells. The tumors were palpable between 7 and 14 days after the PC-3 cell inoculation. Tumor volumes and weights were measured every two days until the end of the experimental period. Tumors were palpable, and the length (L) and width (W) were measured with a digital caliper. The tumor volume (V) was calculated every two days using the following formula: V = [W × L × (W + L) / 2)] × 0.52 [23].
Lipid Profile
Both groups’ serum cholesterol, LDL, HDL, and triglyceride levels were measured using Labtest kits (Labtest Diagnostica, Minas Gerais, BR). The same kit was used to measure intratumoral cholesterol levels in tissue homogenates. The absorbance of the samples was recorded in a SpectraMax 340PC384 microplate reader (Molecular Devices, USA) following the manufacturer’s recommendations.
Western Blotting
Tumor tissues were homogenized in ice-cold RIPA buffer enriched with a protease and phosphatase inhibitor cocktail (Merck). The samples were mixed with Laemmli buffer and DTT and heated at 95ºC for 5 minutes in a Thermomixer Confort (Thermo Fisher). Aliquots corresponding to 20 μg of total protein were resolved by SDS-PAGE using 4%-15% gels (Mini-Protean TGX, BioRad) and then transferred to PVDF membranes (Thermo Fisher). Standard western blotting techniques were used to detect SRC-1, SRC-2, SRC-3, PCAF, AR, and GAPDH. The primary antibodies were diluted at 1:500, and the secondary antibody (Goat Anti-Rabbit IgG, (H+L) HRP conjugate, Merck Millipore AP307P) was applied at 1:5000. The band intensities were quantified by measuring the chemiluminescence in an Alliance Mini 4 16.15 gel documentation system (UVITEC Cambridge, UK).
ELISA
Intratumor testosterone (AVIVA Systems Biology, San Diego, CA, USA [OKCA00142]) and dihydrotestosterone (DHT) (Fine Test. Wuhan. China [EU2551]) concentrations were determined using a competitive Enzyme-Linked Immunosorbent Assay (ELISA) technique with tumor homogenates according to the manufacturers’ instructions. Absorbance at 450 nm was recorded. All experiments were performed in duplicate.
Statistical analysis
Statistical analyses were performed using GraphPad Prism 9.0 software. All in vitro experiments were performed in biological triplicates. The Shapiro-Wilk test was used to assess the normality of the data, and the Student’s T-test and Mann-Whitney test were used to compare the in vitro and in vivo data. The level of statistical significance was set to 5% (p ≤ 0.05).
Results
Cholesterol up-regulates coactivator gene and protein, consequently regulating AR in the PC-3 cell line
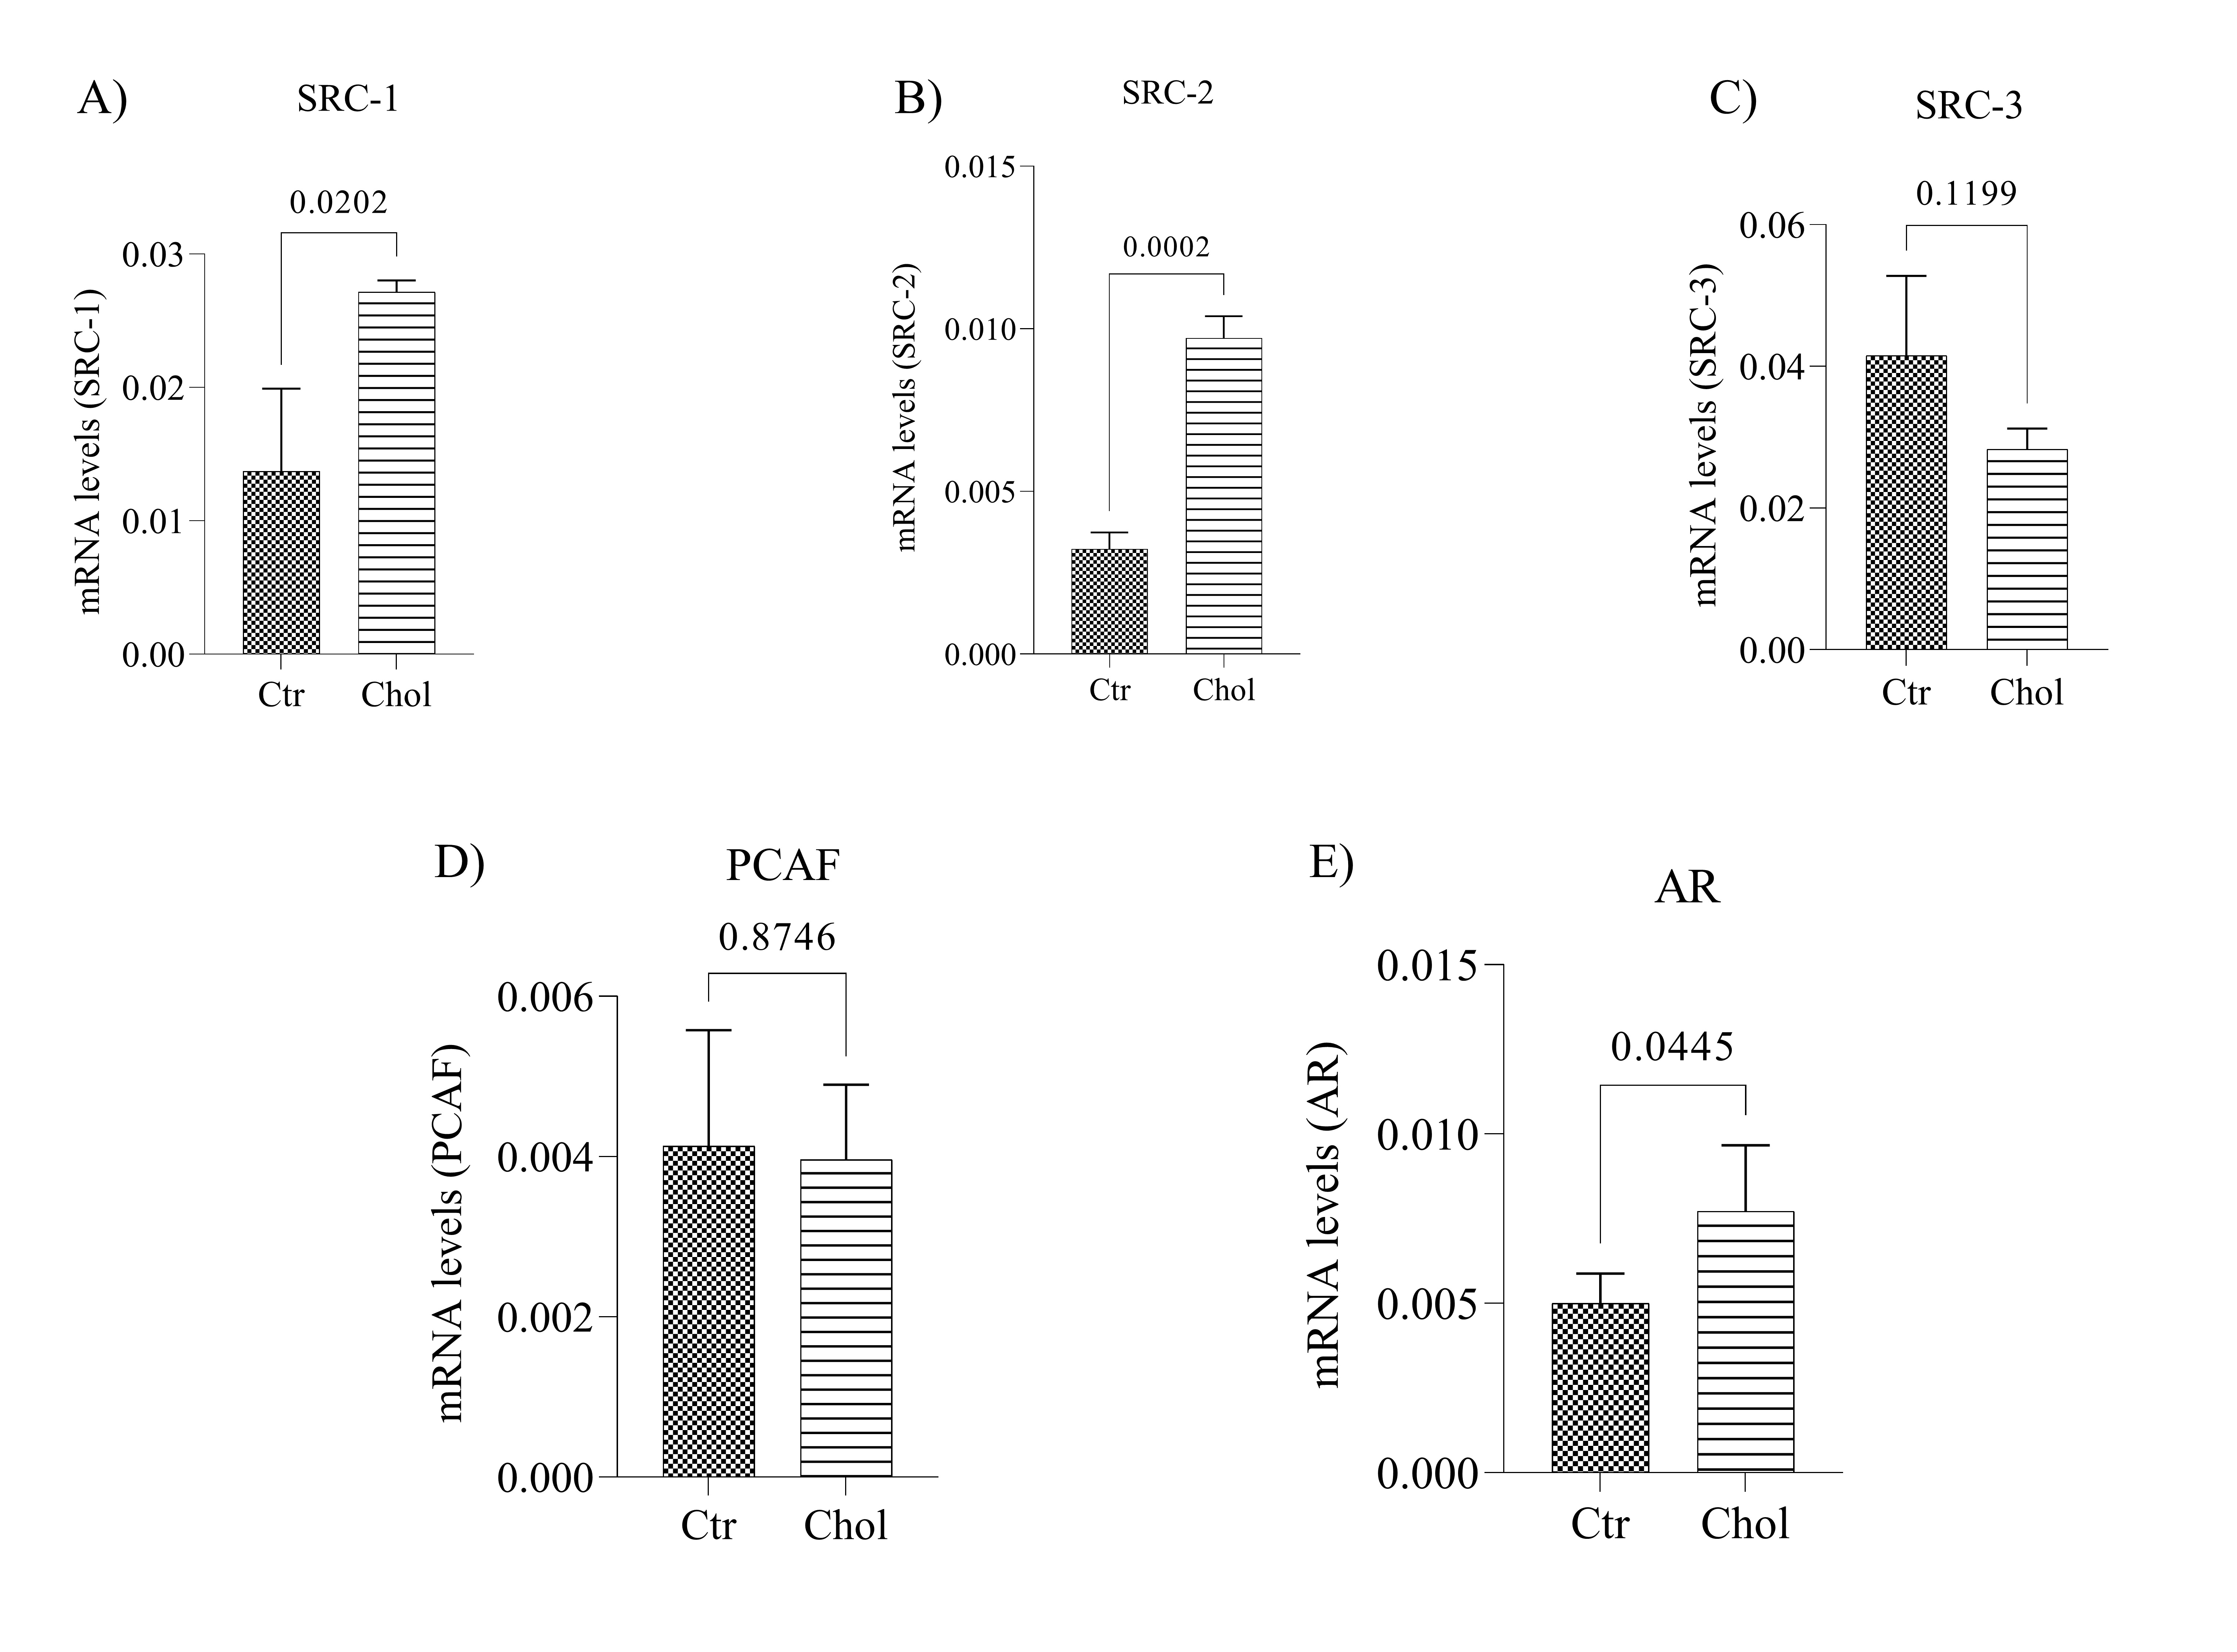
The qPCR data showed that cholesterol-supplemented cells displayed upregulated SRC-1 (Fig. 1A; p = 0.020), SRC-2 (Fig. 1B; p = 0.0002), gene expression compared to the control group, but did not affect SRC-3 (Fig. 1C; p = 0.119) and PCAF (Fig. 1D; p = 0.874) expression levels. The cholesterol-supplemented cells also exhibited significantly higher AR gene expression levels than the control group (Fig. 1E; p = 0.044). It is worth mentioning that these gene expression alterations were not observed in LNCaP cells following cholesterol supplementation (2 µg for 8 hours) (Supplementary Fig. 2).
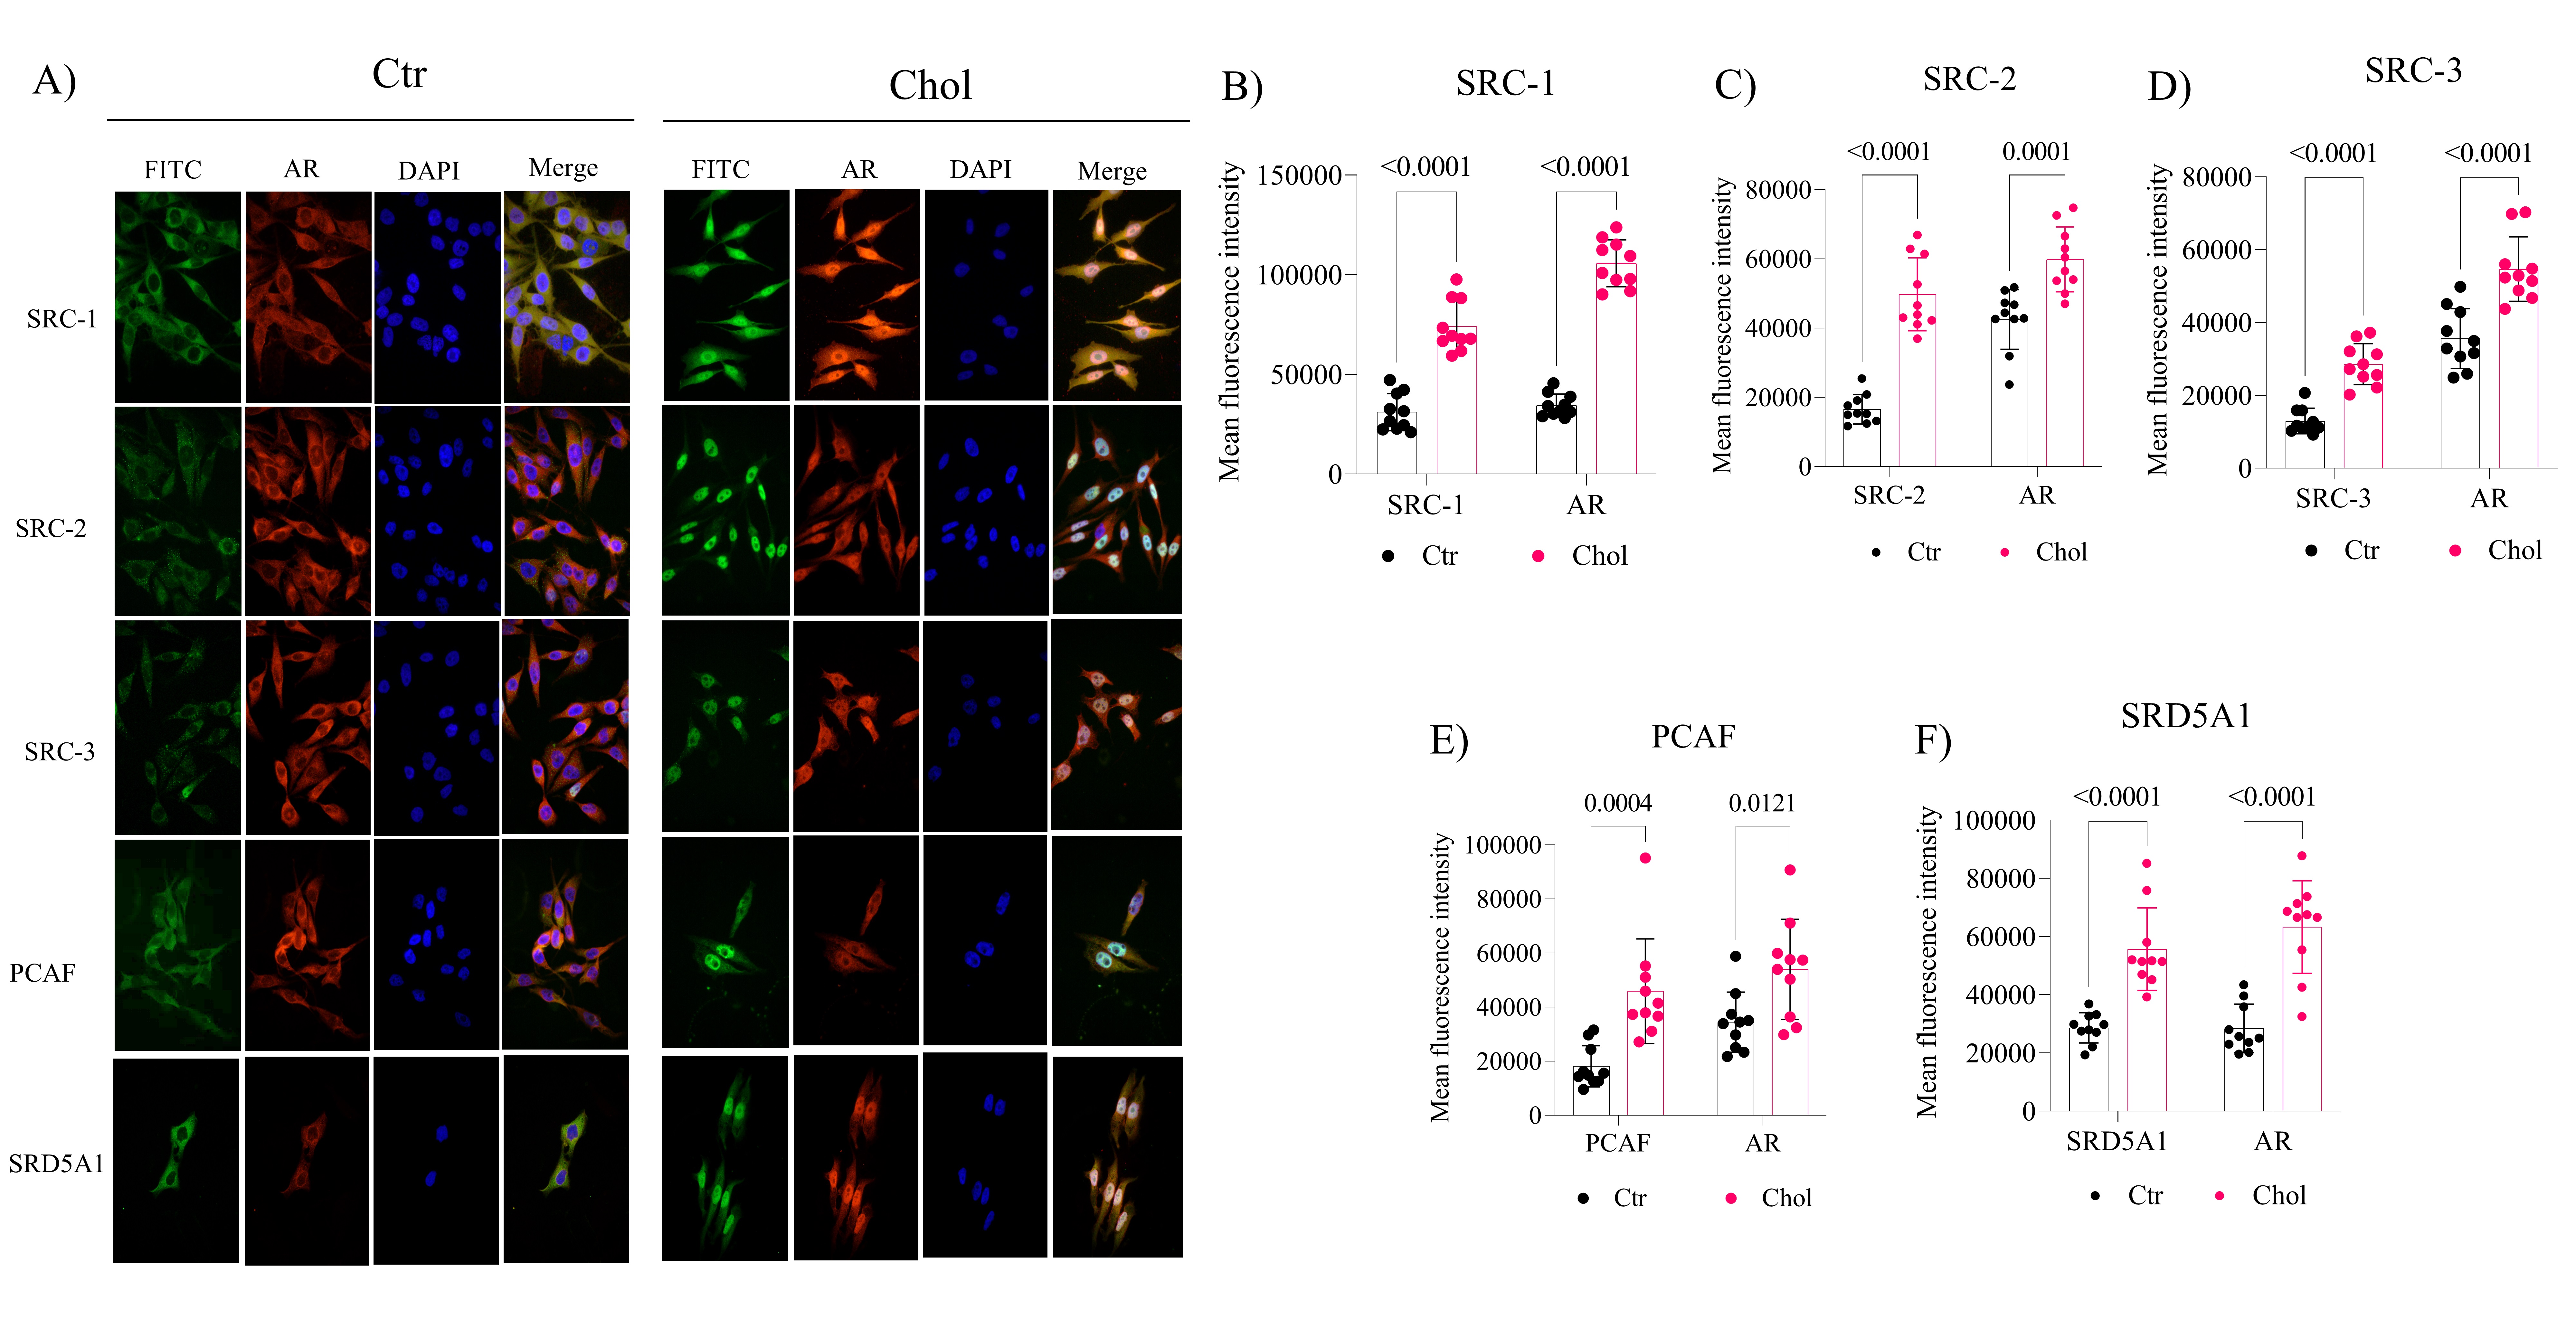
As shown in Fig. 2A, cholesterol-supplemented cells display upregulated protein expression of the p160 family coactivators SRC-1 (Fig. 2B; p < 0.0001), SRC-2 (Fig. 2C; p < 0.0001), SRC-3 (Fig. 2D; p < 0.0001), PCAF (Fig. 2E, p = 0.0004), and increased levels of AR after increased expression of coactivator proteins and cholesterol supplementation, followed by cytoplasmic-nucleus translocation. Subsequently, we investigated whether there was an increase in the androgen response element genes after increasing AR protein levels. We found that the SRD5A1 (Fig. 2F; < 0.0001) protein, which possesses this response element, was increased in the cholesterol-supplemented cells, where the increase in AR is observed.
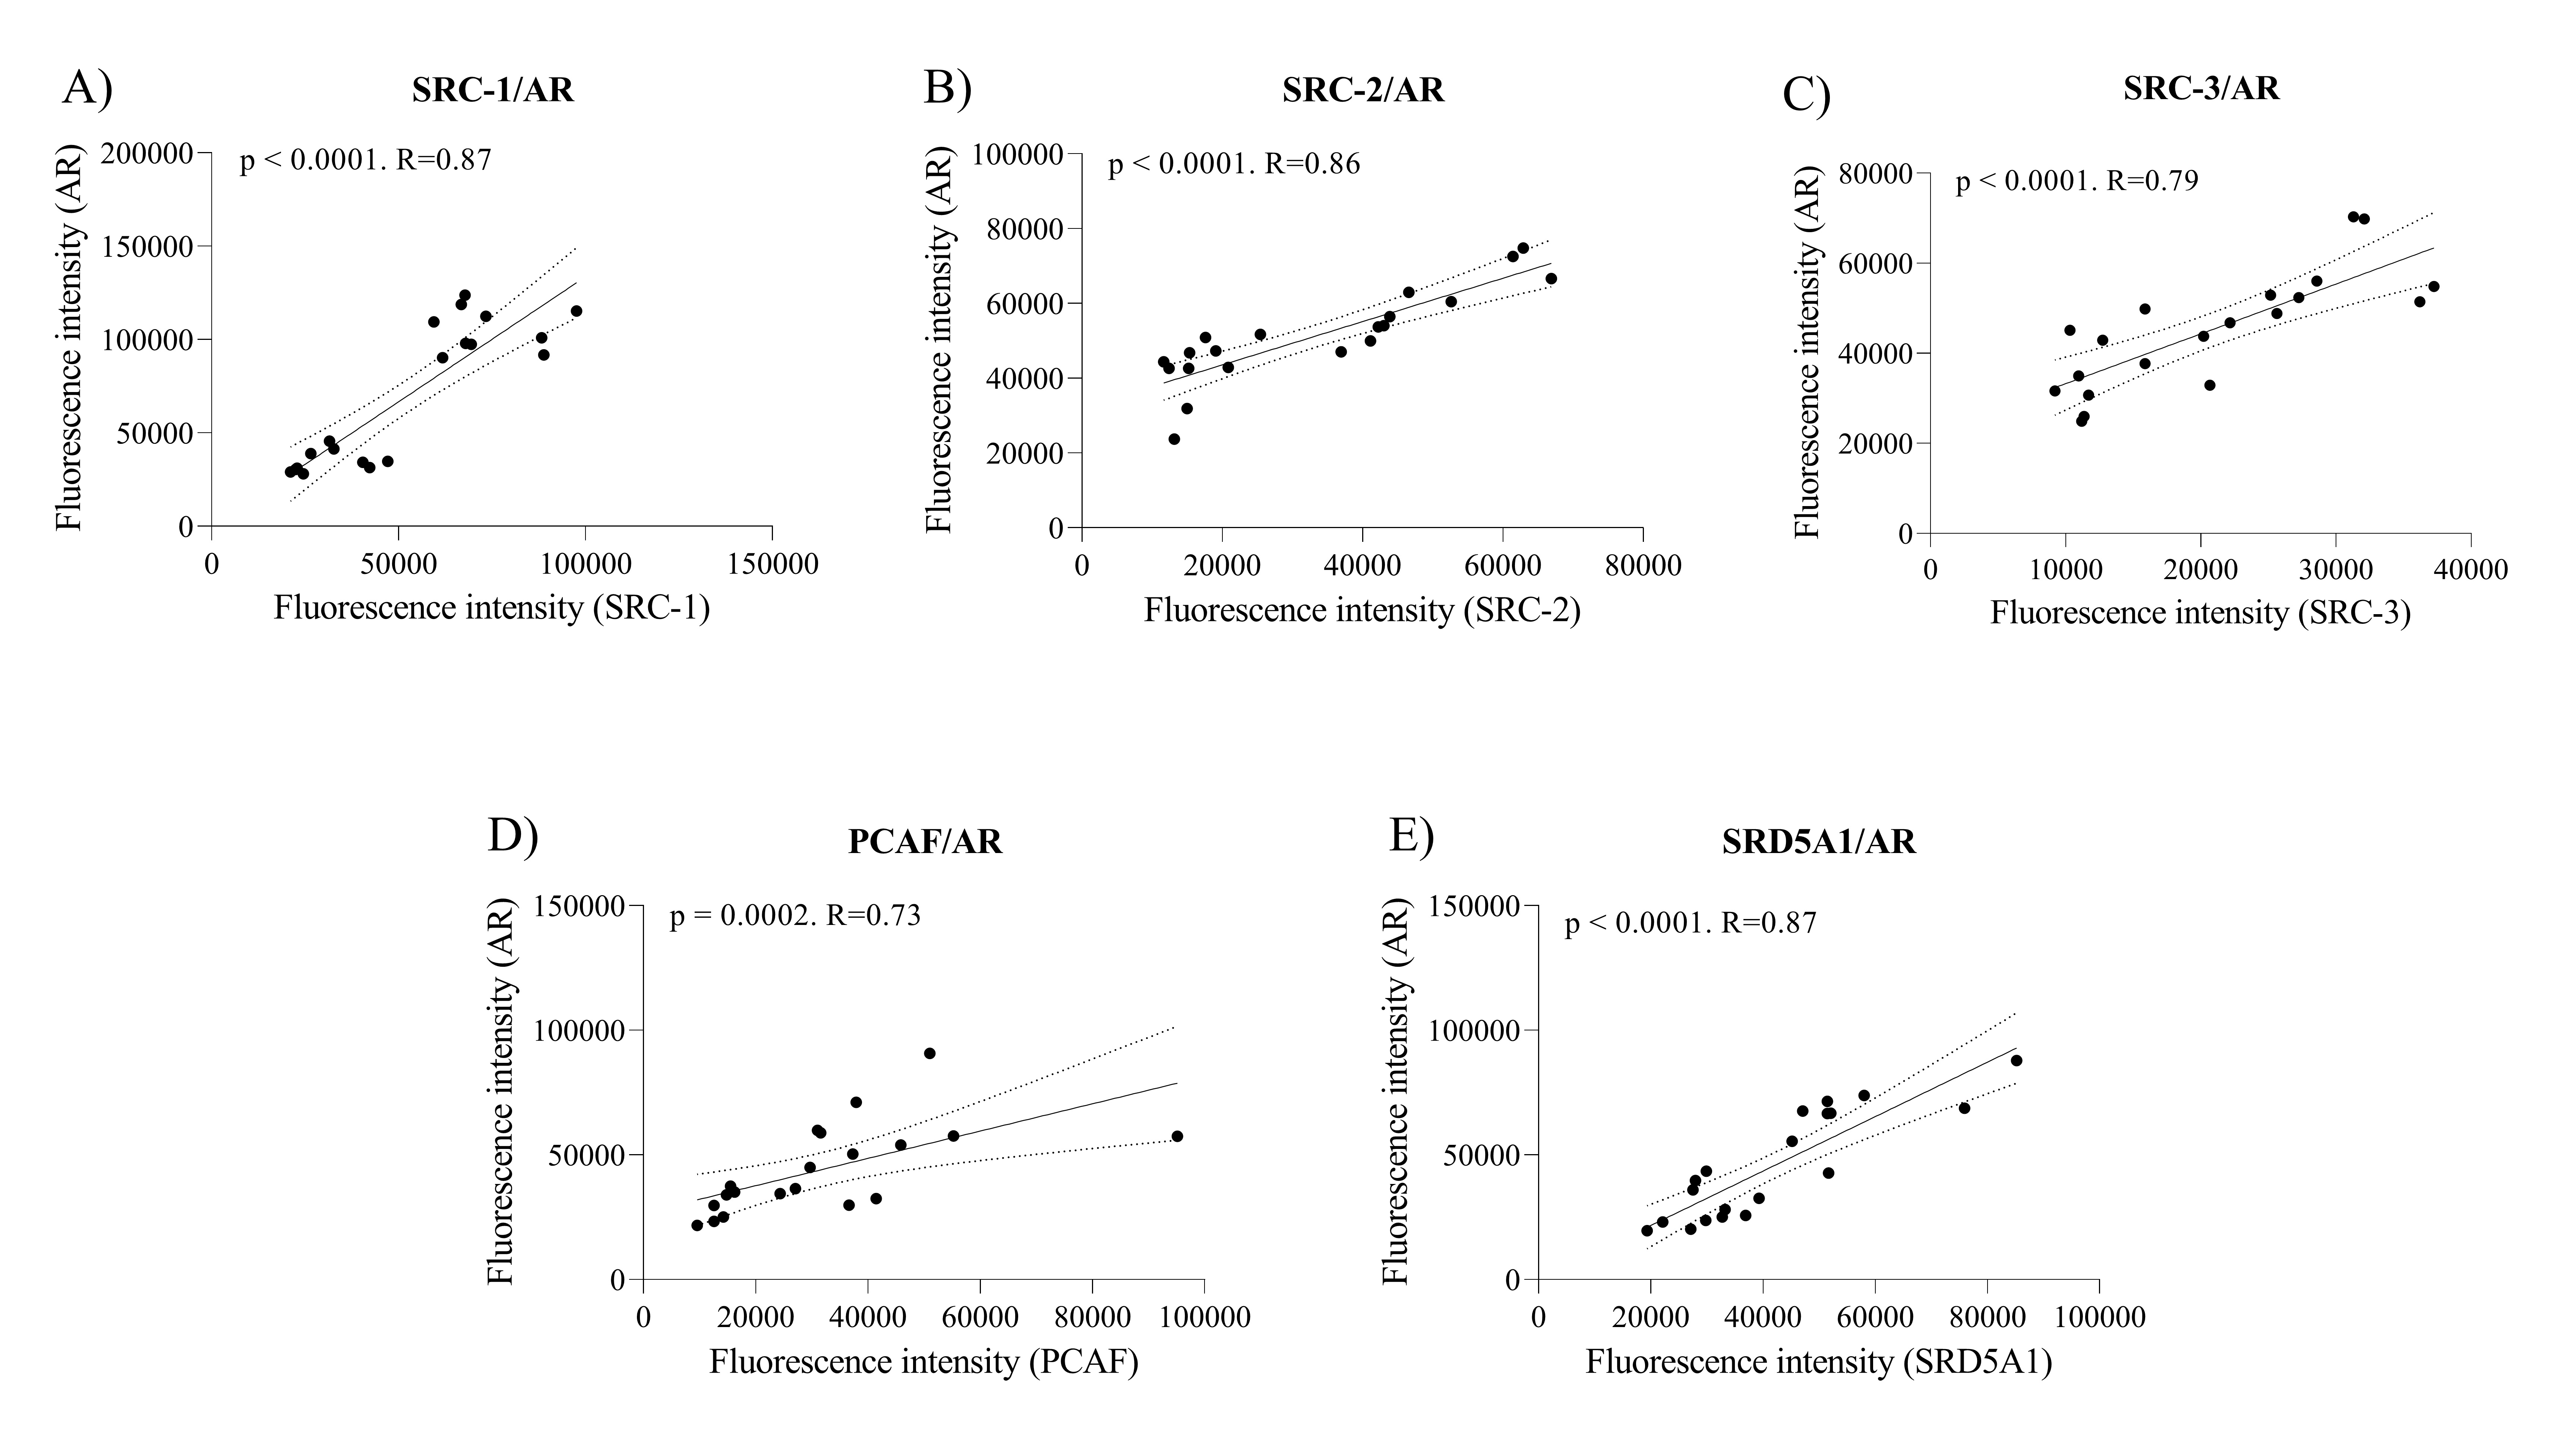
Subsequently, we investigated whether the increase in the coactivator proteins p160, PCAF and SRD5A1 triggered by cholesterol supplementation showed correlations with AR expression. We found that all proteins showed strong significant positive correlations, being SRC-1 (R = 0.87 and p < 0.0001, Fig. 3A), SRC-2 (R = 0.86 and p < 0.0001, Fig. 3B), SRC-3 (R = 0.79 and p < 0.0001, Fig. 3C), PCAF (R = 0.73 and p = 0.0002, Fig. 3D) and SRD5A1 (R = 0.87 and p < 0.0001, Fig. 3E).
Cholesterol supplementation attenuates apoptosis and increases cell proliferation and migration in castration-resistant prostate cancer cells
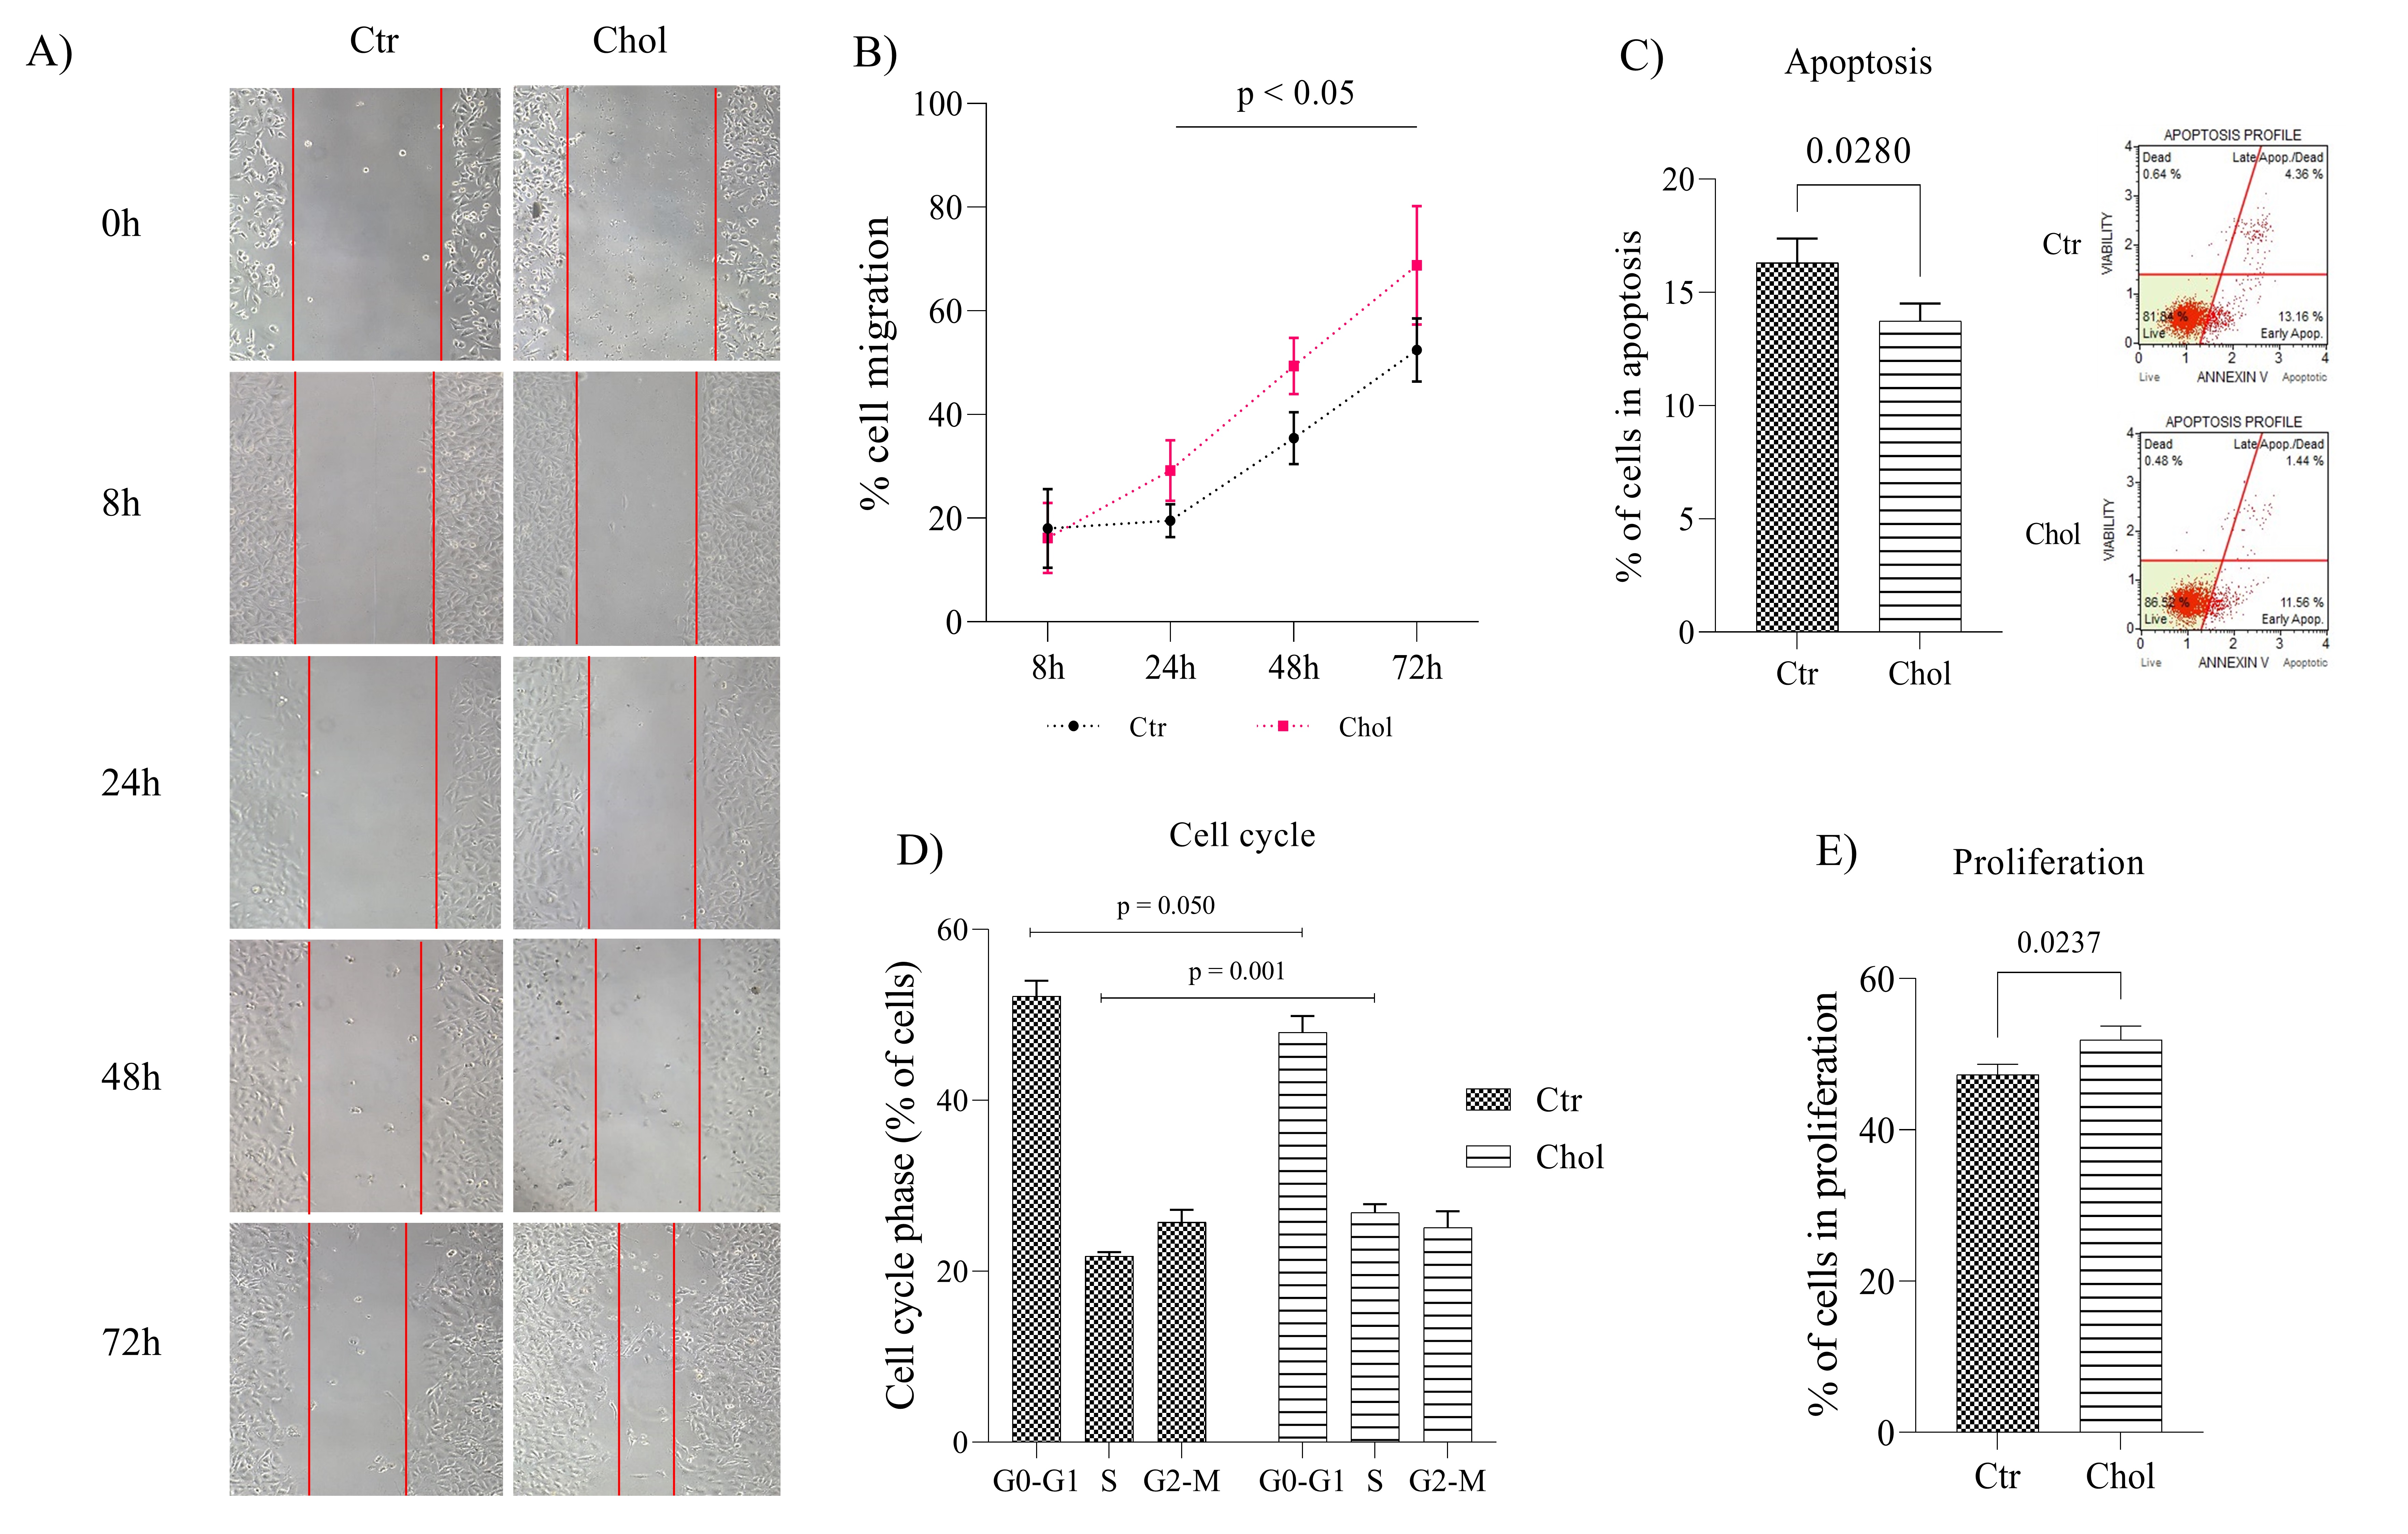
Exposing PC-3 cells to 2µg of cholesterol for 24h did not result in any significant difference in cell viability rate compared to control cells (Supplementary Fig. 3). Cell migration assay indicated that cholesterol-supplemented increased PC-3 cell migration after 24, 48 and 72 hours compared to control cells (Fig. 4A-B; p = 0.011, p = 0.002 and p = 0.022, respectively). Cholesterol-supplemented cells also displayed a lower apoptosis rate than the control group (Fig. 4C; p = 0.028).
Concerning the cell cycle, we observed a lower percentage of cholesterol-supplemented PC-3 cells in the G0-G1 phase and a higher rate of cells in the S phase than in the control group (Fig. 4D; p = 0.050 and p = 0.001, respectively). In contrast, there was no difference in the percentage of cells in the G2-M phase when comparing the two groups (Fig. 4D; p = 0.685). The percentage of cells in the G2-M and S phases of the cell cycle indicate that the cell proliferation rate of the cholesterol-treated cells was significantly higher than the control group (Fig. 4E; p = 0.023).
Diet-induced hypercholesterolemia contributes to castration-resistant prostate cancer progression in NOD/SCID mice
We employed a subcutaneous model of CRPC in male NOD/SCID mice to evaluate the effect of hypercholesterolemia on PCa (Fig. 5A). The animals were divided into two groups: the experimental group receiving a hypercholesterolemic diet (HCOL, N = 11) and the control group receiving a standard chow diet (Ctr, N = 11). The weights of the animals were measured every two days, and no significant difference was detected between the two groups (Supplementary Table 3; p > 0.05). The tumors were palpable 7-14 days after the PC-3 cell inoculation, and the tumor volume was measured every other day until the end of the experimental period. The HCOL group presented significantly larger tumor volumes throughout the experimental period (Supplementary Table 4; p < 0.01). At the end of the experimental period, the HCOL group’s tumor volume was 231.82% higher than the Ctr animals.
Between 24 and 30 days post-injection, HCOL and Ctr animals were euthanized, lipid profiles were performed on the serum, and the tumors were removed and weighed. Representative images of tumors from each group demonstrate that the tumors from the HCOL animals were more extensive than those from the Ctr group (Fig. 5B). Moreover, the tumors in the HCOL group were 171.78% heavier than Ctr group (Fig. 5C; p = 0.0143). Furthermore, while the HCOL group’s systemic cholesterol (Fig. 5D; p = 0.044) and LDL (Fig. 5E; p = 0.027) levels were significantly higher than the Ctr group, the HDL and triglyceride levels were similar (data not shown). The intratumoral cholesterol and triglyceride levels were also measured after tissue homogenization. Equivalent to the serum levels, the intratumoral cholesterol (Fig. 5F; p = 0.05) and triglycerides (Fig. 5G; p = 0.033) levels were elevated in the HCOL group compared to the Ctr animals. The ELISA assays demonstrated that testosterone levels in the HCOL group were significantly higher than Ctr group (Fig. 5H; p = 0.038). There was a tendency for the DHT concentrations to be elevated in the HCOL group compared to the Ctr; however, with a marginal statistical difference (Fig. 5I; p = 0.053).
Relationship between the high lipid profile and AR cofactors expression in PCa
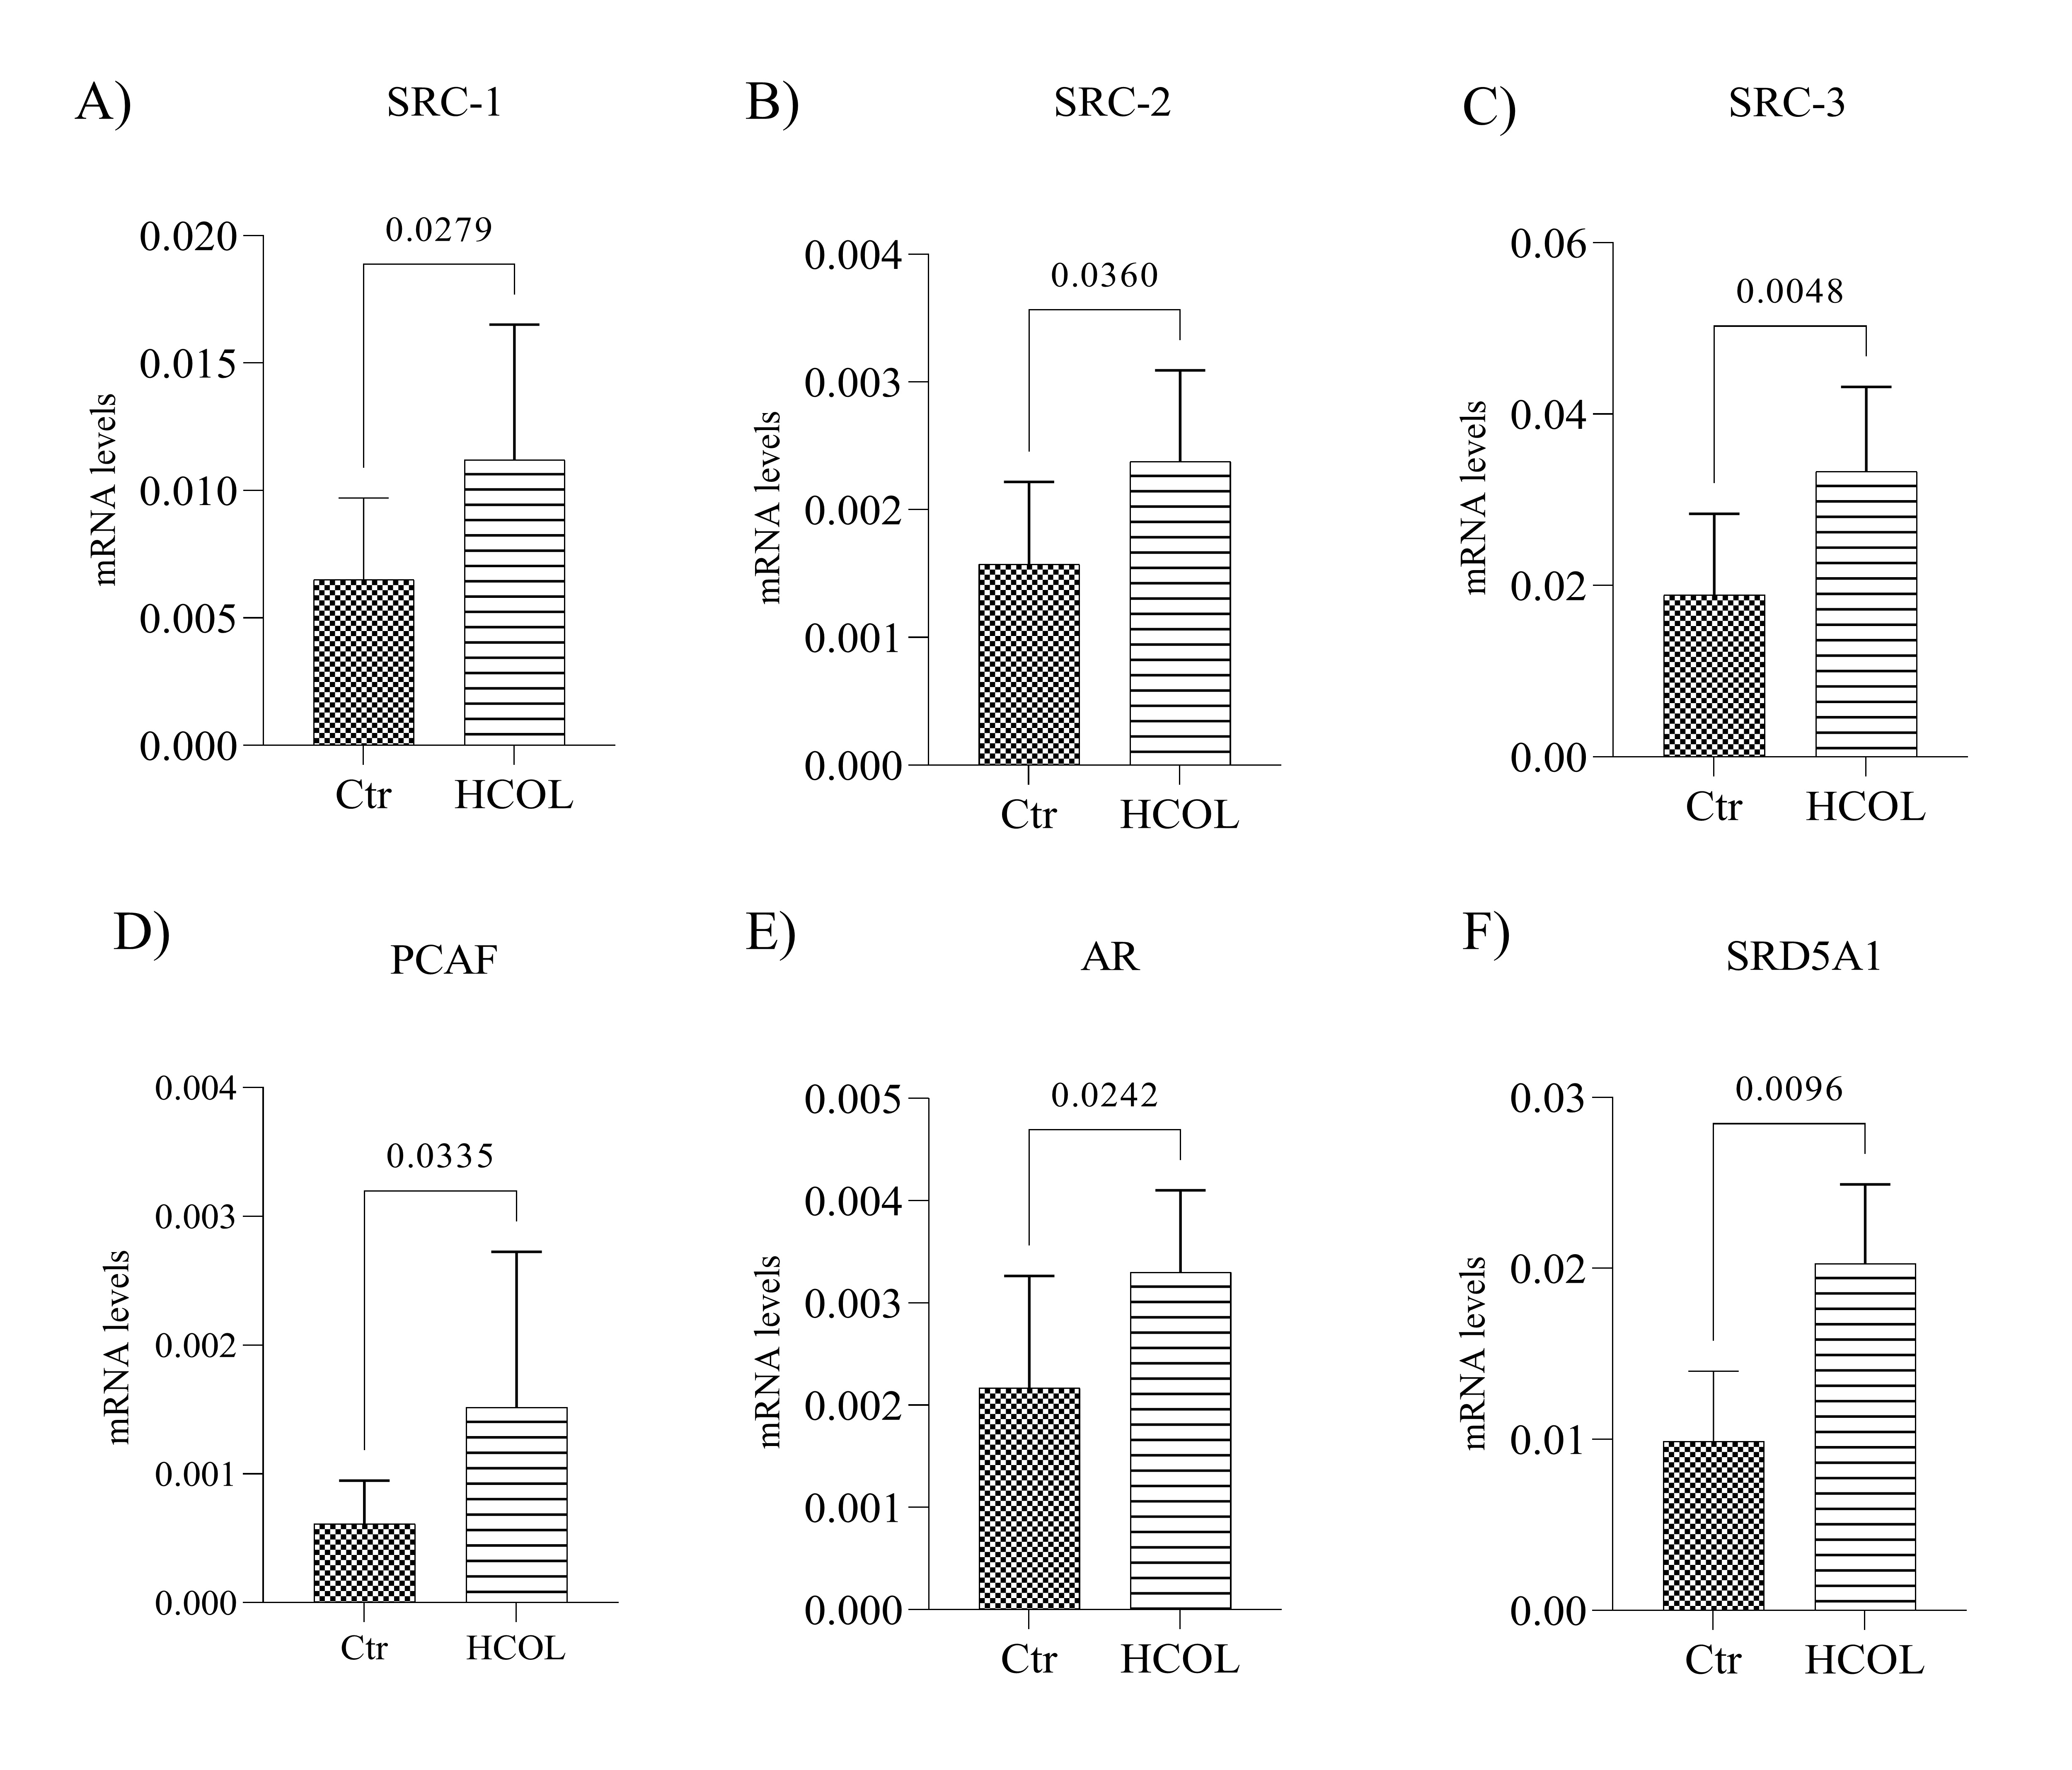
We evaluated the gene expression of SRC-1, SRC-2, SRC-3, PCAF, AR, and SRD5A1 in the tumors from HCOL and Ctr animals. As shown in Fig. 6A-C, the expression of p160 family genes, SRC-1, SRC-2 and SRC-3, was upregulated in the HCOL group compared to the Ctr animals (p = 0.027, p = 0.036 and p = 0.004, respectively). Moreover, we observed a 2.45-fold increase in the expression of PCAF in the HCOL group compared to the Ctr group (Fig. 6D; p = 0.033). Interestingly, AR gene expression levels were also higher in the HCOL group when compared to the Ctr group (Fig. 6E; p = 0.024), a result also observed in the in vitro experiments. Furthermore, up-regulated SRD5A1 gene expression, which is responsible for androgen conversion, was higher in the HCOL group than in the Ctr group (Fig. 6F, p = 0.009).
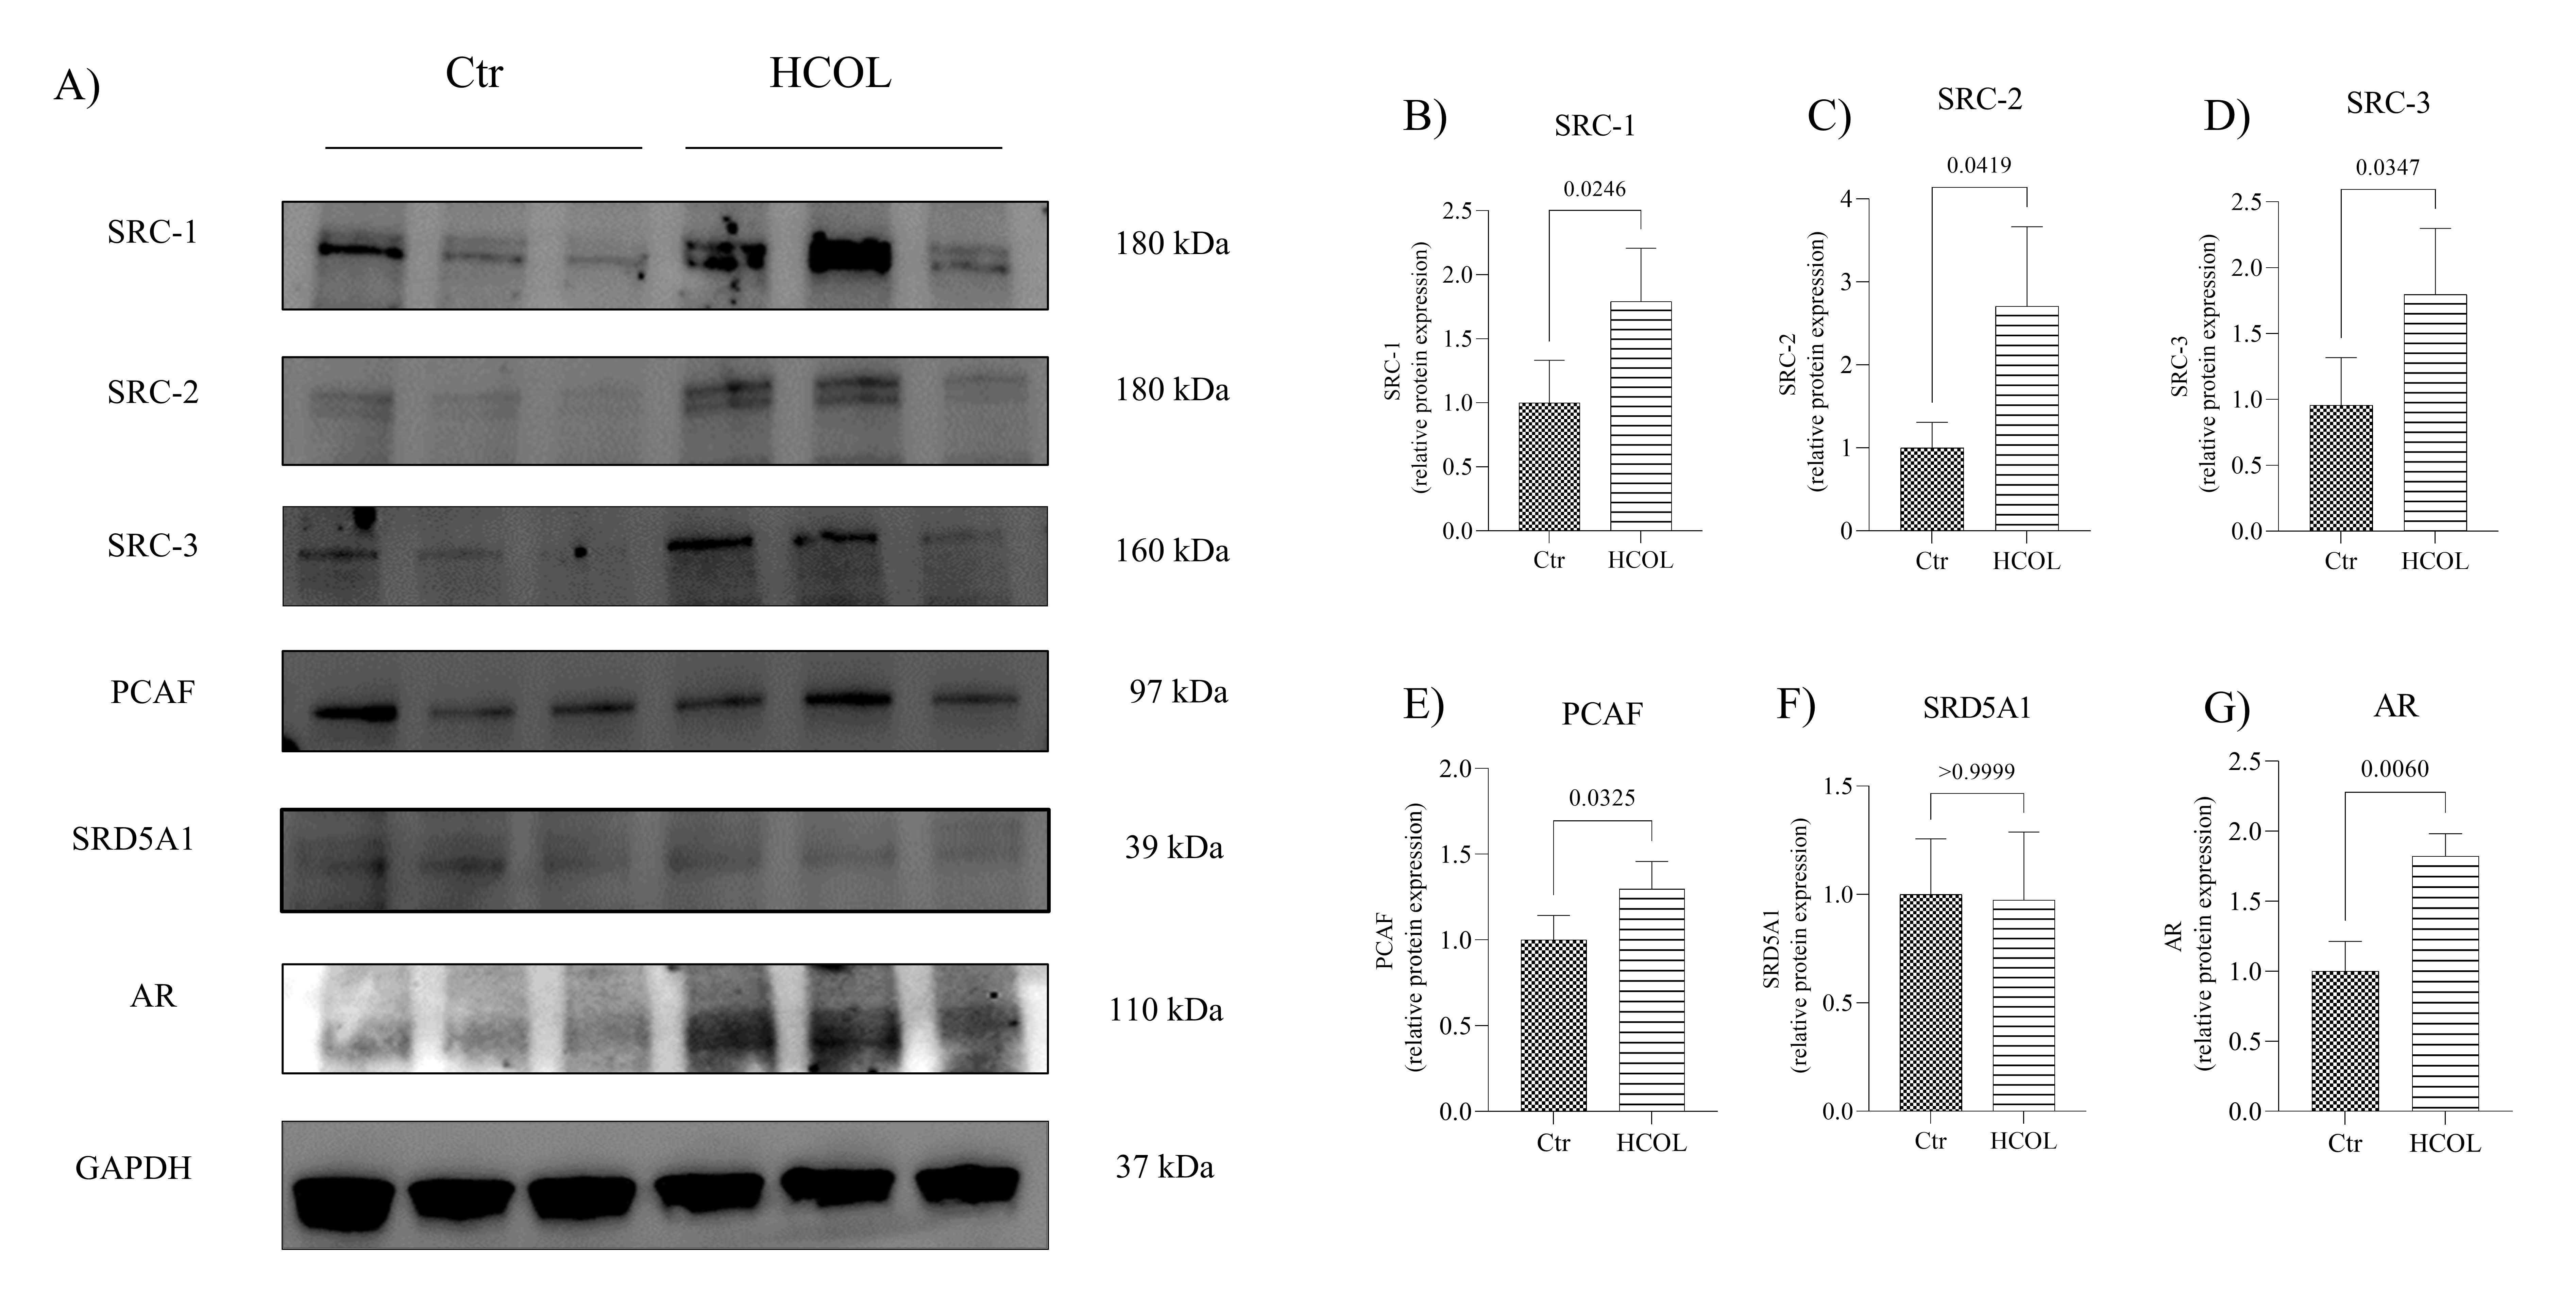
Western blot assay was employed to determine whether cholesterol would also impact the protein expression of the AR coactivators. Representative blots are presented in Fig. 7A. As shown in Fig. 7B-D, SRC-1, SRC-2 and SRC-3 protein expression was upregulated in the HCOL group when compared to the Ctr animals (p = 0.024, p = 0.041 and p = 0.034, respectively). We also detected higher PCAF (Fig. 7E; p = 0.032) protein expression in the HCOL group than in the Ctr group. In the in vivo model, SRD5A1 protein expression remained unchanged when comparing the two groups (Fig. 7F; p > 0.999). However, we did detect significantly increased AR protein levels in the HCOL group compared to Ctr animals (Fig. 7G; p = 0.006). The full images are presented in Supplementary Fig. 4.
AR (Androgen Receptor); cDNA (complementary DNA); Chol (Cholesterol); CRPC (Castration-Resistant Prostate Cancer); Ctr (Control); DHT (Dihydrotestosterone); ELISA (Enzyme-Linked Immunosorbent Assay); FBS (Fetal Bovine Serum); GAPDH (Glyceraldehyde-3-Phosphate Dehydrogenase); HCOL (Hypercholesterolemic); HDL (High-Density Lipoproteins); LDL (Low-Density Lipoproteins); PBS (Phosphate-Buffered Saline); PCa (Prostate Cancer); PCAF (p300/CBP-associated factor); SRC-1 (NCOA1) (Nuclear Receptor Coactivator 1); SRC-2 (NCOA2) (Nuclear Receptor Coactivator 2); SRC-3 (NCOA3) (Nuclear Receptor Coactivator 3); SRD5A1 (Steroid 5-Alpha-Reductase 1); STR (Short Tandem Repeat).
We thank Prof.ª Dr.ª Edna Frasson de Souza Montero for making the Bioterium of the Anesthesiology Laboratory of the Hospital das Clínicas of the Faculty of Medicine (LIM08) available for in vivo experiments and also to Mr. Mario Matsuo Itinoshe for the support with the animals. To Dr. Ana Flávia Marçal for the support with the antibody for the Western blot. To Dr.ª Margoth R. Garnica, for the support in the use of confocal microscopy. To Prof.ª Dr.ª Lucia Andrade and Dr.ª Talita Rojas for the support in the use of ELISA reader. We thank Fundação de Amparo à Pesquisas do Estado de São Paulo (FAPESP) for the grant.
Author Contributions
Pimenta R: Conceptualization, formal analysis, writing-original draft, writing-review and editing. Camargo J A: Methodology. Candido P: Methodology. Ghazarian V: Methodology. Gonçalves G L: Methodology. Guimarães V R: Methodology. Romão P: Methodology. Chiovatto C: Methodology. Mioshi C M: Methodology. Santos G A: Methodology. Silva I A: Methodology. Leite K R: Supervision, writing-review. Birbair A: Writing-review and editing. Srougi M: Conceptualization, writing-review. Nahas W: Conceptualization, writing-review. Viana N I: Supervision, methodology. Reis S T: Resources, supervision funding acquisition, methodology, writing-review and editing.
Funding
This work was supported by grants from the São Paulo Research Foundation (FAPESP) to Ruan Pimenta (2019/00156-7), Vitória Ghazarian (2019/19138-9), Juliana Alves de Camargo (2018/19906-3), Caroline Chiovatto (2021/02341-6), Guilherme Lopes Gonçalves (2018/26528-5) and Sabrina T. Reis (2020/01317-1).
Statement of Ethics
This study was submitted and approved by the Research Ethics Committee of the University of Sao Paulo Medical School under the number #1119/2018.
The authors declare that no conflict of interests exists.
| 1 So A, Gleave M, Hurtado-Col A, Nelson C: Mechanisms of the development of androgen independence in prostate cancer. World J Urol 2005;23:1-9. https://doi.org/10.1007/s00345-004-0473-1 |
||||
| 2 Dillard PR, Lin MF, Khan SA: Androgen-independent prostate cancer cells acquire the complete steroidogenic potential of synthesizing testosterone from cholesterol. Mol Cell Endocrinol 2008;295:115-120. https://doi.org/10.1016/j.mce.2008.08.013 |
||||
| 3 Fedoruk MN, Giménez-Bonafé P, Guns ES, Mayer LD, Nelson CC: P-glycoprotein increases the efflux of the androgen dihydrotestosterone and reduces androgen responsive gene activity in prostate tumor cells. Prostate 2004;59:77-90. https://doi.org/10.1002/pros.10354 |
||||
| 4 Culig Z: Androgen receptor cross-talk with cell signalling pathways. Growth Factors 2004;22:179-184. https://doi.org/10.1080/08977190412331279908 |
||||
| 5 Chmelar R, Buchanan G, Need EF, Tilley W, Greenberg NM: Androgen receptor coregulators and their involvement in the development and progression of prostate cancer. Int J Cancer 2007;120:719-733. https://doi.org/10.1002/ijc.22365 |
||||
| 6 Han G, Buchanan G, Ittmann M, Harris JM, Yu X, Demayo FJ, Tilley W, Greenberg NM: Mutation of the androgen receptor causes oncogenic transformation of the prostate. Proc Natl Acad Sci U S A 2005;102:1151-1156. https://doi.org/10.1073/pnas.0408925102 |
||||
| 7 Feldman BJ, Feldman D: The development of androgen-independent prostate cancer. Nat Rev Cancer 2001;1:34-45. https://doi.org/10.1038/35094009 |
||||
| 8 McKenna NJ, O'Malley BW: Combinatorial control of gene expression by nuclear receptors and coregulators. Cell 2002;108:465-474. https://doi.org/10.1016/S0092-8674(02)00641-4 |
||||
| 9 Linja MJ, Porkka KP, Kang Z, Savinainen KJ, Jänne OA, Tammela TL, Vessella RL, Palvimo JJ, Visakorpi T: Expression of androgen receptor coregulators in prostate cancer. Clin Cancer Res 2004;10:1032-1040. https://doi.org/10.1158/1078-0432.CCR-0990-3 |
||||
| 10 Xu J, Wu RC, O'Malley BW: Normal and cancer-related functions of the p160 steroid receptor co-activator (SRC) family. Nat Rev Cancer 2009;9:615-630. https://doi.org/10.1038/nrc2695 |
||||
| 11 McKenna NJ, O'Malley BW: Minireview: nuclear receptor coactivators--an update. Endocrinology 2002;143:2461-2465. https://doi.org/10.1210/endo.143.7.8892 |
||||
| 12 Foley C, Mitsiades N: Moving Beyond the Androgen Receptor (AR): Targeting AR-Interacting Proteins to Treat Prostate Cancer. Horm Cancer 2016;7:84-103. https://doi.org/10.1007/s12672-015-0239-9 |
||||
| 13 Yan J, Erdem H, Li R, Cai Y, Ayala G, Ittmann M, Yu-Lee LY, Tsai SY, Tsai MJ: Steroid receptor coactivator-3/AIB1 promotes cell migration and invasiveness through focal adhesion turnover and matrix metalloproteinase expression. Cancer Res 2008;68:5460-5468. https://doi.org/10.1158/0008-5472.CAN-08-0955 |
||||
| 14 Dasgupta S, Putluri N, Long W, Zhang B, Wang J, Kaushik AK, Arnold JM, Bhowmik SK, Stashi E, Brennan CA, Rajapakshe K, Coarfa C, Mitsiades N, Ittmann MM, Chinnaiyan AM, Sreekumar A, O'Malley BW: Coactivator SRC-2-dependent metabolic reprogramming mediates prostate cancer survival and metastasis. J Clin Invest 2015;125:1174-1188. https://doi.org/10.1172/JCI76029 |
||||
| 15 Isharwal S, Miller MC, Marlow C, Makarov DV, Partin AW, Veltri RW: p300 (histone acetyltransferase) biomarker predicts prostate cancer biochemical recurrence and correlates with changes in epithelia nuclear size and shape. Prostate 2008;68:1097-1104. https://doi.org/10.1002/pros.20772 |
||||
| 16 Comuzzi B, Nemes C, Schmidt S, Jasarevic Z, Lodde M, Pycha A, Bartsch G, Offner F, Culig Z, Hobisch A: The androgen receptor co-activator CBP is up-regulated following androgen withdrawal and is highly expressed in advanced prostate cancer. J Pathol 2004;204:159-166. https://doi.org/10.1002/path.1609 |
||||
| 17 Gregory CW, He B, Johnson RT, Ford OH, Mohler JL , French FS, Wilson EM: A mechanism for androgen receptor-mediated prostate cancer recurrence after androgen deprivation therapy. Cancer Res 2001;61:4315-4319. | ||||
| 18 Culig Z, Steiner H, Bartsch G, Hobisch A: Mechanisms of endocrine therapy-responsive and -unresponsive prostate tumours. Endocr Relat Cancer 2005;12:229-244. https://doi.org/10.1677/erc.1.00775a |
||||
| 19 Debes JD, Schmidt LJ, Huang H, Tindall DJ: p300 mediates androgen-independent transactivation of the androgen receptor by interleukin 6. Cancer Res 2002;62:5632-5636. | ||||
| 20 Swinnen JV, Heemers H, Heyns W, Verhoeven G: Androgen regulation of lipogenesis. Adv Exp Med Biol 2002;506:379-387. https://doi.org/10.1007/978-1-4615-0717-8_55 |
||||
| 21 Mah CY, Nassar ZD, Swinnen JV, Butler LM: Lipogenic effects of androgen signaling in normal and malignant prostate. Asian J Urol 2020;7:258-270. https://doi.org/10.1016/j.ajur.2019.12.003 |
||||
| 22 Moon H, Ruelcke JE, Choi E, Sharpe LJ, Nassar ZD, Bielefeldt-Ohmann H, Parat MO, Shah A, Francois M, Inder KL, Brown AJ, Russell PJ, Parton RG, Hill MM: Diet-induced hypercholesterolemia promotes androgen-independent prostate cancer metastasis via IQGAP1 and caveolin-1. Oncotarget 2015;6:7438-7453. https://doi.org/10.18632/oncotarget.3476 |
||||
| 23 Rocha GZ, Dias MM, Ropelle ER, Osório-Costa F, Rossato FA, Vercesi AE, Saad MJ, Carvalheira JB: Metformin amplifies chemotherapy-induced AMPK activation and antitumoral growth. Clin Cancer Res 2011;17:3993-4005. https://doi.org/10.1158/1078-0432.CCR-10-2243 |
||||
| 24 Saylor PJ, Smith MR: Metabolic complications of androgen deprivation therapy for prostate cancer. J Urol 2013;189:S34-42; discussion S43-34. https://doi.org/10.1016/j.juro.2012.11.017 |
||||
| 25 Alfaqih MA, Allott EH, Hamilton RJ, Freeman MR, Freedland SJ: The current evidence on statin use and prostate cancer prevention: are we there yet? Nat Rev Urol 2017;14:107-119. https://doi.org/10.1038/nrurol.2016.199 |
||||
| 26 Jamnagerwalla J, Howard LE, Allott EH, Vidal AC, Moreira DM, Castro-Santamaria R, Andriole GL, Freeman MR, Freedland SJ: Serum cholesterol and risk of high-grade prostate cancer: results from the REDUCE study. Prostate Cancer Prostatic Dis 2018;21:252-259. https://doi.org/10.1038/s41391-017-0030-9 |
||||
| 27 Awad AB, Fink CS, Williams H, Kim U: In vitro and in vivo (SCID mice) effects of phytosterols on the growth and dissemination of human prostate cancer PC-3 cells. Eur J Cancer Prev 2001;10:507-513. https://doi.org/10.1097/00008469-200112000-00005 |
||||
| 28 Armandari I, Hamid AR, Verhaegh G, Schalken J: Intratumoral steroidogenesis in castration-resistant prostate cancer: a target for therapy. Prostate Int 2014;2:105-113. https://doi.org/10.12954/PI.14063 |
||||
| 29 Agoulnik IU, Vaid A, Bingman WE, Erdeme H, Frolov A, Smith CL, Ayala G, Ittmann MM, Weigel NL: Role of SRC-1 in the promotion of prostate cancer cell growth and tumor progression. Cancer Res 2005;65:7959-7967. https://doi.org/10.1158/0008-5472.CAN-04-3541 |
||||
| 30 Dasgupta S, Lonard DM, O'Malley BW: Nuclear receptor coactivators: master regulators of human health and disease. Annu Rev Med 2014;65:279-292. https://doi.org/10.1146/annurev-med-051812-145316 |
||||
| 31 Zhou HJ, Yan J, Luo W, Ayala G, Lin SH, Erdem H, Ittmann M, Tsai SY, Tsai MJ: SRC-3 is required for prostate cancer cell proliferation and survival. Cancer Res 2005;65:7976-7983. https://doi.org/10.1158/0008-5472.CAN-04-4076 |
||||
| 32 Louet JF, Coste A, Amazit L, Tannour-Louet M, Wu RC, Tsai SY, Tsai MJ, Auwerx J, O'Malley BW: Oncogenic steroid receptor coactivator-3 is a key regulator of the white adipogenic program. Proc Natl Acad Sci U S A 2006;103:17868-17873. https://doi.org/10.1073/pnas.0608711103 |
||||
| 33 Jin L, Garcia J, Chan E, de la Cruz C, Segal E, Merchant M, Kharbanda S, Raisner R, Haverty PM, Modrusan Z, Ly J, Choo E, Kaufman S, Beresini MH, Romero FA, Magnuson S, Gascoigne KE: Therapeutic Targeting of the CBP/p300 Bromodomain Blocks the Growth of Castration-Resistant Prostate Cancer. Cancer Res 2017;77:5564-5575. https://doi.org/10.1158/0008-5472.CAN-17-0314 |
||||
| 34 Lavery DN, Bevan CL: Androgen receptor signalling in prostate cancer: the functional consequences of acetylation. J Biomed Biotechnol 2011;2011:862125. https://doi.org/10.1155/2011/862125 |
||||
| 35 Lee SO, Chun JY, Nadiminty N, Lou W, Feng S, Gao AC: Interleukin-4 activates androgen receptor through CBP/p30. Prostate 2009;69:126-132. https://doi.org/10.1002/pros.20865 |
||||
| 36 Gu ML, Wang YM, Zhou XX, Yao HP, Zheng S, Xiang Z, Ji F: An inhibitor of the acetyltransferases CBP/p300 exerts antineoplastic effects on gastrointestinal stromal tumor cells. Oncol Rep 2016;36:2763-2770. https://doi.org/10.3892/or.2016.5080 |
||||
| 37 Russell DW, Wilson JD: Steroid 5 alpha-reductase: two genes/two enzymes. Annu Rev Biochem 1994;63:25-61. https://doi.org/10.1146/annurev.bi.63.070194.000325 |
||||
| 38 Chang KH, Li R, Papari-Zareei M, Watumull L, Zhao YD, Auchus RJ, Sharifi N: Dihydrotestosterone synthesis bypasses testosterone to drive castration-resistant prostate cancer. Proc Natl Acad Sci U S A 2011;108:13728-13733. https://doi.org/10.1073/pnas.1107898108 |
||||
| 39 Kaighn ME, Narayan KS, Ohnuki Y, Lechner JF, Jones LW: Establishment and characterization of a human prostatic carcinoma cell line (PC-3). Invest Urol 1979;17:16-23. | ||||
| 40 Castagnetta L, Carruba G, Granata OM, Lo Casto M, Arcuri F, Mesiti M, Pavone-Macaluso M: Prostate long-term epithelial cell lines. Biological and biochemical features. Ann N Y Acad Sci 1990;595:149-164. https://doi.org/10.1111/j.1749-6632.1990.tb34289.x |
||||
| 41 Pimenta RC, Viana NI, Amaral GQ, Park R, Morais DR, Pontes J, Guimaraes VR, Camargo JA, Leite KR, Nahas WC, Srougi M, Reis ST: MicroRNA-23b and microRNA-27b plus flutamide treatment enhances apoptosis rate and decreases CCNG1 expression in a castration-resistant prostate cancer cell line. Tumour Biol 2018;40:1010428318803011. https://doi.org/10.1177/1010428318803011 |
||||
| 42 Culig Z, Klocker H, Eberle J, Kaspar F, Hobisch A, Cronauer MV, Bartsch G: DNA sequence of the androgen receptor in prostatic tumor cell lines and tissue specimens assessed by means of the polymerase chain reaction. Prostate 1993;22:11-22. https://doi.org/10.1002/pros.2990220103 |
||||
| 43 Sica G, Dell'Acqua G, Iacopino F, Fattorossi A, Marchetti P, van der Kwast TH, Pavone-Macaluso M: Androgen receptors and hormone sensitivity of a human prostatic cancer cell line (PC-3) are modulated by natural beta-interferon. Urol Res 1994;22:33-38. https://doi.org/10.1007/BF00431546 |
||||
| 44 Alimirah F, Chen J, Basrawala Z, Xin H, Choubey D: DU-145 and PC-3 human prostate cancer cell lines express androgen receptor: implications for the androgen receptor functions and regulation. FEBS Lett 2006;580:2294-2300. https://doi.org/10.1016/j.febslet.2006.03.041 |
||||
| 45 Fiandalo MV, Wilton J, Mohler JL: Roles for the backdoor pathway of androgen metabolism in prostate cancer response to castration and drug treatment. Int J Biol Sci 2014;10:596-601. https://doi.org/10.7150/ijbs.8780 |
||||